

Alterations in sucrose sham-feeding intake as a function of diet-exposure in rats maintained on calorically dense diets
- PMID: 25987540
- PMCID: PMC4499488
- DOI: 10.1016/j.appet.2015.05.014
Alterations in sucrose sham-feeding intake as a function of diet-exposure in rats maintained on calorically dense diets
Abstract
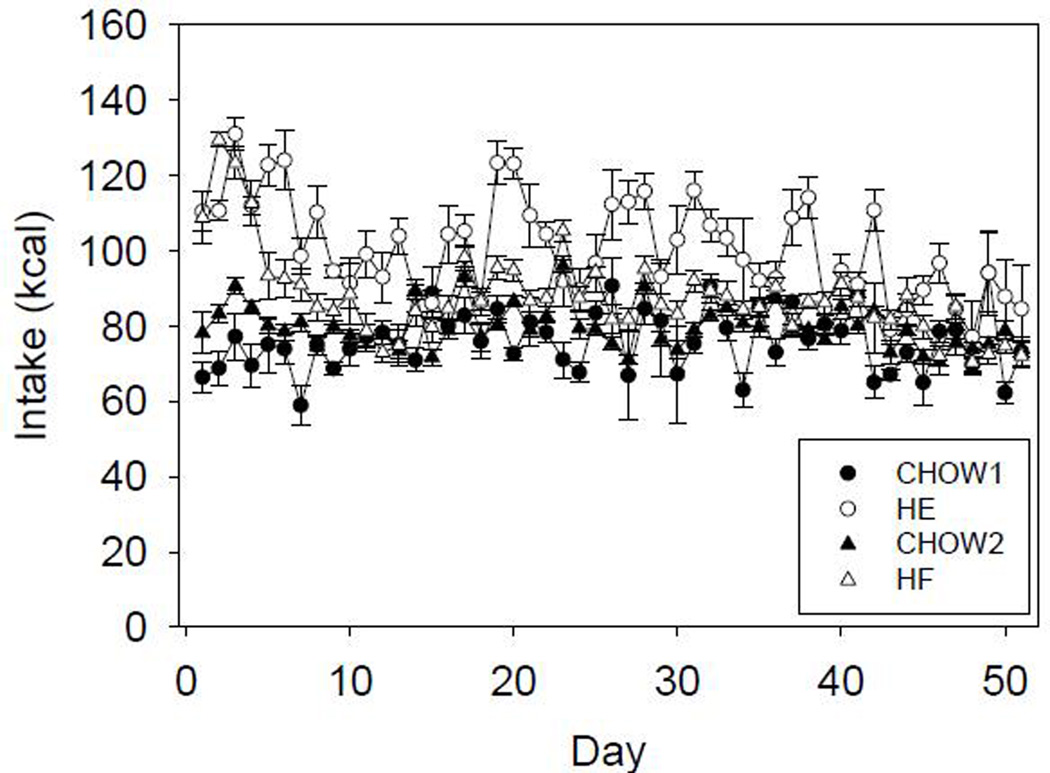
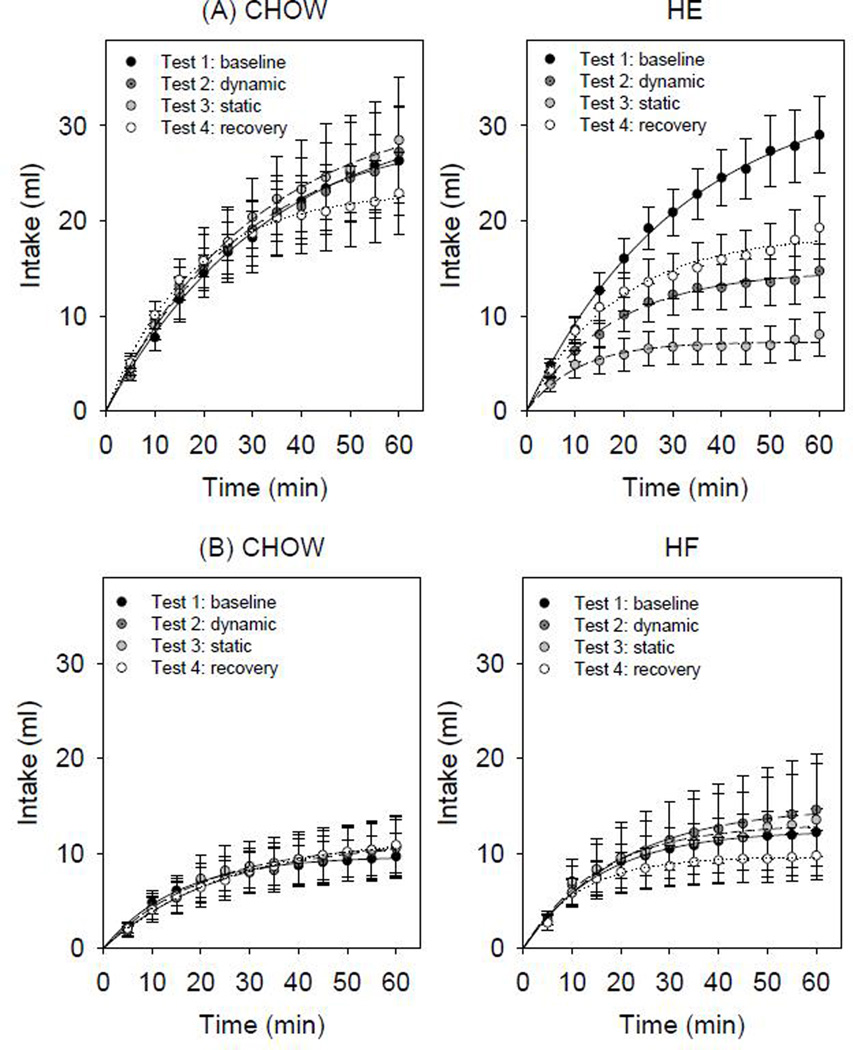
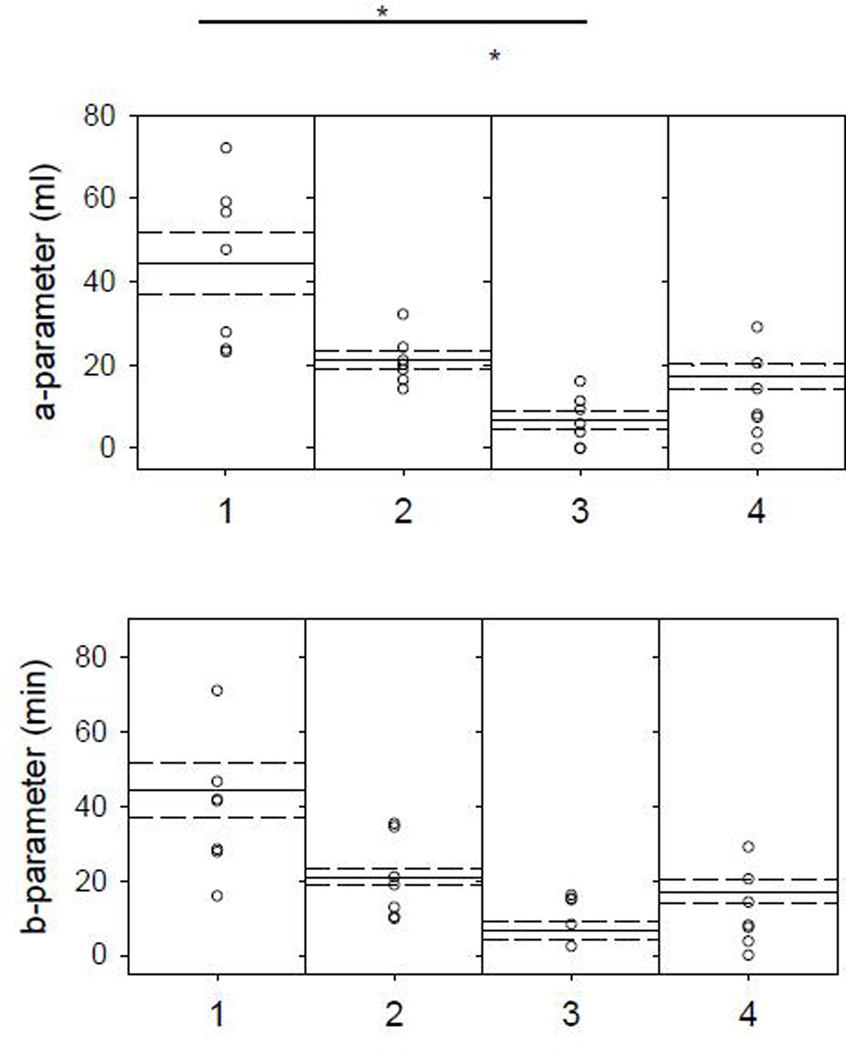
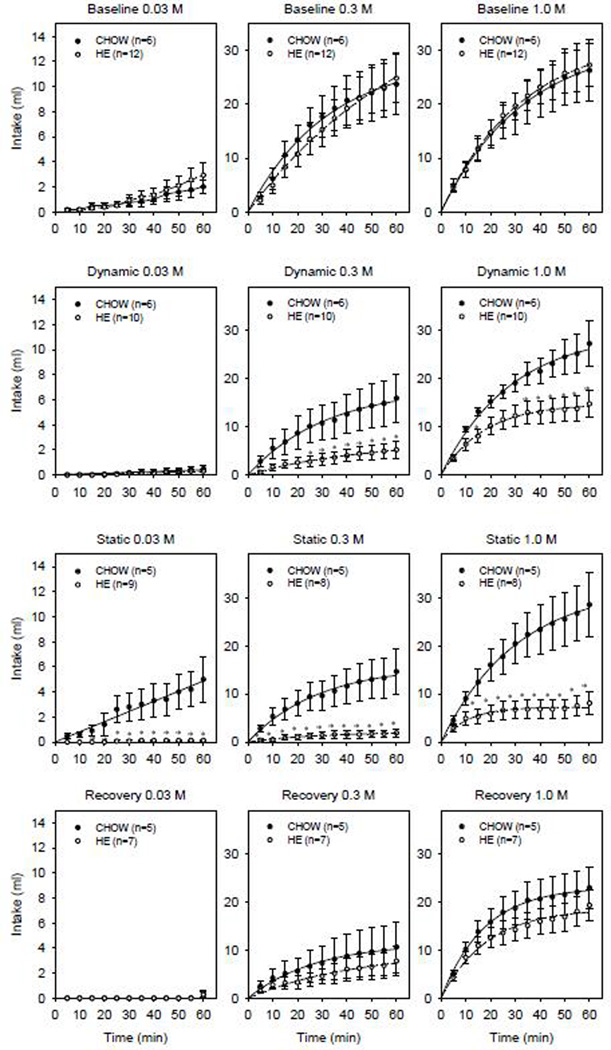
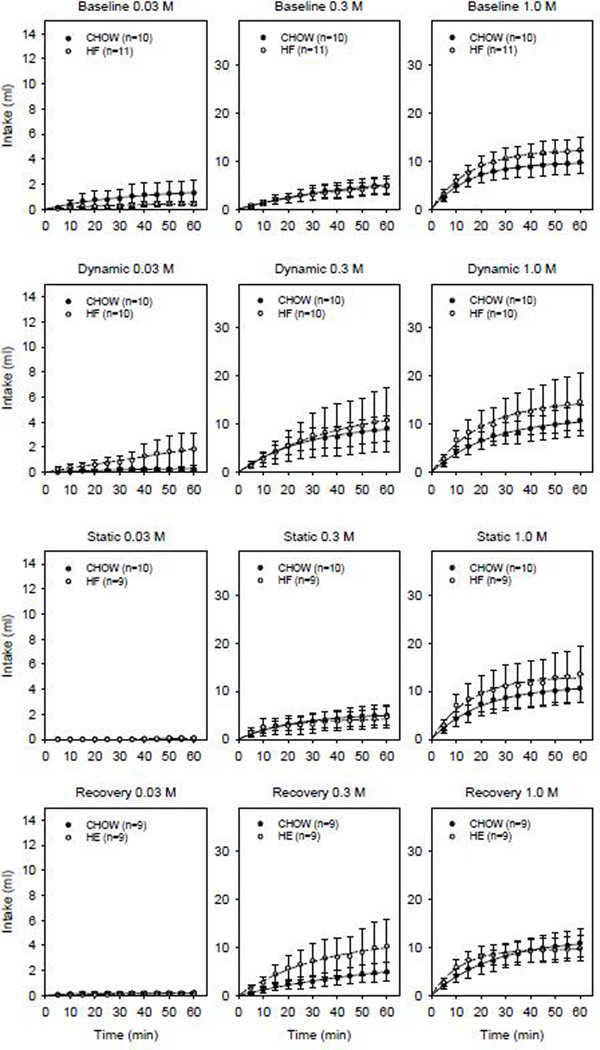
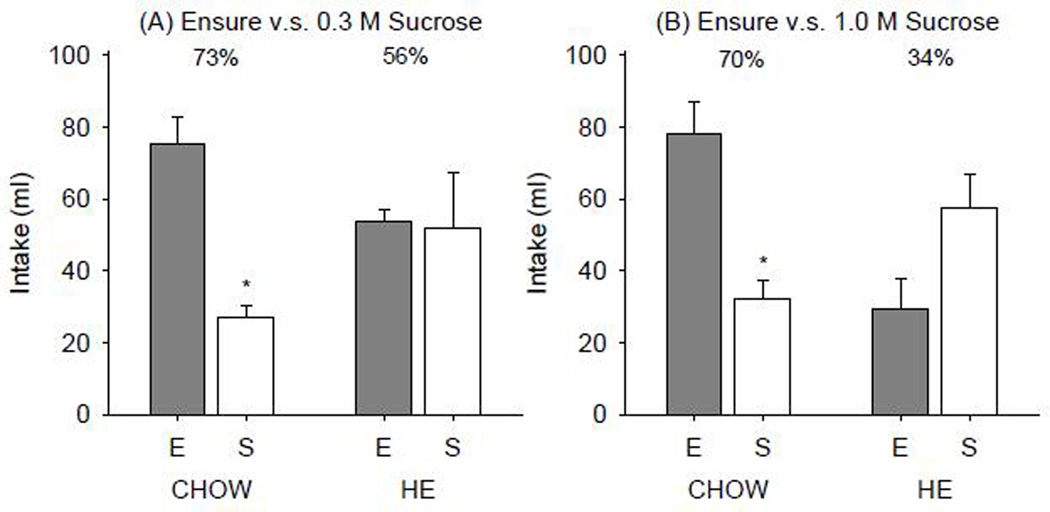
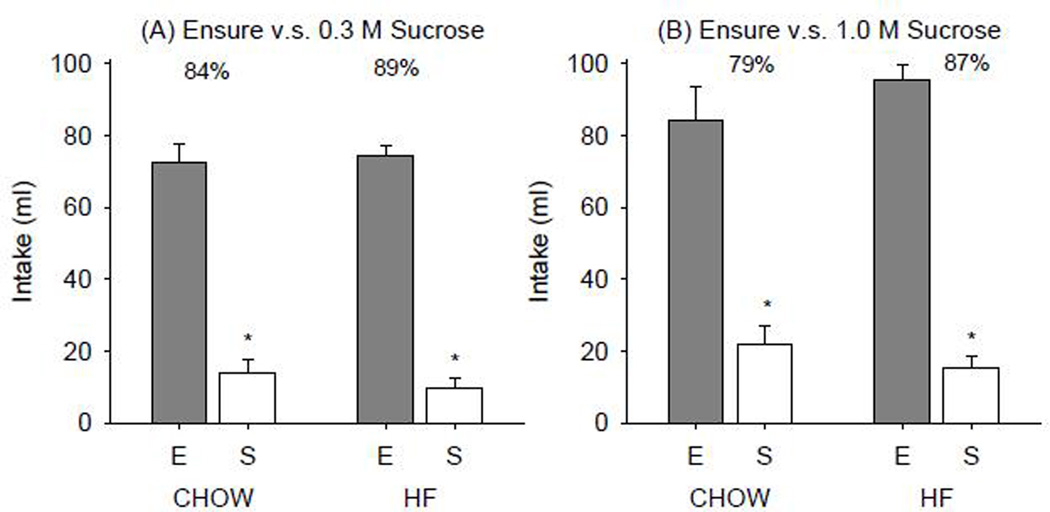
We previously reported that rats increase meal size upon initial presentation of a calorically dense diet. The increase may be attributed to increased orosensory stimulation and/or reduced sensitivity to post-ingestive inhibitory signals. During feeding both types of signals are simultaneously in play; thus here, we compare responses in rats presented a high-energy diet (HE) or 45% high-fat diet (HF) with those of chow-fed controls (CHOW) in a sham-feeding procedure in which post-ingestive feedback is minimized. Measures of sham-feeding to sucrose were taken before diet manipulation (baseline), ~5 days (dynamic phase) and ~6 weeks (static phase) following introduction of the palatable diet, as well as after animals were switched back to standard chow (recovery phase). Some but not all the hypotheses based on our previous findings were confirmed by the outcomes here. Consistent with our hypothesis that enhanced orosensory stimulation during the dynamic phase compared with the static phase would generalize to increased intake of other palatable stimuli, HE rats showed higher sucrose intake during the dynamic phase compared with the static phase. Contrary to what we hypothesized, HE and HF rats did not increase responses to sucrose compared to CHOW rats. In fact, HE rats showed decreased responses compared to CHOW controls. Thus changes in orosensory stimulation do not necessarily generalize to increased intake of other palatable stimuli.
Keywords: High fat; Oral; Palatability; Post-ingestive; Sweet; Taste.
Copyright © 2015 Elsevier Ltd. All rights reserved.
Figures
References
-
- Black RM, Weingarten HP. A comparison of taste reactivity changes induced by ventromedial hypothalamic lesions and stria terminalis transections. Physiol Behav. 1988;44(6):699–708. - PubMed
-
- Brobeck JR. Mechanism of the development of obesity in animals with hypothalamic lesions. Physiol Rev. 1946;26(4):541–559. - PubMed
-
- Chen K, Yan J, Suo Y, Li J, Wang Q, Lv B. Nutritional status alters saccharin intake and sweet receptor mRNA expression in rat taste buds. Brain Res. 2010;1325:53–62. - PubMed
-
- Davis JD, Campbell CS. Peripheral control of meal size in the rat. Effect of sham feeding on meal size and drinking rate. J Comp Physiol Psychol. 1973;83(3):379–387. - PubMed
-
- Davis JD, Smith GP. Learning to sham feed: behavioral adjustments to loss of physiological postingestional stimuli. Am J Physiol Regul Integr Comp Physiol. 1990;259(6 Pt 2):R1228–R1235. - PubMed
Publication types
MeSH terms
Substances
Grants and funding
LinkOut - more resources
Full Text Sources
Other Literature Sources
Medical
Research Materials
Miscellaneous
