

Serial monitoring of circulating tumor DNA in patients with primary breast cancer for detection of occult metastatic disease
- PMID: 25987569
- PMCID: PMC4551342
- DOI: 10.15252/emmm.201404913
Serial monitoring of circulating tumor DNA in patients with primary breast cancer for detection of occult metastatic disease
Abstract
Metastatic breast cancer is usually diagnosed after becoming symptomatic, at which point it is rarely curable. Cell-free circulating tumor DNA (ctDNA) contains tumor-specific chromosomal rearrangements that may be interrogated in blood plasma. We evaluated serial monitoring of ctDNA for earlier detection of metastasis in a retrospective study of 20 patients diagnosed with primary breast cancer and long follow-up. Using an approach combining low-coverage whole-genome sequencing of primary tumors and quantification of tumor-specific rearrangements in plasma by droplet digital PCR, we identify for the first time that ctDNA monitoring is highly accurate for postsurgical discrimination between patients with (93%) and without (100%) eventual clinically detected recurrence. ctDNA-based detection preceded clinical detection of metastasis in 86% of patients with an average lead time of 11 months (range 0-37 months), whereas patients with long-term disease-free survival had undetectable ctDNA postoperatively. ctDNA quantity was predictive of poor survival. These findings establish the rationale for larger validation studies in early breast cancer to evaluate ctDNA as a monitoring tool for early metastasis detection, therapy modification, and to aid in avoidance of overtreatment.
Keywords: breast carcinoma; circulating tumor DNA; early detection; liquid biopsy; metastasis.
© 2015 The Authors. Published under the terms of the CC BY 4.0 license.
Figures
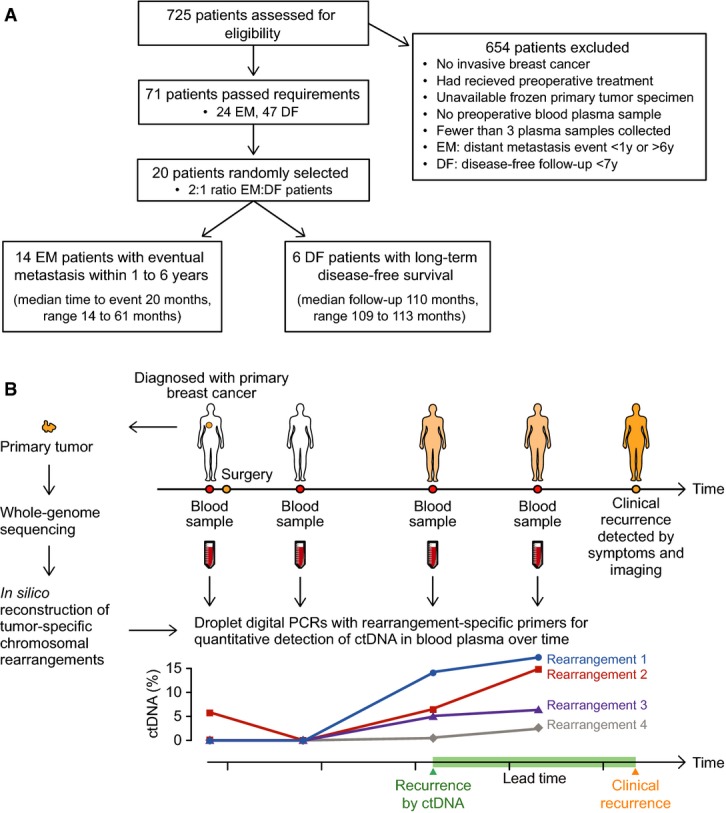
Patient flow diagram indicating patient selection criteria. EM = eventual metastasis; DF = long-term disease-free.
Study schema. For 20 women with primary breast cancer, patient- and tumor-specific chromosomal rearrangements were determined through whole-genome sequencing of 21 tumor tissue specimens (one patient had bilateral tumors). Genomic fusion sequences were bioinformatically reconstructed, and selected rearrangements were validated as somatic. Personalized droplet digital PCR assays were used to quantify rearranged DNA sequences in the cell-free circulating DNA isolated from 93 patient blood plasma samples taken serially during the clinical course. ctDNA results were then compared to clinical endpoints.
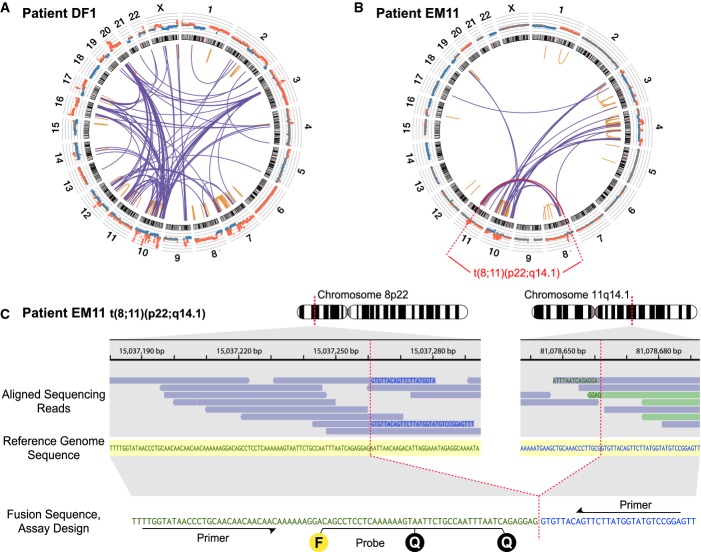
Low-coverage whole-genome sequencing of the primary tumor was used to enumerate chromosomal rearrangements. Shown are results for patient DF1, with inter- and intra-chromosomal rearrangements plotted as a Circos diagram (Krzywinski et al, 2009). Chromosomes 1–22 and X are ordered in the outer circle. From the outside, concentrically, are plotted the DNA copy number estimations from the whole-genome sequencing data and the chromosome ideograms. The orange intra-chromosomal and blue inter-chromosomal arcs in the center indicate chromosomal rearrangements supported by two or more paired-end reads.
Circos diagram for patient EM11. Plots for all patient tumors are shown in Supplementary Fig S1.
One example rearrangement from patient EM11, indicated in red in (B), with identification of the exact fusion sequence between chromosomes 8p22 and 11q14.1. Aligned sequencing reads are highlighted in blue when its read pair aligns concordantly on the same chromosome or in light green if its read pair aligns on another chromosome. Within each sequencing read, nucleotide bases with exact match to the reference sequence (shown in the middle with yellow shading) are not printed. Mismatching bases are shown in blue if matching to 11q14.1 and green if matching to 8p22. At the bottom, the personalized dual-labeled probe and primers designed for this validated rearrangement are illustrated. F denotes the fluorescent molecule and Q the two quenching molecules.
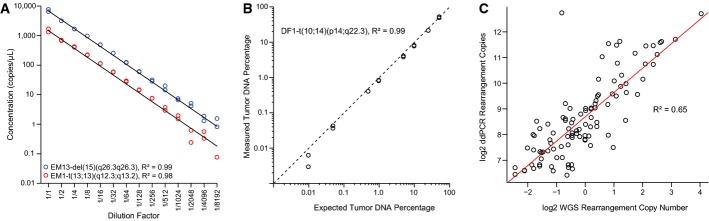
Dilution series for two tumor-specific rearrangements, patient EM13-del(15)(q26.3q26.3) and patient EM1-t(13;13)(q12.3;q13.2), starting with input of 20 ng of the respective patient’s primary tumor DNA in each ddPCR, and diluting twofold in the series as indicated (x-axis). Experiments were performed in duplicate. Linear regression lines are plotted in black, and goodness of fit statistics (R2) were calculated.
Observed percentages by ddPCR of a tumor-specific chromosomal rearrangement, patient DF1-t(10;14)(p14;q22.3), in admixtures of tumor and normal DNA of varying amounts from 50% down to 0.01% tumor DNA content (total DNA input fixed at 200 ng). Concentrations of the tumor-specific rearrangement and the control region in chromosome 2p14 were used in the calculations for amounts of tumor and total DNA, respectively. The black diagonal dashed line indicates the ideal correlation line (y = x). The R2 was calculated for the linear regression line (not plotted). All axes are on log scales.
Correlation between whole-genome sequencing (WGS) rearrangement copy number estimates and the number of copies in 40 ng primary tumor DNA as measured by ddPCR. Axes on log2 scales. The R2 was calculated for the linear regression line (drawn in red).
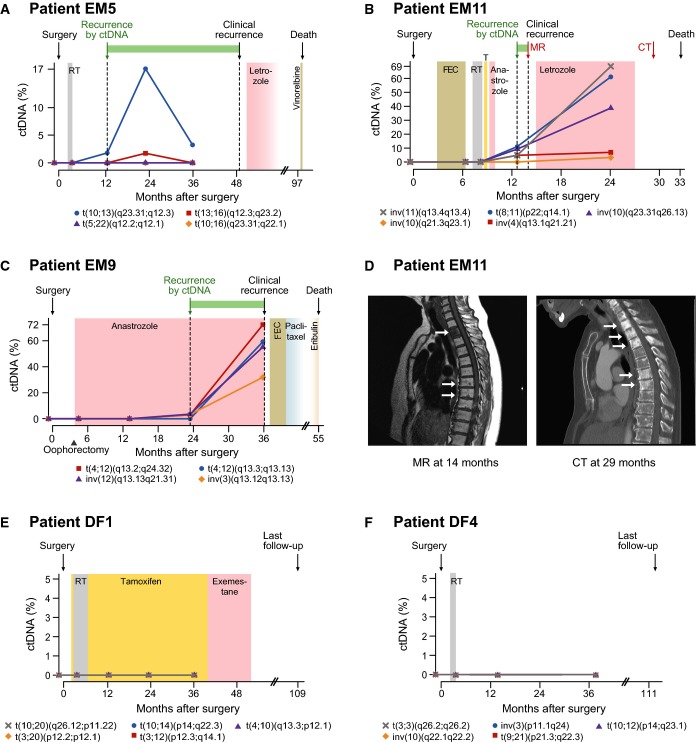
A–C Plasma levels of circulating tumor DNA (ctDNA), quantified using ddPCR, for three patients with known eventual recurrence. Specific rearrangements are indicated by colored markers and labeled according to cytogenetic nomenclature (t denotes translocation, inv is inversion, and del is deletion). The recurrence by ctDNA time-point is defined as the earliest follow-up plasma sample (after surgery) with ctDNA detected at a level greater than 0% (compared to total cell-free circulating DNA) for at least one rearrangement. All relevant clinical events are indicated above by arrows, time gain by ctDNA-based detection is indicated by a green horizontal bar, and radiation (RT), endocrine, and cytotoxic treatments are indicated by colored shading. T = tamoxifen; FEC = fluorouracil, epirubicin, and cyclophosphamide. See Supplementary Fig S2 for ctDNA time-course plots with clinical annotations for all patients.
D Correlative magnetic resonance (MR; T1 weighted) and computed tomography (CT) imaging for patient EM11 corresponding to the red arrows in (B). In the MR, low T1 signal (dark) is present in the entire second thoracic vertebra and as punctate lesions in several vertebrae in the middle thoracic spine. The CT 15 months later shows sclerosis (white) in multiple additional thoracic vertebrae, consistent with progression of metastatic disease.
E, F ctDNA plots for two patients with long-term disease-free survival.
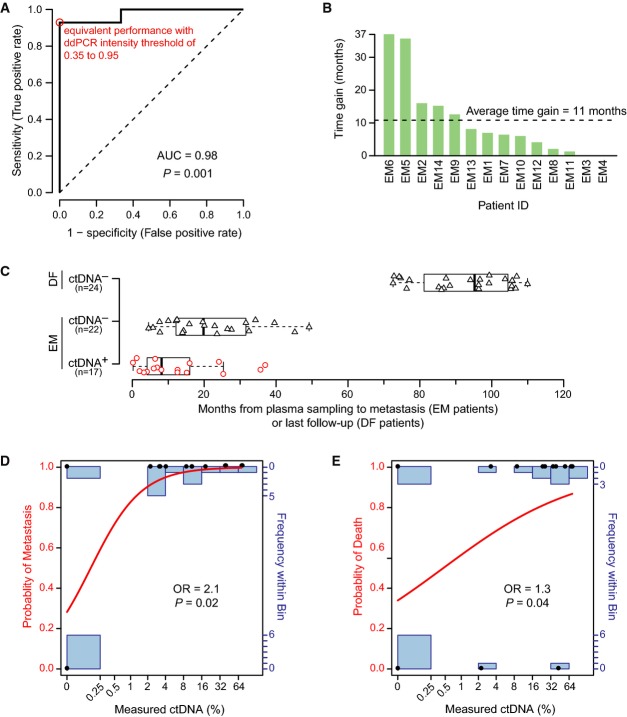
Receiver operating characteristic (ROC) curve analysis. The area under the curve (AUC) as a measure of the postsurgery classification accuracy to discriminate between 6 long-term disease-free (DF) and 14 eventual metastasis (EM) patients based on ctDNA is 0.98 (95% CI 0.75–1.00; P = 0.001, two-sided Mann–Whitney U-test). The sensitivity and specificity were maximal (red circle) at all ddPCR relative fluorescence intensity thresholds between 0.35 and 0.95 (on a normalized scale from 0 to 1). The dashed line indicates a hypothetical test with performance no better than random.
Time gained by ctDNA-based detection of recurrence in advance of clinically detected recurrence for all patients with clinical recurrence. For 12 out of 14 EM patients, ctDNA-based recurrence preceded clinical recurrence (time gain greater than zero).
Boxplots indicating the time from a positive (red circles) or negative ctDNA plasma sample (black triangles) until an event, metastasis or last follow-up, for EM and DF patients. Box indicates the interquartile range (IQR), thick bar indicates the median, and whiskers extend to values within 1.5 times the IQR.
Fitted curve from logistic regression with metastasis as endpoint. Measured ctDNA percentage and actual outcomes are indicated by black dots, the modeled probability is given by the red curve (left axis), and the number of measured data points in each bin is indicated by the blue bar graphs (right axis). Logistic regression odds ratio (OR) of 2.1 (95% CI 1.3 to infinity; P = 0.02, Wald test) is for each doubling of ctDNA.
Fitted curve from logistic regression with death as endpoint. OR of 1.3 (95% CI 1.03-1.9; P = 0.04, Wald test) is for each doubling of ctDNA.
Comment in
-
Circulating tumor DNA in early-stage breast cancer: personalized biomarkers for occult metastatic disease and risk of relapse?EMBO Mol Med. 2015 Aug;7(8):994-5. doi: 10.15252/emmm.201505332. EMBO Mol Med. 2015. PMID: 26034096 Free PMC article.
References
-
- Borgquist S, Hjertberg M, Henningson M, Ingvar C, Rose C, Jernstrom H. Given breast cancer, is fat better than thin? Impact of the estrogen receptor beta gene polymorphisms. Breast Cancer Res Treat. 2013;137:849–862. - PubMed
Publication types
MeSH terms
Substances
Associated data
LinkOut - more resources
Full Text Sources
Other Literature Sources
Medical
