. 2015 May 1:5:16.
doi: 10.1186/s13395-015-0041-y. eCollection 2015.

Muscular dystrophy in the mdx mouse is a severe myopathy compounded by hypotrophy, hypertrophy and hyperplasia

Affiliations

Muscular dystrophy in the mdx mouse is a severe myopathy compounded by hypotrophy, hypertrophy and hyperplasia

William Duddy et al. Skelet Muscle. .

Abstract

Background: Preclinical testing of potential therapies for Duchenne muscular dystrophy (DMD) is conducted predominantly of the mdx mouse. But lack of a detailed quantitative description of the pathology of this animal limits our ability to evaluate the effectiveness of putative therapies or their relevance to DMD.

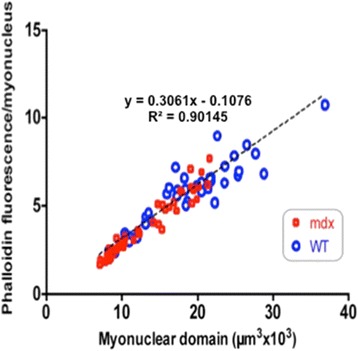
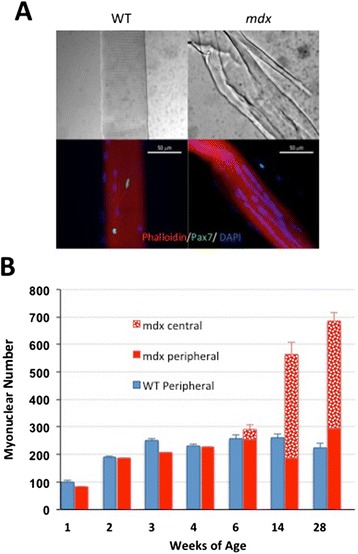
Methods: Accordingly, we have measured the main cellular components of muscle growth and regeneration over the period of postnatal growth and early pathology in mdx and wild-type (WT) mice; phalloidin binding is used as a measure of fibre size, myonuclear counts and BrdU labelling as records of myogenic activity.

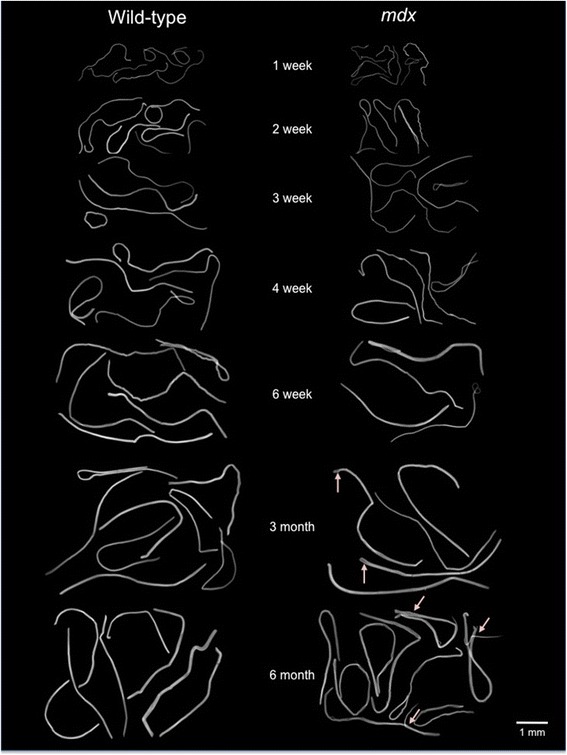
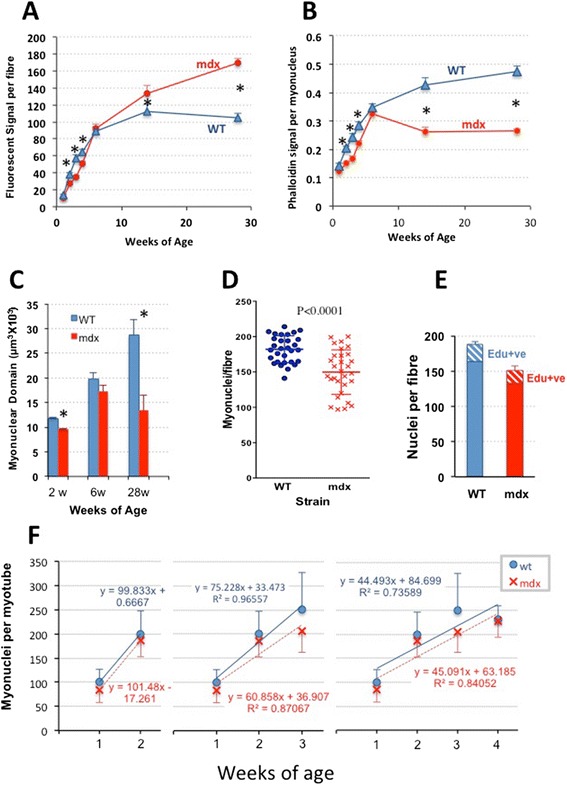
Results: We confirm a two-phase postnatal growth pattern in WT muscle: first, increase in myonuclear number over weeks 1 to 3, then expansion of myonuclear domain. Mdx muscle growth lags behind that of WT prior to overt signs of pathology. Fibres are smaller, with fewer myonuclei and smaller myonuclear domains. Moreover, satellite cells are more readily detached from mdx than WT muscle fibres. At 3 weeks, mdx muscles enter a phase of florid myonecrosis, accompanied by concurrent regeneration of an intensity that results in complete replacement of pre-existing muscle over the succeeding 3 to 4 weeks. Both WT and mdx muscles attain maximum size by 12 to 14 weeks, mdx muscle fibres being up to 50% larger than those of WT as they become increasingly branched. Mdx muscle fibres also become hypernucleated, containing twice as many myonuclei per sarcoplasmic volume, as those of WT, the excess corresponding to the number of centrally placed myonuclei.

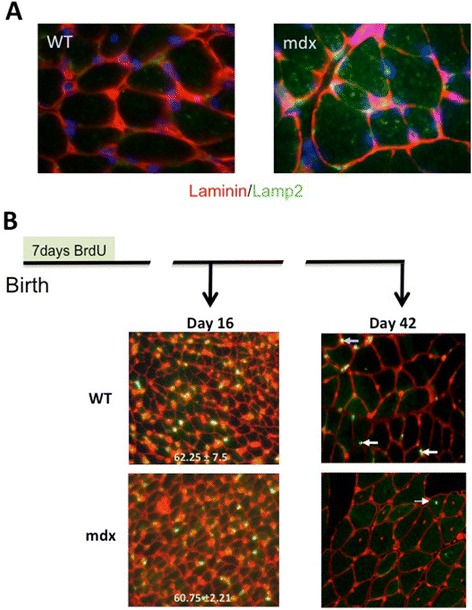
Conclusions: The best-known consequence of lack of dystrophin that is common to DMD and the mdx mouse is the conspicuous necrosis and regeneration of muscle fibres. We present protocols for measuring this in terms both of loss of muscle nuclei previously labelled with BrdU and of the intensity of myonuclear labelling with BrdU administered during the regeneration period. Both measurements can be used to assess the efficacy of putative antinecrotic agents. We also show that lack of dystrophin is associated with a number of previously unsuspected abnormalities of muscle fibre structure and function that do not appear to be directly associated with myonecrosis.

Keywords: Hyperplasia; Hypertrophy; Hypotrophy; Muscle regeneration; Muscular dystrophy.


Figures

Figure 1
Figure 1
Plot of fluorescent phalloidin signal per myonucleus against estimates of fibre volume per myonucleus from stacked confocal images visualized in segments of muscle fibres isolated from mdx and WT muscles at ages of 2, 6 and 28 weeks. The strong linear relationship between the two parameters across the age range and the two mouse strains validates the use of phalloidin fluorescence as a reliable index of fibre volume within these limits.
Figure 2
Figure 2
Individual fibres isolated from muscles of mdx and WT mice aged from 1 to 28 weeks. The visual impression that muscle fibres of mdx mice are thinner than those of age-matched WT controls is borne out by analyses shown in subsequent figures. Branching is evident in the older mdx fibres.
Figure 3
Figure 3
Growth of mdx and WT muscle fibres up to 28 weeks of age, showing the total phalloidin fluorescence per myofibre, as an indicator of fibre volume, plotted against the number of myonuclei in that myofibre, displayed as individual data points and linear best fits across the range of ages as identified by colour. (A) Growth of WT fibres. Myonuclear number, plotted along the X-axis, increases up to week 3 but not thereafter, all further growth being accomplished by increase in fibrous actin content, along the Y-axis, as indicated too by the increasing slope of the best fit lines. (B) The equivalent plot to (A) of mdx muscle fibres using the same scales, to show the marked difference between growth patterns of the two strains. Up to week 4, mdx growth is broadly similar to that of WT but, beyond this point, continues both by a great increase in number of myonuclei per fibre and by increase in F-actin content. The total F-actin per fibre becomes larger than that of WT, in association with fibre branching, but the ratio of fibrous actin per myonucleus is low, as indicated by the shallow slopes of the best fit lines.
Figure 4
Figure 4
Difference between patterns of myogenesis in WT and mdx mice. (A) Fluorescent phalloidin signal per myofibre (mean ± SEM) plotted against age, illustrating the lag in mdx fibre growth in up to 6 weeks but progressive hypertrophy beyond this point (*P < 0.05). (B) The fluorescent phalloidin signal per nucleus (mean ± SEM) also increases rapidly in both mouse strains up to 6 weeks, but with mdx lagging significantly (*P < 0.05) behind WT. The subsequent continuing rise in WT fibres contrasts with the fall to half of the WT values in mdx. (C) Column plot of the estimated myonuclear domains in muscle fibres isolated from muscles of 2-, 6- and 28-week WT and mdx mice (mean ± SEM, *P < 0.05). (D) Scatterplots, together with depiction of mean ± SD, of myonuclear number per myofibre isolated from 18-day-old WT and mdx mouse EDL muscles. (E) EDL fibres from mice labelled with EdU at 14, 15 and 16 days of age and analysed on day 18 showing similar labelling frequencies of fibre-associated nuclei (new-formed myonuclei plus Pax7-positive satellite cells). (F) Nuclear number/fibre (mean ± SD) of fibres isolated from muscles of mdx and WT mice at weeks 1 to 4. The successive incremental plots show a progressive fall in slope from 100 nuclei/fibre between weeks 1 and 2 to a net rise of approximately 45 nuclei per fibre averaged across weeks 1 to 4. Cessation of WT growth is evident beyond week 3. Myonuclei numbers in mdx fibres fall consistently below those of WT fibres, but the plots run largely parallel suggesting that the intensity of myogenesis in the two strains is closely similar and that the mdx fibres had fallen behind WT during prenatal development.
Figure 5
Figure 5
Mdx muscles show excess lysosomal activity prior to disease and massive turnover after onset. (A) Cryostat sections of TA muscles from 2-week-old mdx and WT muscles immunostained for laminin (red) to show fibre outlines and Lamp1 (green) and DAPI (blue) to show the strong representation of lysosomes within mdx fibres as a possible contributory factor to the hypotrophic condition of these fibres. (B) Immunostains for BrdU (green) and laminin (red) counter-stained with propidium iodide (red) of the section of TA muscles from mice injected twice daily with BrdU during the first week of life and euthanased at 16 or 42 days of age. At 16 days, prior to the onset of myonecrosis, muscle from both strains showed similar frequencies of labelled nuclei. N = 4 muscles. Data are shown as mean ± SD. In the WT muscle, the BrdU label had been retained at 42-day muscle, both by identifiable myonuclei (arrowed) and by interstitial cells but had been lost, apart from the occasional rare (1 to 2 per whole section) centrally placed labelled myonucleus in the mdx muscles.
Figure 6
Figure 6
Numbers of Pax7-positive satellite cells and of fibre branches in mdx and WT muscles. (A) Numbers of satellite cells on myofibres extracted from EDL muscles of 1- to 28-week-old WT and mdx mice, shown as Pax7-positive cells per fibre (mean ± SEM). Up to week 4, mdx fibres carried markedly fewer satellite cells than those of WT. Beyond 6 weeks of age, the numbers of satellite cells on mdx fibres increased progressively and significantly exceeded the WT number at 14 and 28 weeks.(B) Pax7-positive cells on fibres extracted from EDL muscles of 1- to 28-week-old WT and mdx mice, normalized to total myofibre nuclei (mean ± SEM). Again, during the first 4 weeks, the percentage of satellite cells on mdx fibres is markedly lower than that on WT fibres but, at 6 weeks and beyond, the numbers are closely similar, suggesting a link between myonuclear density and satellite cell number in mature muscle. (C) Numbers of Pax7-positive cells per myofibre profile in frozen sections of muscle from 2-week-old mdx and WT mice (three individual mice of each strain). In the sectioned muscle, Pax7-positive cells are equally frequent in WT and mdx mice at this age. (D) Frequency of fibres bearing one to four branches in muscles of mdx mice at 6, 14 and 28 weeks of age. No branches were seen on fibres extracted from three batches of mdx mice younger than 6 weeks or from WT mice at any age examined, but the frequency and complexity of branching increased progressively with age of the mdx mouse.
Figure 7
Figure 7
Increase with age in the proportion of ‘central nuclei’ and of fibre branching in mdx mice. (A) Interference contrast and fluorescent micrographs of single fibres isolated from 1-year-old mdx and WT mice and immunostained for Pax7. These not only bear readily identifiable satellite cells (green) but also illustrate the extensive branching of fibres in older mdx but not in WT mice together with the tendency for myonuclei to be arranged in linear ‘central strings’. (B) Counts of myonuclei classified into peripheral location and ‘central’ location, the latter being classified on the basis of their distribution in linear arrays. These ‘central’ myonuclei are first seen in 6-week-old mdx mice. At 14 and 28 weeks, however, it is notable that the numbers of peripherally located myonuclei per fibre are not substantially different from those of the WT and that the centrally located nuclei account for all of the excess myonuclei found in older mdx muscles.
Figure 8
Figure 8
Assessment of myogenic activity in muscles of mdx and WT mice. (A) Protocol for labelling cell participation in muscle regeneration. Mice are given drinking water containing 0.8 mg/ml BrdU for 7 days and maintained on normal drinking water for a further 7 days before being euthanased for analysis. (B) Section from a gastrocnemius muscle taken from a mdx mouse subjected to the regime in (A). Seven days after the end of BrdU administration, it shows extensive labelling of both interstitial cells and centrally located myonuclei in a spontaneous mdx muscle lesion (green or yellow). Virtually all of the centrally placed myonuclei are labelled, showing that the BrdU had not been diluted to subliminal levels by proliferation of the myogenic cells that had repaired this particular lesion. (C) Gastrocnemius of a WT mouse subjected to this same labelling regimen. An occasional interstitial nucleus is stained, but there are no centrally placed myonuclei and no identifiable myonucleus is stained. Thus, the cessation of myonuclear-based growth at 3 weeks, identified in the isolated fibres of the WT EDL muscles, is a generalized phenomenon extending to the gastrocnemius muscle and to other limb muscles examined.

References

    1. Bulfield G, Siller WG, Wight PA, Moore KJ. X chromosome-linked muscular dystrophy (mdx) in the mouse. Proc Natl Acad Sci U S A. 1984;81:1189–92. doi: 10.1073/pnas.81.4.1189. - DOI - PMC - PubMed
    1. Dangain J, Vrbova G. Muscle development in mdx mutant mice. Muscle Nerve. 1984;7:700–4. doi: 10.1002/mus.880070903. - DOI - PubMed
    1. Tanabe Y, Esaki K, Nomura T. Skeletal muscle pathology in X chromosome-linked muscular dystrophy (mdx) mouse. Acta Neuropathol. 1986;69:91–5. doi: 10.1007/BF00687043. - DOI - PubMed
    1. Partridge TA. Animal models of muscular dystrophy – what can they teach us? Neuropathol Appl Neurobiol. 1991;17:353–63. doi: 10.1111/j.1365-2990.1991.tb00735.x. - DOI - PubMed
    1. Harris JB, Slater CR. Animal models of muscular dystrophy. Br Med Bull. 1980;36:193–7. - PubMed

LinkOut - more resources