. 2015 May 19:6:6760.
doi: 10.1038/ncomms7760.

Ferritin levels in the cerebrospinal fluid predict Alzheimer's disease outcomes and are regulated by APOE

Collaborators, Affiliations

Ferritin levels in the cerebrospinal fluid predict Alzheimer's disease outcomes and are regulated by APOE

Scott Ayton et al. Nat Commun. .

Abstract

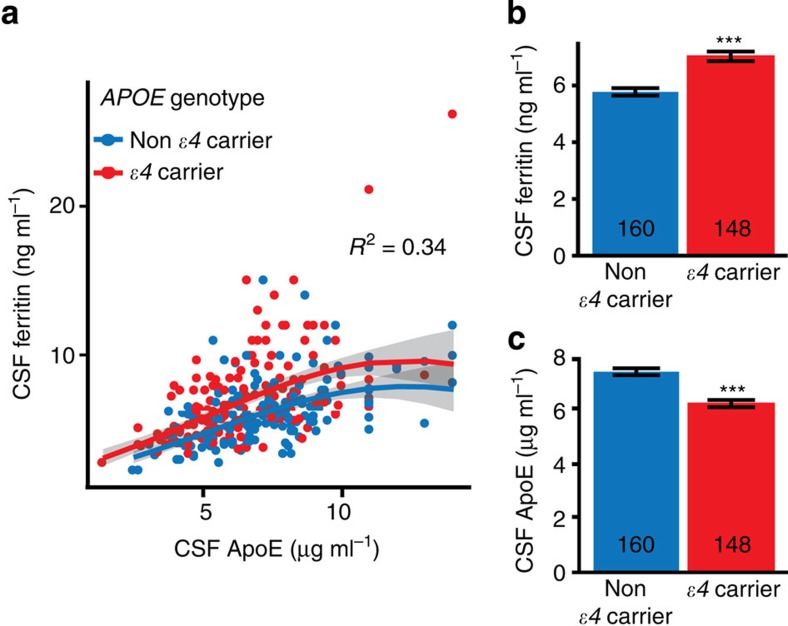
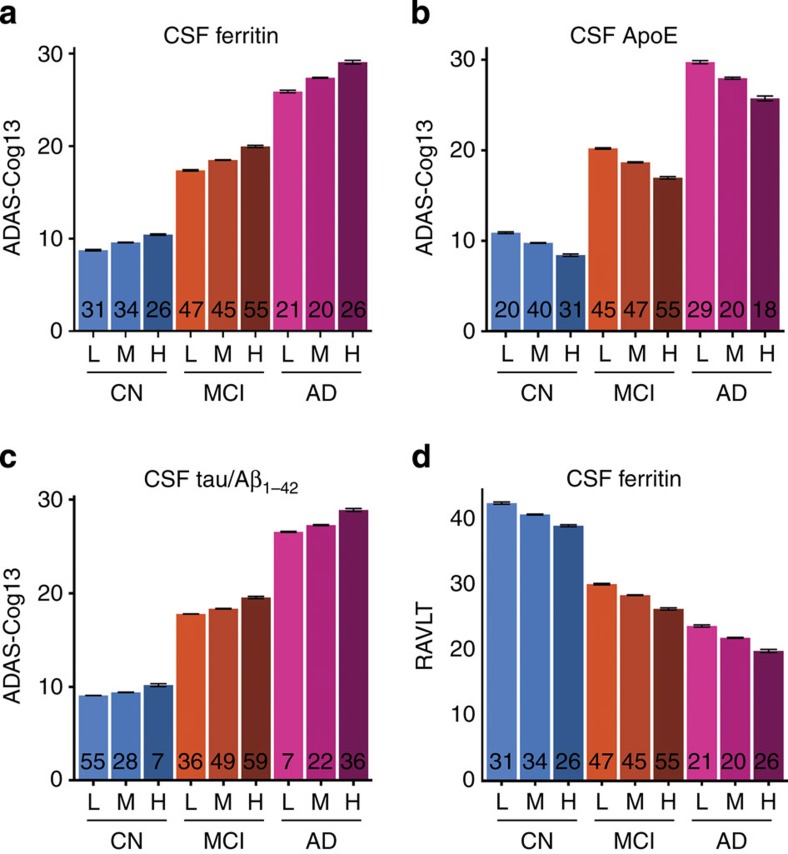
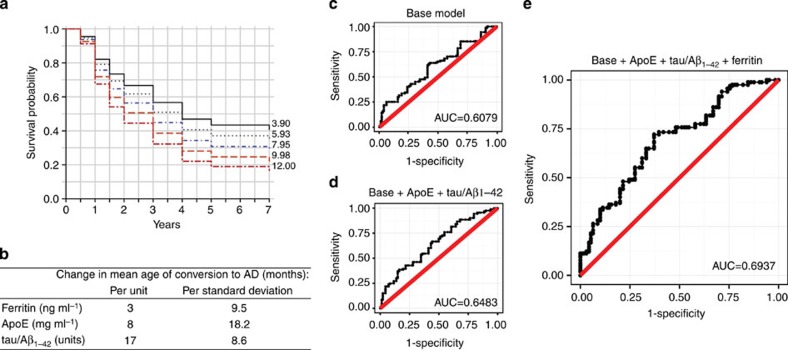
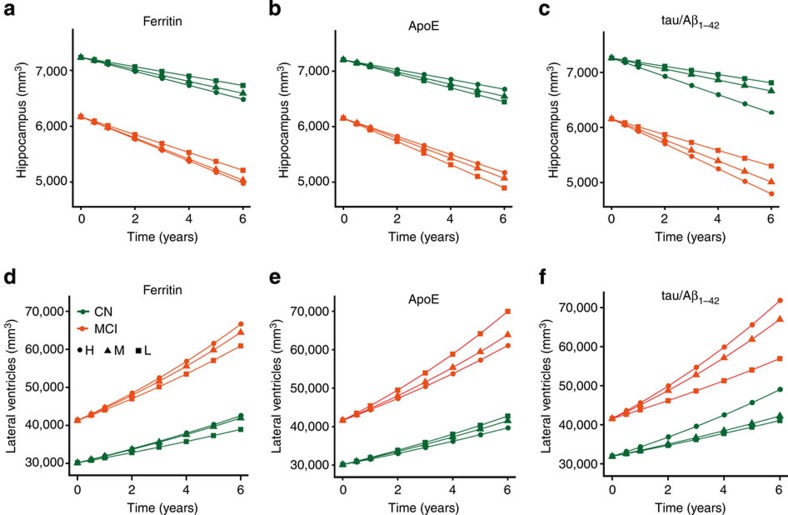
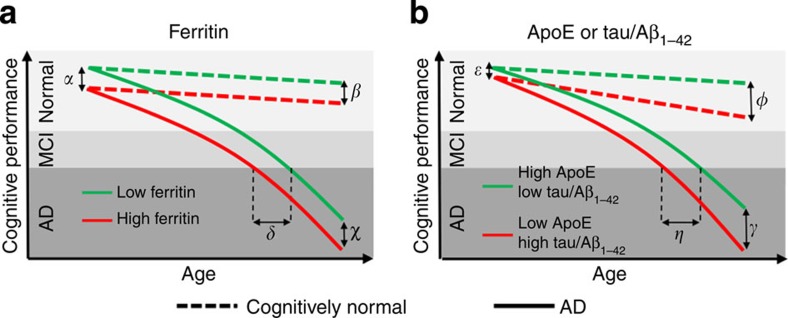
Brain iron elevation is implicated in Alzheimer's disease (AD) pathogenesis, but the impact of iron on disease outcomes has not been previously explored in a longitudinal study. Ferritin is the major iron storage protein of the body; by using cerebrospinal fluid (CSF) levels of ferritin as an index, we explored whether brain iron status impacts longitudinal outcomes in the Alzheimer's Disease Neuroimaging Initiative (ADNI) cohort. We show that baseline CSF ferritin levels were negatively associated with cognitive performance over 7 years in 91 cognitively normal, 144 mild cognitive impairment (MCI) and 67 AD subjects, and predicted MCI conversion to AD. Ferritin was strongly associated with CSF apolipoprotein E levels and was elevated by the Alzheimer's risk allele, APOE-ɛ4. These findings reveal that elevated brain iron adversely impacts on AD progression, and introduce brain iron elevation as a possible mechanism for APOE-ɛ4 being the major genetic risk factor for AD.


Conflict of interest statement

A.I.B. is a shareholder in Prana Biotechnology, Cogstate, Eucalyptus, Mesoblast, Brighton Biotech, LLC, and a payed consultant for Collaborative Medicinal Developments, LLC and Brighton Biotech, LLC. S.A. and N.G.F. declare no competing financial interests.

Figures

Figure 1
Figure 1. CSF ferritin associates with ApoE levels and varies according to APOE genotype.
(a,b) Modelling ferritin in CSF (refer to, M3 of Supplementary Table 1). Minimal multiple regression contained CSF ApoE and APOE ɛ4. (a) Scatterplot of CSF ApoE and ferritin levels in APOE ɛ4 carriers and non-ɛ4 carriers. The genotype did not affect the relationship between ApoE and ferritin; however, genotype is associated with CSF ferritin levels, and thus ɛ4 carriers and non-ɛ4 carriers are plotted separately. The R2 for the linear component of the full model was 0.341 (displayed on graph). (b) CSF Ferritin levels in APOE ɛ4 carriers and non-carriers (ANCOVA: P-value=1.10 × 10⁻⁸). (c) Multiple regression of CSF ApoE. ApoE levels in APOE ɛ4 carriers and non-carriers (ANCOVA: P=2.50 × 10⁻⁹). Data are means+s.e. ‘n' is represented in graph columns.
Figure 2
Figure 2. CSF ferritin levels independently predict cognitive status.
(ac) Multiple regression of baseline ADAS-Cog13 score expressed as tertiles of CSF (a) ferritin (L<5.5; H>7.3 ng ml−1), (b) ApoE (L< 5.8; H>7.8 μg ml−1) and (c) tau/Aβ1–42 (L<0.35; H>0.76). (d) Multiple regression of baseline RAVLT score expressed as CSF ferritin tertiles. Data are adjusted for baseline diagnosis, gender, years of education and the AD CSF biomarkers in the minimal models. Data are means+s.e. ‘n' is shown in graph columns. CN, cognitively normal; MCI, mild cognitive impairment.
Figure 3
Figure 3. Conversion from MCI to dementia as predicted by baseline CSF biomarkers.
(a) MCI survival based on the minimal Cox proportional hazards model (Table 2), the conversion is plotted for each quintile of ferritin (applying mean values for the cohort: ApoE=7.2 μg ml−1, tau/Aβ1–42=0.69 units). The numbers on the right side of the graphs indicate the quintile boundaries. This minimal model contained only the CSF biomarkers. (b) Change in mean age of diagnosis according to CSF biomarkers. The months taken for ∼50% survival of each quintile boundary in the Cox models were graphed against the unit values of those boundaries. The gradient of the linear model was used to estimate change in age of conversion for each unit change in analyte. (refer to Fig. 3a, Supplementary Fig. 4). (ce) Receiver operating curves of logistic regression modelling of MCI conversion to AD (refer to Table 2, Supplementary Fig. 5). (c) Base model controlling for age, gender, BMI, years of education and APOE ɛ4 status. (d) Base model plus ApoE and tau/Aβ1-42. (e) Base model plus ApoE, tau/Aβ1–42 and ferritin. AUC, area under curve.
Figure 4
Figure 4. CSF ferritin levels independently predict brain structural changes.
(ac) Longitudinal hippocampal changes based on tertiles of CSF (a) ferritin (L<5.5; H>7.3 ng ml−1) (b) ApoE (L< 5.8; H>7.8 μg ml−1) and (c) tau/Aβ1–42 (L<0.35; H>0.76) tertiles (refer to Table 2). (df) Longitudinal lateral ventricular changes based on CSF (d) ferritin (e) ApoE and (f) tau/Aβ1–42 tertiles (refer to Table 2). These mixed effects models were adjusted for age, gender, baseline diagnosis, years of education, APOE ɛ4 status and intracranial volume. Tertiles at baseline were not significantly different for all models, therefore for visual display the baseline values were held at the adjusted means for each diagnostic group. CN, cognitively normal; H, highest tertile; M, middle tertile; MCI, mild cognitive impairment; L, lowest tertile.
Figure 5
Figure 5. Schematic: the impact of ferritin and other biomarkers on AD presentation.
(a) CSF ferritin has a qualitatively different impact to (b) CSF tau/Aβ1–42 and ApoE on cognitive performance over time in cognitively normal (dotted lines) and in subjects who develop AD (solid lines). Higher CSF ferritin levels are associated with poorer baseline cognitive status (for example, RAVLT) by [α] points, where [α]=Ln[ferritin (ng ml−1)]*1·77 (refer to Table 2). This effect is constant over time, such that [α]=[β,χ]. Consequently, ferritin causes a shift to the left in age of conversion to AD by [δ] months, where [δ]=ferritin (ng ml−1)*3 (refer to Fig. 3b). Levels of tau/Aβ1–42 or ApoE are associated with both baseline cognitive status [ɛ] and the rate of cognitive deterioration, such that [ɛ]<[φ,γ]. The effect causes a shift in age of diagnosis by [η] months where [η]=ApoE (μg ml−1)*8 or tau/Aβ1–42 (units)*17 (refer to Fig. 3b).

Comment in

Similar articles

Cited by

References

    1. van Rooden S. et al.. 7T T2-weighted magnetic resonance imaging reveals cortical phase differences between early- and late-onset Alzheimer's disease. Neurobiol. Aging 36, 20–26 (2014). - PubMed
    1. Smith M. A., Harris P. L., Sayre L. M. & Perry G. Iron accumulation in Alzheimer disease is a source of redox-generated free radicals. Proc. Natl Acad. Sci. USA 94, 9866–9868 (1997). - PMC - PubMed
    1. Crapper McLachlan D. R. et al.. Intramuscular desferrioxamine in patients with Alzheimer's disease. Lancet 337, 1304–1308 (1991). - PubMed
    1. Lei P. et al.. Tau deficiency induces parkinsonism with dementia by impairing APP-mediated iron export. Nat. Med. 18, 291–295 (2012). - PubMed
    1. Jellinger K., Paulus W., Grundke-Iqbal I., Riederer P. & Youdim M. B. Brain iron and ferritin in Parkinson's and Alzheimer's diseases. J. Neural Transm. Park. Dis. Dement. Sect. 2, 327–340 (1990). - PubMed

Publication types

MeSH terms