. 2015 May 19:6:6989.
doi: 10.1038/ncomms7989.

Targeted DNA degradation using a CRISPR device stably carried in the host genome

Affiliations

Targeted DNA degradation using a CRISPR device stably carried in the host genome

Brian J Caliando et al. Nat Commun. .

Abstract

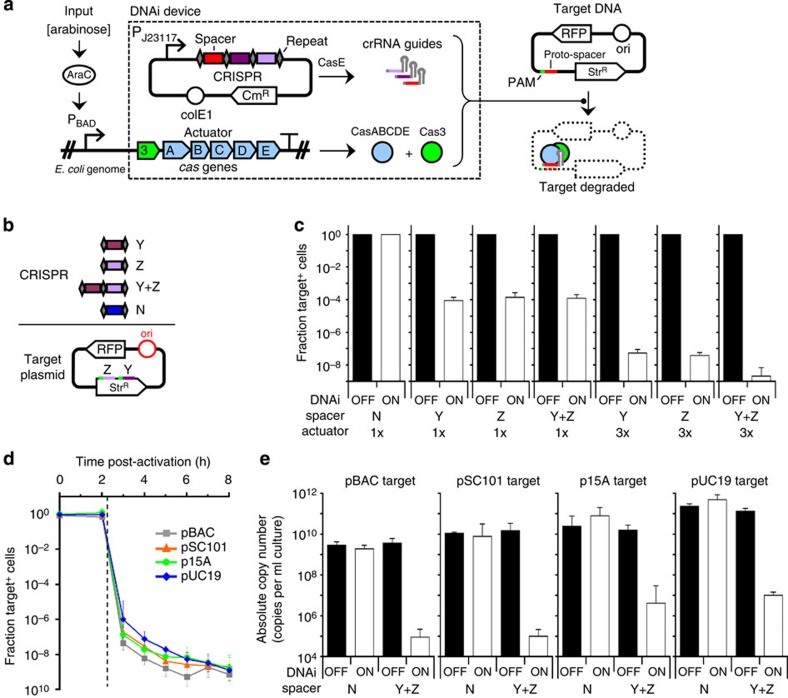
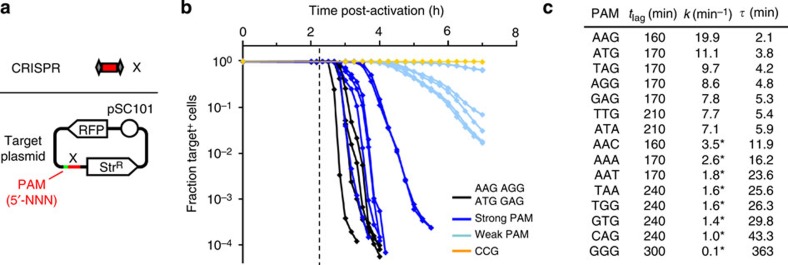
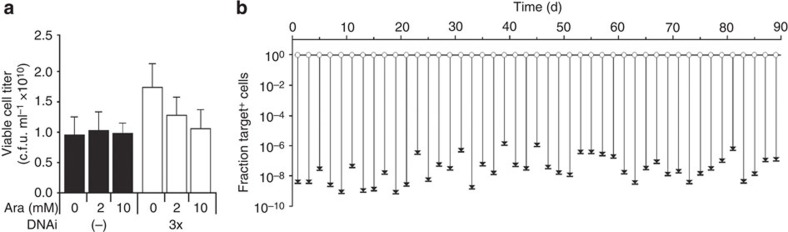
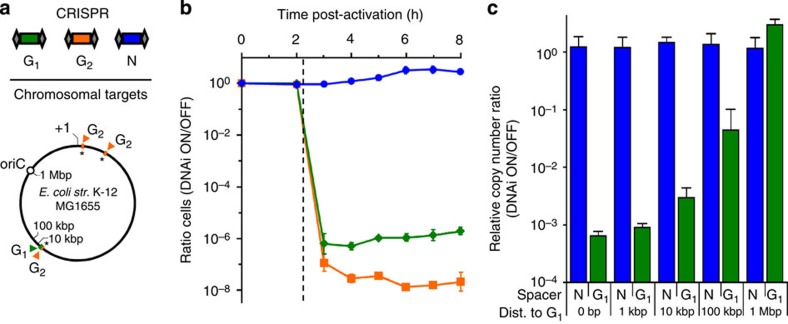
Once an engineered organism completes its task, it is useful to degrade the associated DNA to reduce environmental release and protect intellectual property. Here we present a genetically encoded device (DNAi) that responds to a transcriptional input and degrades user-defined DNA. This enables engineered regions to be obscured when the cell enters a new environment. DNAi is based on type-IE CRISPR biochemistry and a synthetic CRISPR array defines the DNA target(s). When the input is on, plasmid DNA is degraded 10(8)-fold. When the genome is targeted, this causes cell death, reducing viable cells by a factor of 10(8). Further, the CRISPR nuclease can direct degradation to specific genomic regions (for example, engineered or inserted DNA), which could be used to complicate recovery and sequencing efforts. DNAi can be stably carried in an engineered organism, with no impact on cell growth, plasmid stability or DNAi inducibility even after passaging for >2 months.


Figures

Figure 1
Figure 1. Characterization of the DNAi device.
(a) A schematic of the device (dashed box) is shown. The CRISPR array is transcribed from a constitutive promoter (PJ23117). (b) The Y and Z spacers are designed to be internal to the StrR gene carried on the targeted plasmid. The N spacer is a control whose sequence is not present in the targeted plasmid or genome. The spacer sequences and the PAMs associated with their corresponding proto-spacers are presented in Supplementary Table 1. (c) Data for the knockout of target plasmids are shown for different spacers and numbers of actuators carried in the genome (1x and 3x). The fraction of cells that retain the pSC101 origin pTAR(S) target plasmid (Target+) is shown in the OFF (repressed by 0.5% glucose) and ON (2 mM arabinose) states. The OFF data and the 1x/N ON data were obtained using the cytometry assay and the remainder were obtained by the plate-based assay (Methods). (d) A time course is shown for the knockout of target plasmids containing different origins of replication. The inducer (2 mM arabinose) is added at t=0 h and aliquots of each sample are removed over time and analysed using the plating assay to determine the fraction retaining the target plasmid (Methods). The vertical dashed line indicates t=2.25 h, the time at which the PBAD promoter activates to initiate the synthesis of DNAi actuator components (Supplementary Fig. 5a). All of the data were gathered using the 3x DNAi device and the Y+Z dual spacers. When the target contains the pUC19 origin, the plasmid containing the targeting array was changed to a compatible RSF origin (pCR-YZ* and pCR-N*). (e) The recovery of target plasmid DNA sequences via PCR after the 8-h induction of DNAi as performed in d is quantified via qPCR and is given in terms of absolute copy number per millilitre of culture (ACNculture; Methods). All data represent the average of three independent experiments performed on different days and the error bars are the s.d.
Figure 2
Figure 2. Effect of PAM sequence on DNAi device kinetics.
(a) The X spacer is designed to be present in a non-coding region of the pPAM-NNN-RFP target plasmid series (pSC101 origin, StrR), where NNN corresponds to a different X-associated 3-bp PAM sequence of the form 5′-NNN-[Spacer X]. The X spacer sequence is presented in Supplementary Table 1. (b) The dynamics of plasmid loss are shown for each of the active PAM sequences. Data are for the 1x DNAi device, X spacer targeting plasmid, and a pSC101 target (RFP+, StrR) and reflect the fraction of cells in the ON state (2 mM arabinose) that retain the target plasmid (Target+) as determined by PAM kinetic assay (Methods). Black lines (AAG, AGG, ATG and GAG) correspond to the canonical PAM set identified by Westra et al. The vertical dashed line indicates t=2.25 h, the time at which the PBAD promoter activates to initiate the synthesis of DNAi actuator components (Supplementary Fig. 5a). Details regarding the classification of strong versus weak PAMs are outlined in Supplementary Figs 7 and 8, and all canonical PAMs are classifiably strong PAMs. Target plasmid decay curves are truncated at the point in time where the fraction of Target+ cells reaches its minimum value. Error bars have been omitted for clarity but are shown in Supplementary Fig. 9. (c) Summary of kinetic parameters for plasmid loss experiments depicted in b. The length of the lag phase (tlag, in min) is defined as the time required for target retention to drop below 95%. The linear region(s) of log-scale decay curves from b were fit to the equation y=A × exp(−kt), where t is time (in min), y is the fraction retaining the plasmid and A is a constant. For curves that contain a kink, k was calculated for the first segment (identified by a ‘*'). The decay half-life (τ, in min) is calculated as 60*ln(2)/k. All data reflect the average of three independent experiments performed on different days.
Figure 3
Figure 3. Growth impact and genetic stability of strains carrying the DNAi device.
(a) The cell density is shown as a function of inducer (0, 2 and 10 mM Ara) for cells containing either the 3x DNAi device or no actuator, along with the Y+Z dual CRISPR targeting array (pCR-YZ, CmR) and a target plasmid (pTAR(S), RFP+, StrR). Measurements of viable cell titres in c.f.u. per ml were made by plating serial dilutions of cultures onto solid media without selection for the target plasmid (Methods). The data represent the average of three independent experiments performed on different days and the error bars are the standard deviation. (b) The activity of the DNAi device was characterized periodically for 3 months. A strain containing the 3x DNAi device and the Y+Z dual spacer (pCR-YZ) and pSC101 target plasmid (pTAR(S)) was passaged every 12 h under conditions where the device is OFF (0.5% glucose; Methods). Every 2 days, aliquots were taken and analysed via the cytometry assay to determine the fraction of cells containing the target plasmid (Target+, white circles). These samples were then induced with 2 mM arabinose for 8 h and the fraction of the target plasmid was determined via plating assay (Methods; black dashes).
Figure 4
Figure 4. Degradation of specific genomic regions via DNAi and the induction of cell death.
(a) Two on-target spacers (G1 and G2) are shown along with the locations of their corresponding sequences in the E. coli K-12 host chromosome. The G2 spacer targets a site within the chromosomally inserted actuator sequences (starred) and so those proto-spacer locations coincide with the three actuator locations. An off-target spacer (N) is used as a control as it does not target a sequence in the genome. The spacing from the G1 target for the qPCR assays is shown. (b) The kinetics of cell killing is shown, where the efficiency is presented as a ratio of the titre of viable cells between the DNAi ON (+2 mM arabinose) and OFF (+0.5% glucose) states. The data are shown for the 3x actuator and the G1 (pCR-G1) or G2 (pCR-G2) targets (green diamonds and orange squares, respectively). The N control (pCR-N) is shown as blue circles. The vertical dashed line indicates t=2.25 h, the time at which the PBAD promoter activates to initiate the synthesis of DNAi actuator components (Supplementary Fig. 5a). The corresponding viable cell titre measurements are shown in Supplementary Fig. 12. (c) The ability to recover chromosomal DNA sequences via PCR after the induction of DNAi for 8 h is quantified as a function of distance (dist.) from the single chromosomal proto-spacer target. For each chromosomal locus, the efficiency of recovery is measured as the ratio of the relative copy number (RCN) of the DNAi ON state divided by that of the corresponding DNAi OFF state (Methods). Chromosomal distances are measured as the centre-to-centre spacing between the PCR amplicon indicated and the singly occurring G1 chromosomal protospacer (NCBI NC_000913.3 position 2,887,466). Sequences for primer pairs are provided in Supplementary Table 5. All data represent the average of three independent experiments performed on different days and error bars indicate the s.d.

References

    1. Arkin A. Setting the standard in synthetic biology. Nat. Biotechnol. 26, 771–774 (2008). - PubMed
    1. Molin S. et al.. Suicidal genetic elements and their use in biological containment of bacteria. Annu. Rev. Microbiol. 47, 139–166 (1993). - PubMed
    1. Isaacs F. J. et al.. Engineered riboregulators enable post-transcriptional control of gene expression. Nat. Biotechnol. 22, 841–847 (2004). - PubMed
    1. Callura J. M., Dwyer D. J., Isaacs F. J., Cantor C. R. & Collins J. J. Tracking, tuning, and terminating microbial physiology using synthetic riboregulators. Proc. Natl Acad. Sci. USA 107, 15898–15903 (2010). - PMC - PubMed
    1. Curtiss R. et al.. Salmonella enterica serovar typhimurium strains with regulated delayed attenuation in vivo. Infect. Immun. 77, 1071–1082 (2009). - PMC - PubMed

Publication types