Review
. 2015 Jun;120(6):1337-51.
doi: 10.1213/ANE.0000000000000705.

Outcomes for extremely premature infants

Affiliations
Review

Outcomes for extremely premature infants

Hannah C Glass et al. Anesth Analg. 2015 Jun.

Abstract

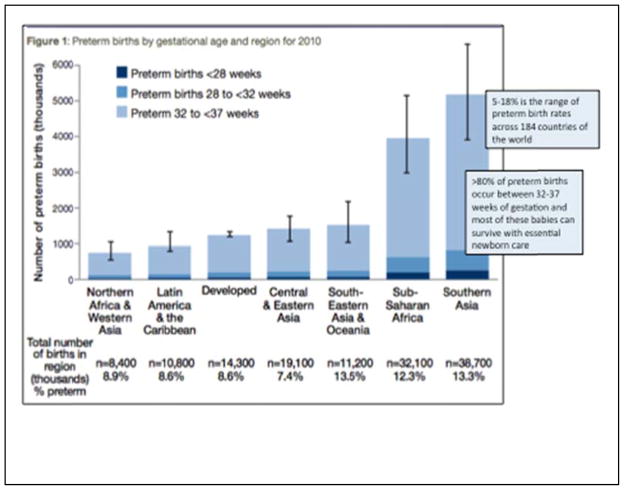
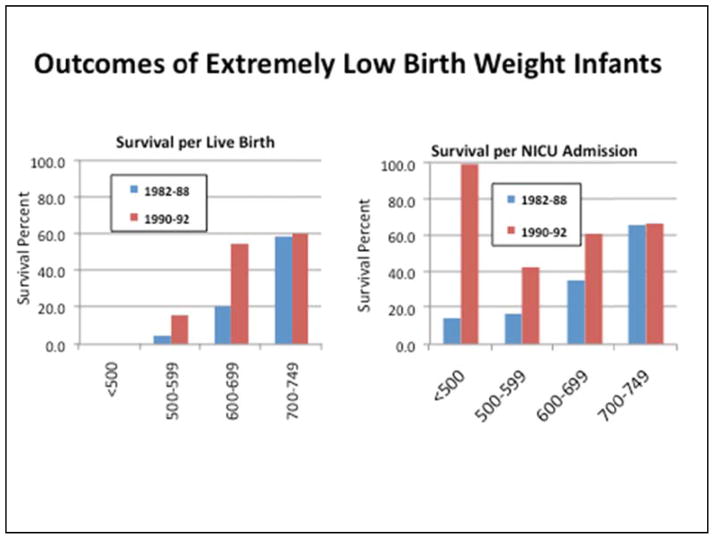
Premature birth is a significant cause of infant and child morbidity and mortality. In the United States, the premature birth rate, which had steadily increased during the 1990s and early 2000s, has decreased annually for 7 years and is now approximately 11.39%. Human viability, defined as gestational age at which the chance of survival is 50%, is currently approximately 23 to 24 weeks in developed countries. Infant girls, on average, have better outcomes than infant boys. A relatively uncomplicated course in the intensive care nursery for an extremely premature infant results in a discharge date close to the prenatal estimated date of confinement. Despite technological advances and efforts of child health experts during the last generation, the extremely premature infant (less than 28 weeks gestation) and extremely low birth weight infant (<1000 g) remain at high risk for death and disability with 30% to 50% mortality and, in survivors, at least 20% to 50% risk of morbidity. The introduction of continuous positive airway pressure, mechanical ventilation, and exogenous surfactant increased survival and spurred the development of neonatal intensive care in the 1970s through the early 1990s. Routine administration of antenatal steroids during premature labor improved neonatal mortality and morbidity in the late 1990s. The recognition that chronic postnatal administration of steroids to infants should be avoided may have improved outcomes in the early 2000s. Evidence from recent trials attempting to define the appropriate target for oxygen saturation in preterm infants suggests arterial oxygen saturation between 91% and 95% (compared with 85%-89%) avoids excess mortality; however, final analyses of data from these trials have not been published, so definitive recommendations are still pending. The development of neonatal neurocritical intensive care units may improve neurocognitive outcomes in this high-risk group. Long-term follow-up to detect and address developmental, learning, behavioral, and social problems is critical for children born at these early gestational ages.The striking similarities in response to extreme prematurity in the lung and brain imply that agents and techniques that benefit one organ are likely to also benefit the other. Finally, because therapy and supportive care continue to change, the outcomes of extremely low birth weight infants are ever evolving. Efforts to minimize injury, preserve growth, and identify interventions focused on antioxidant and anti-inflammatory pathways are now being evaluated. Thus, treating and preventing long-term deficits must be developed in the context of a "moving target."


Conflict of interest statement

See Disclosures at end of article for Author Conflicts of Interest.

Figures

Figure 1
Figure 1
Modified with permission from World Health Organization: Born too soon: the global action report on preterm birth. WHO Press, Geneva, Switzerland 2012 (2).
Figure 2
Figure 2
Figure drawn using data from Centers for Disease Control and Prevention (4).
Figure 3
Figure 3
Extremely Low Birth Weight Infant Outcomes of the National Institute of Child Health and Human Development (NICHD) Neonatal Network. Eight centers participated in the NICHD Neonatal Network, 1,765 infants born in the middle to late 1980s. Survival significantly improved with each week of increase in gestational age and with each 100-gram increment increase in birth weight (data not shown). Figure drawn from data presented in Hack et al. Pediatrics. 1991; 87:587 (20).
Figure 4
Figure 4
The figure shows how survival statistics may be distorted depending on the reference denominator used in evaluating mortality risk. Older cohort observations often included only patients admitted to intensive care. These studies did not account for infants who succumbed in the delivery room or on the way to intensive care. In the figure in the right hand panel, survival is referenced to live births (population-based cohort), demonstrating very poor outcome in the less than 500–600 gram subgroup. When survival is referenced to pediatric intensive care unit (ICU) admissions as it is on the left sided panel, outcomes seem much better. Clinicians involved in the surgical and intensive care management of these patients often have this distorted view of survival because he or she sees only the children admitted for care. Figure 6 also displays the significant improvement in survival that occurred with the widespread availability and use of exogenous surfactant. Figure drawn from data presented in Hack et al. Pediatrics. 1996;98: 931–937 (21).
Figure 5
Figure 5
Extremely Low Birth Weight Infant Survival. Outcomes of observation studies were pooled, then referenced to the Table 2 epochs to allow visual evaluation the association of changes in survival over time with the innovations. The regression lines for each gestational age 23 through 26 weeks suggest that survival has improved over time. Using the 50% survival rate standard (black dashed line), the figure suggests that viability has improved from approximately 25–26 weeks in the 1990s to between 23–24 weeks by the mid-2000s. Graphic drawn from data in references (20–43).
Figure 6
Figure 6
The percentage of extremely premature infants who are spared from various morbidities. The figure represents the cumulative short-term outcome scale at the time of discharge for admitted infants with a gestational age (GA) of 24 to 26 weeks. At the time of hospital discharge, approximately 50% of infants born at 25 weeks GA leave the hospital without any major neurologic disability versus only 20% of infants born at 24 weeks. Figure modified with permission from Vanhaesebrouck P et al. Pediatrics 2004;114:663–675 (34).
Figure 7
Figure 7
Normal Development of the Lung. The five stages of normal development of the lung; weeks 0 to 6 of gestation comprise the embryonic period, weeks 6 to 16 the pseudoglandular period, weeks 16 to 24 the canalicular period, and weeks 24 to term (40 weeks) the saccular period. Pulmonary circulation develops in parallel with lung development (115).
Figure 8
Figure 8
Vascular endothelial growth factor (VEGF) signaling in the pathogenesis of neonatal pulmonary vascular disease. Blood vessels in the lung actively promote alveolar growth during development. VEGF contributes to normal lung development and early disruption leads to structural abnormalities. Lung angiogenesis promotes lung development (51).
Figure 9
Figure 9
Tracking of Forced expiratory volume in 1 s (FEV1) in normal and extremely low birth weight infants (with and without bronchopulmonary dysplasia [BPD]) into early adulthood. FEV1 in preterm-born subjects, including subjects with BPD and without BPD, compared to subjects born at term (62).
Figure 10
Figure 10
Normal Brain Growth. Brain weight from 20 to 40 (term) gestational weeks is expressed as a percent of term brain weight. For example, at 34 gestational weeks, the overall brain weight is 65% of term weight (70).
Figure 11
Figure 11
Normal Cerebellar Growth. Note that cerebellar volume as a function of gestational age reveals the dramatic increase between 24 to 40 weeks’ gestation (71).
Figure 12
Figure 12
Bayley Developmental Index. The Bayley score is a developmental test based on a play behavioral examination. The raw score is converted to a scale, which in turn can be referenced to normalized values. The pink shaded area represents the normal range (between 84–115). Scores below the red dashed line, at 70, indicate severe developmental disability, while scores above the green line indicate superior performance. When Bayley scores are used to quantify developmental outcomes, the point estimate, or effect size, is represented by the mean score ± standard deviation, or alternatively, the proportion of infants who score below a score of 70 can be used as the metric. Graphic drawn from data of Hack M. et al. Pediatrics 1996; 98: 931–937 (21).

References

    1. Organization WH. Preterm birth fact sheet No363.
    1. World Health Organization. March of Dimes; The Partnership for Maternal NCHStCBtstgaropb 12/13/13.
    1. Saigal S, Doyle LW. An overview of mortality and sequelae of preterm birth from infancy to adulthood. Lancet. 2008;371(9608):261–9. - PubMed
    1. Hamilton BE, Hoyert DL, Martin JA, Strobino DM, Guyer B. Annual summary of vital statistics: 2010–2011. Pediatrics. 2013;131(3):548–58. - PMC - PubMed
    1. Engle WA. Age terminology during the perinatal period. Pediatrics. 2004;114(5):1362–4. - PubMed

Publication types