. 2015 May 19:6:7152.
doi: 10.1038/ncomms8152.

Large-scale recent expansion of European patrilineages shown by population resequencing

Affiliations

Large-scale recent expansion of European patrilineages shown by population resequencing

Chiara Batini et al. Nat Commun. .

Abstract

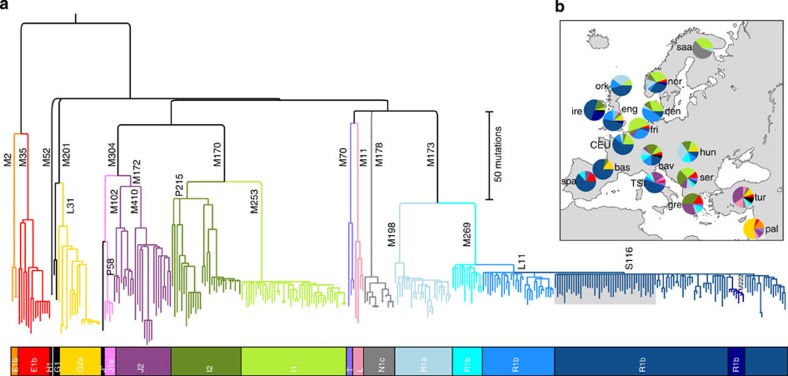
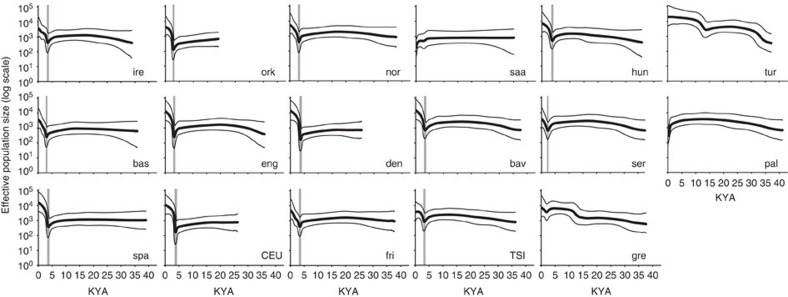
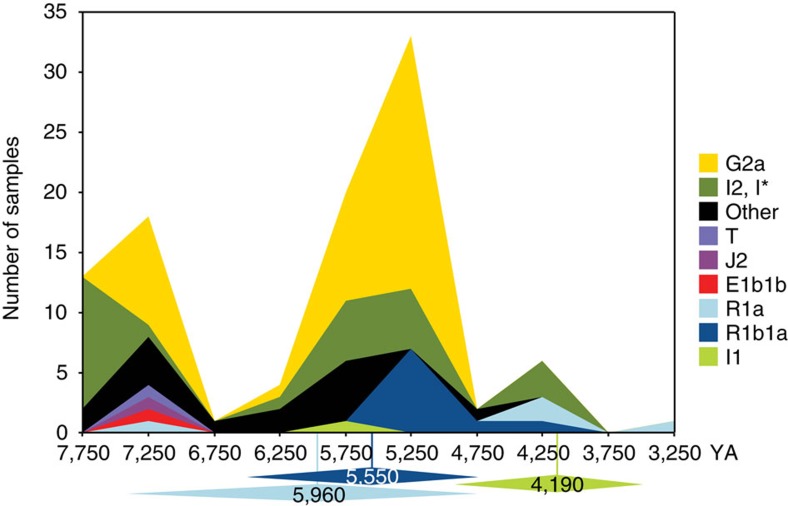
The proportion of Europeans descending from Neolithic farmers ∼ 10 thousand years ago (KYA) or Palaeolithic hunter-gatherers has been much debated. The male-specific region of the Y chromosome (MSY) has been widely applied to this question, but unbiased estimates of diversity and time depth have been lacking. Here we show that European patrilineages underwent a recent continent-wide expansion. Resequencing of 3.7 Mb of MSY DNA in 334 males, comprising 17 European and Middle Eastern populations, defines a phylogeny containing 5,996 single-nucleotide polymorphisms. Dating indicates that three major lineages (I1, R1a and R1b), accounting for 64% of our sample, have very recent coalescent times, ranging between 3.5 and 7.3 KYA. A continuous swathe of 13/17 populations share similar histories featuring a demographic expansion starting ∼ 2.1-4.2 KYA. Our results are compatible with ancient MSY DNA data, and contrast with data on mitochondrial DNA, indicating a widespread male-specific phenomenon that focuses interest on the social structure of Bronze Age Europe.


Figures

Figure 1
Figure 1. Phylogeny and geographical distribution of European MSY lineages.
(a) Maximum-parsimony tree of European MSY lineages defined here by resequencing. Branch lengths are proportional to molecular divergence among haplotypes. Key mutation names are given next to some branches, and haplogroup names in the coloured bar below. Three sporadic haplogroups are coloured in black. The grey box within hg R1b-M269 shows the star phylogeny referred to in the text. (b) Map with pie-charts showing frequencies of Y-chromosome haplogroups (defined and coloured as in part a) in 17 populations from Europe and the Near East. Population abbreviations are as follows: bas: Basque; bav: Bavaria; CEU: Utah residents with Northern and Western European ancestry from the CEPH collection (France); den: Denmark; eng: England; fri: Frisia; gre: Greece; hun: Hungary; ire: Ireland; nor: Norway; ork: Orkney; pal: Palestinians; saa: Saami; ser: Serbia; spa: Spain; TSI: Toscani in Italia (Italy); tur: Turkey.
Figure 2
Figure 2. Bayesian skyline plots.
Thick black lines indicate the median for effective population size (Ne) and thinner grey lines show 95% higher posterior density intervals. Grey shading indicates the confidence intervals of the time estimate of the minimum effective population size before the expansion, based on the limits of the 95% CI of the mutation rate. Population abbreviations are as follows: bas: Basque; bav: Bavaria; CEU: Utah residents with Northern and Western European ancestry from the CEPH collection (France); den: Denmark; eng: England; fri: Frisia; gre: Greece; hun: Hungary; ire: Ireland; nor: Norway; ork: Orkney; pal: Palestinians; saa: Saami; ser: Serbia; spa: Spain; TSI: Toscani in Italia (Italy); tur: Turkey.
Figure 3
Figure 3. Timeline of MSY ancient DNA data.
The graph shows stacked frequencies of MSY haplogroups in ancient European DNA samples, based on data from 98 individuals, and binned into 500-year intervals. ‘other' includes C1, F*, H2, R*, R1, R1b(xR1b1a). Below the timeline are indicated BEAST point estimates and highest posterior density intervals for three relevant haplogroups.

References

    1. Ammerman A. J. & Cavalli-Sforza L. L. Neolithic transition and the genetics of populations in Europe Princeton University Press (1984).
    1. Richards M. et al.. Paleolithic and neolithic lineages in the European mitochondrial gene pool. Am. J. Hum. Genet. 59, 185–203 (1996). - PMC - PubMed
    1. Novembre J. et al.. Genes mirror geography within Europe. Nature 456, 98–101 (2008). - PMC - PubMed
    1. Lao O. et al.. Correlation between genetic and geographic structure in Europe. Curr. Biol. 18, 1241–1248 (2008). - PubMed
    1. Hellenthal G. et al.. A genetic atlas of human admixture history. Science 343, 747–751 (2014). - PMC - PubMed

Publication types

MeSH terms

Substances

LinkOut - more resources