

Low haemoglobin concentration in Tibetan males is associated with greater high-altitude exercise capacity
- PMID: 25988759
- PMCID: PMC4532538
- DOI: 10.1113/JP270518
Low haemoglobin concentration in Tibetan males is associated with greater high-altitude exercise capacity
Erratum in
-
Erratum.J Physiol. 2016 Feb 1;594(3):797. doi: 10.1113/JP271680. Epub 2015 Dec 30. J Physiol. 2016. PMID: 26830049 Free PMC article. No abstract available.
Abstract
Tibetans living at high altitude have adapted genetically such that many display a low erythropoietic response, resulting in near sea-level haemoglobin (Hb) concentration. We hypothesized that absence of the erythropoietic response would be associated with greater exercise capacity compared to those with high [Hb] as a result of beneficial changes in oxygen transport. We measured, in 21 Tibetan males with [Hb] ranging from 15.2 g dl(-1) to 22.9 g dl(-1) (9.4 mmol l(-1) to 14.2 mmol l(-1) ), [Hb], ventilation, volumes of O2 and CO2 utilized at peak exercise (V̇O2 and V̇CO2), heart rate, cardiac output and arterial blood gas variables at peak exercise on a cycle ergometer at ∼4200 m. Lung and muscle O2 diffusional conductances were computed from these measurements. [Hb] was related (negatively) to V̇O2 kg(-1) (r = -0.45, P< 0.05), cardiac output kg(-1) (QT kg(-1) , r = -0.54, P < 0.02), and O2 diffusion capacity in muscle (DM kg(-1) , r = -0.44, P<0.05), but was unrelated to ventilation, arterial partial pressure of O2 (PaO2) or pulmonary diffusing capacity. Using multiple linear regression, variance in peak V̇O2 kg(-1) was primarily attributed to QT, DM, and PCO2 (R(2) = 0.88). However, variance in pulmonary gas exchange played essentially no role in determining peak V̇O2. These results (1) show higher exercise capacity in Tibetans without the erythropoietic response, supported mostly by cardiac and muscle O2 transport capacity and ventilation rather than pulmonary adaptations, and (2) support the emerging hypothesis that the polycythaemia of altitude, normally a beneficial response to low cellular PO2, may become maladaptive if excessively elevated under chronic hypoxia. The cause and effect relationships among [Hb], QT, DM, and PCO2 remain to be elucidated.
© 2015 The Authors. The Journal of Physiology © 2015 The Physiological Society.
Figures
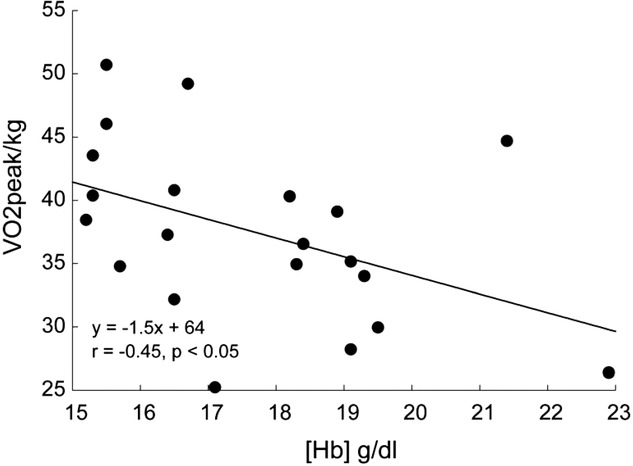
 Relationships between haemoglobin concentration ([Hb]) and peak
  (
( kg–1) in 21 male Tibetan subjects at 4200 m.
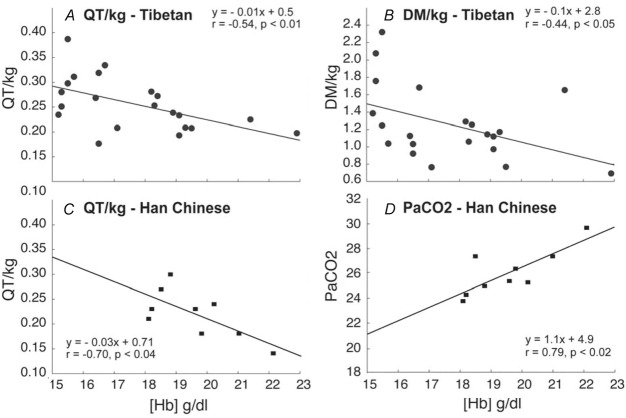
 (
( , ventilation) and lung-related (alveolar–arterial difference) components are not associated with [Hb] in Tibetans. Relationships between [Hb] and QT kg–1 (P < 0.04; C) and
  (P < 0.02; D) are also shown for 9 Han Chinese.
 , P <0.01; A), QT kg–1 (P < 0.001l; B), and DM kg–1 (P < 0.001; C), with
  kg–1 in Tibetans;
  and A-a
 difference did not exhibit a relationship with
  peak kg–1. Relationships between
  kg–1 and
  (P < 0.02; D), and DM kg–1 (P < 0.03; E) are also shown for 9 Han Chinese.
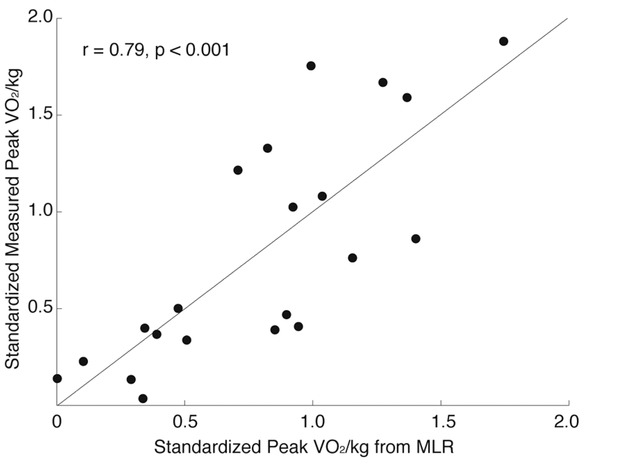
References
-
- Barker RC, Hopkins SR, Kellogg N, Olfert IM, Brutsaert TD, Gavin TP, Entin PL, Rice AJ. Wagner PD. Measurement of cardiac output during exercise by open-circuit acetylene uptake. J Appl Physiol. 1999;87:1506–1512. - PubMed
-
- Beall CM. Tibetan and Andean patterns of adaptation to high-altitude hypoxia. Hum Biol. 2000;72:201–228. - PubMed
-
- Beall CM. Andean, Tibetan, and Ethiopian patterns of adaptation to high-altitude hypoxia. Integr and Comp Bio. 2006;46:18–24. - PubMed
Publication types
MeSH terms
Substances
Grants and funding
LinkOut - more resources
Full Text Sources