. 2015 May 19:5:10312.
doi: 10.1038/srep10312.

Application of high-dimensional feature selection: evaluation for genomic prediction in man

Affiliations

Application of high-dimensional feature selection: evaluation for genomic prediction in man

M L Bermingham et al. Sci Rep. .

Abstract

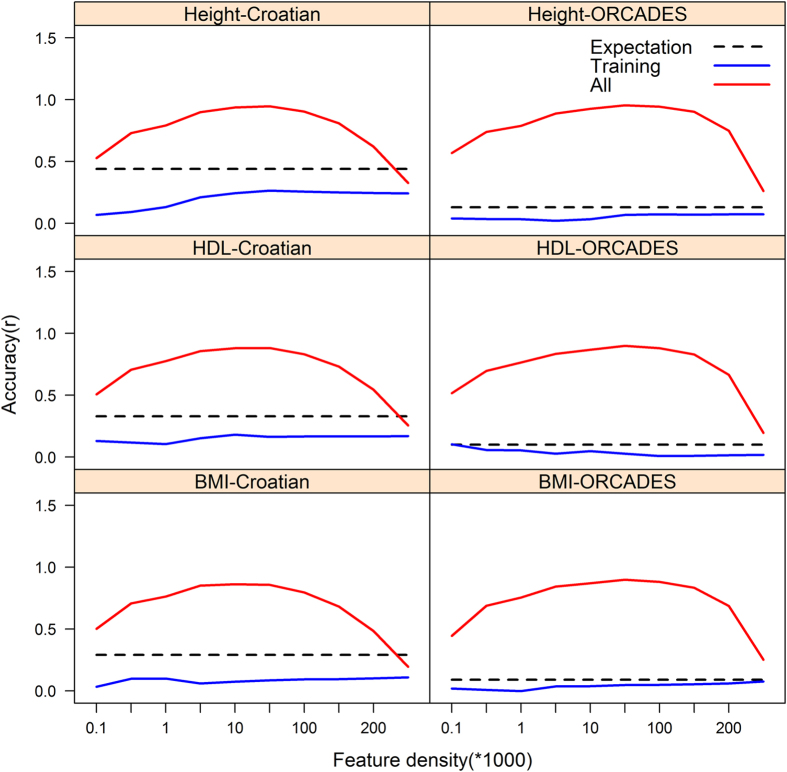
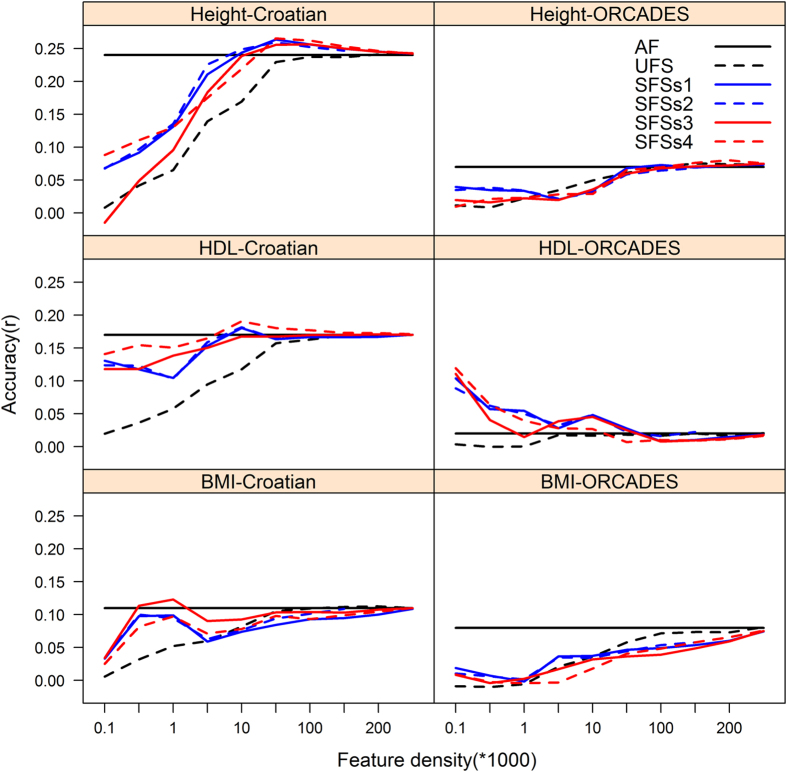
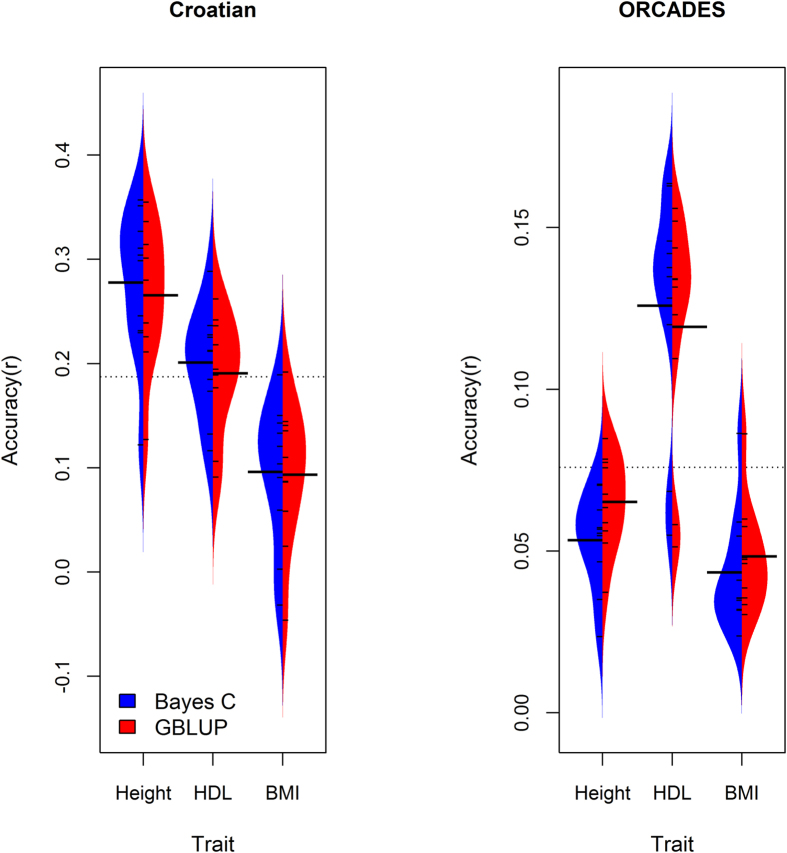
In this study, we investigated the effect of five feature selection approaches on the performance of a mixed model (G-BLUP) and a Bayesian (Bayes C) prediction method. We predicted height, high density lipoprotein cholesterol (HDL) and body mass index (BMI) within 2,186 Croatian and into 810 UK individuals using genome-wide SNP data. Using all SNP information Bayes C and G-BLUP had similar predictive performance across all traits within the Croatian data, and for the highly polygenic traits height and BMI when predicting into the UK data. Bayes C outperformed G-BLUP in the prediction of HDL, which is influenced by loci of moderate size, in the UK data. Supervised feature selection of a SNP subset in the G-BLUP framework provided a flexible, generalisable and computationally efficient alternative to Bayes C; but careful evaluation of predictive performance is required when supervised feature selection has been used.


Figures

Figure 1
Figure 1
The mean prediction accuracy (correlation between predicted and observed phenotype) across the test data sets, following tenfold cross validation the Croatian data and into ORCADES replication data; when feature subsets were ranked, and subsequently selected based on GWAS p-values estimated in each of training folds (“Training”), and when feature subsets were ranked, and subsequently selected based on GWAS p-values estimated from the whole Croatian data set (“All”). The broken black lines depict the theoretical expectation (Expectation) in related and unrelated individuals. The sold blue lines depicts the mean accuracy results across the folds when ranking and selection of feature subsets was based on GWAS P-values estimated from the training data only. The sold red lines depicts the mean accuracy results across the folds when ranking and selection of feature subsets was based on GWAS P-values estimated from all the Croatian data. There was substantial inflation of the prediction accuracy for all three traits in this study, when training data was used in feature selection i.e. when subsets were ranked and subsequently selected based on GWAS p-values estimated from the whole Croatian data set.
Figure 2
Figure 2
Average prediction accuracy (correlation between predicted and observed phenotype) across the test data sets, following tenfold cross validation the Croatian data and into the ORCADES replication data using the different marker densities selected using unsupervised, and four supervised methods of feature selection in the GBLUP frame work. The solid black line depicts the accuracy results from the full feature set of 263,357 markers. The broken black depicts the accuracy results across the different feature subset densities following unsupervised feature selection (UFS). The solid blue and broken blue and solid red, broken red lines depicts the accuracy results across the different feature subset densities following supervised feature selection scenarios (SFSs) 1-4: 1) feature selection based on ranking of trait specific genome wide association (GWAS) P-values; 2) feature selection based on ranking of trait specific GWAS P-values, and pruning based on median SNP distance (MSD) in the data this study ; 3) feature selection based on ranking of trait specific GWAS P-values, and re-ranking based on MDS conditional P-values, and 4) feature selection based on ranking of trait specific GWAS P-values, and re-ranking based on haplotype-block specific conditional P-values, respectively. The four supervised feature selection methods performed similarly. The best performance was obtained by using a small, intermediate, or large number of SNPs in the predictive models; depending on the trait architecture and/or whether the feature selection approach was supervised or not.
Figure 3
Figure 3
Distribution of prediction accuracy (correlation between predicted and observed phenotype) across the test data sets, following tenfold cross validation the Croatian data and into ORCADES replication data from the non-redundant subsets for height, high density lipoproteins (HDL) and BMI selected using supervised feature selection methods based on ranking based on haplotype-block specific conditional P-values in Bayes C and G-BLUP frameworks. The non-redundant feature subsets densities were 50,000 for height and 100,000 for BMI in both datasets, and 10,000 and 100 for high density lipoproteins (HDL) in the Croatian and ORCADES replication data respectively. The Bayes C results are plotted to the left of the center of each plot with a blue distribution and black whiskers; G-BLUP results data are plotted to the right of the center in each plot and shown with a red distribution and black whiskers. The mean of each distribution is given as a long black line. Prediction accuracy results are given relative to mean accuracies across the three traits (broken grey line). Supervised feature selection allowed G-BLUP to achieve equivalent prediction accuracy to Bayes C irrespective of the genetic architecture of the three traits under study.

References

    1. Donnelly P. Progress and challenges in genome-wide association studies in humans. Nature 456, 728–731 (2008). - PubMed
    1. Meuwissen T. H., Hayes B. J. & Goddard M. E. Prediction of total genetic value using genome-wide dense marker maps. Genetics 157, 1819–1829 (2001). - PMC - PubMed
    1. Mihaescu R., Meigs J., Sijbrands E. & Janssens A. C. Genetic risk profiling for prediction of type 2 diabetes. PLoS Currents 3, RRN1208 (2011). - PMC - PubMed
    1. Manolio T. A. et al. Finding the missing heritability of complex diseases. Nature 461, 747–753 (2009). - PMC - PubMed
    1. Balding D. J. A tutorial on statistical methods for population association studies. Nat. Rev. Genet. 7, 781–791 (2006). - PubMed

Publication types

Substances