

doi: 10.1016/j.cub.2015.03.056.
Optogenetic control of organelle transport using a photocaged chemical inducer of dimerization
Affiliations
- PMID: 25989077
- PMCID: PMC4737597
- DOI: 10.1016/j.cub.2015.03.056
Item in Clipboard
Optogenetic control of organelle transport using a photocaged chemical inducer of dimerization
Curr Biol.
.
No abstract available
Figures
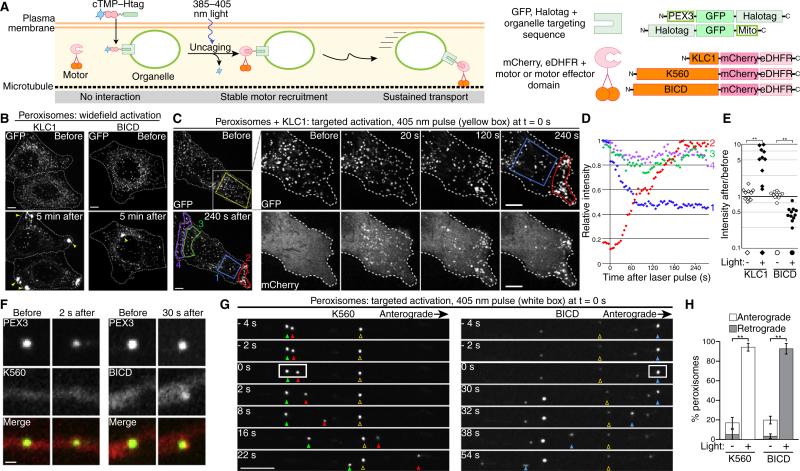
(A) Schematic of experimental approach and protein constructs. (B–E) HeLa cells and (F–H) primary rat hippocampal neurons expressing PEX3–GFP–Halo and BICD–mCherry–eDHFR, KLC1–mCherry–eDHFR or K560–mCherry–eDHFR as indicated were incubated with 10 μM cTMP–Htag prior to imaging. (B) GFP images show peroxisomes before and after widefield motor recruitment; dashed lines show cell outlines. Peroxisomes accumulated (arrowheads) in the periphery (KLC1), or center (BICD) in 100% of activated cells (n > 15 cells for each, 2 independent experiments). (C,D) KLC1 was recruited to peroxisomes in a defined region (yellow box) at t = 0. Whole-cell images (left) show GFP; insets show area in white square in GFP and mCherry. (D) GFP quantification of regions (1–4) marked in (C) shows peroxisome depletion from the interior of the photoactivated region (1, blue) and accumulation at the nearest edge of the cell (2, red), while unilluminated regions (3, 4, green and purple) are unaffected. (E) Following targeted KLC1 or BICD recruitment to peroxisomes (e.g. panel C or Figure S1F), the fold change in average GFP intensity (as a proxy for peroxisome density) was calculated for a photoactivated region (filled symbols) and a comparable unactivated region (open symbols) in each cell (n ≥ 10 cells each, similar results from 2 independent experiments). (F) Representative images of K560 and BICD recruitment to peroxisomes in neurons before photoactivation and immediately prior to motility. (G) Peroxisome movement in axons after photoactivation in a defined region (white box) at t = 0. Filled and open arrowheads mark photoactivated and unactivated peroxisomes, respectively. (H) Quantification of the percentage of peroxisomes exhibiting anterograde or retrograde movement (mean ± SEM, n = 10 neurons from 3 independent experiments). **p < 0.002, Student's t-test. Scale bar in (F) is 500 nm, all others 5 μm.
References
Publication types
MeSH terms
Substances
Grants and funding
LinkOut - more resources
Full Text Sources
Other Literature Sources
Research Materials
Miscellaneous