. 2016 Feb;76(2):137-49.
doi: 10.1002/dneu.22304. Epub 2015 Jun 1.

Differences in CART expression and cell cycle behavior discriminate sympathetic neuroblast from chromaffin cell lineages in mouse sympathoadrenal cells

Affiliations

Differences in CART expression and cell cycle behavior discriminate sympathetic neuroblast from chromaffin cell lineages in mouse sympathoadrenal cells

Wing Hei Chan et al. Dev Neurobiol. 2016 Feb.

Abstract

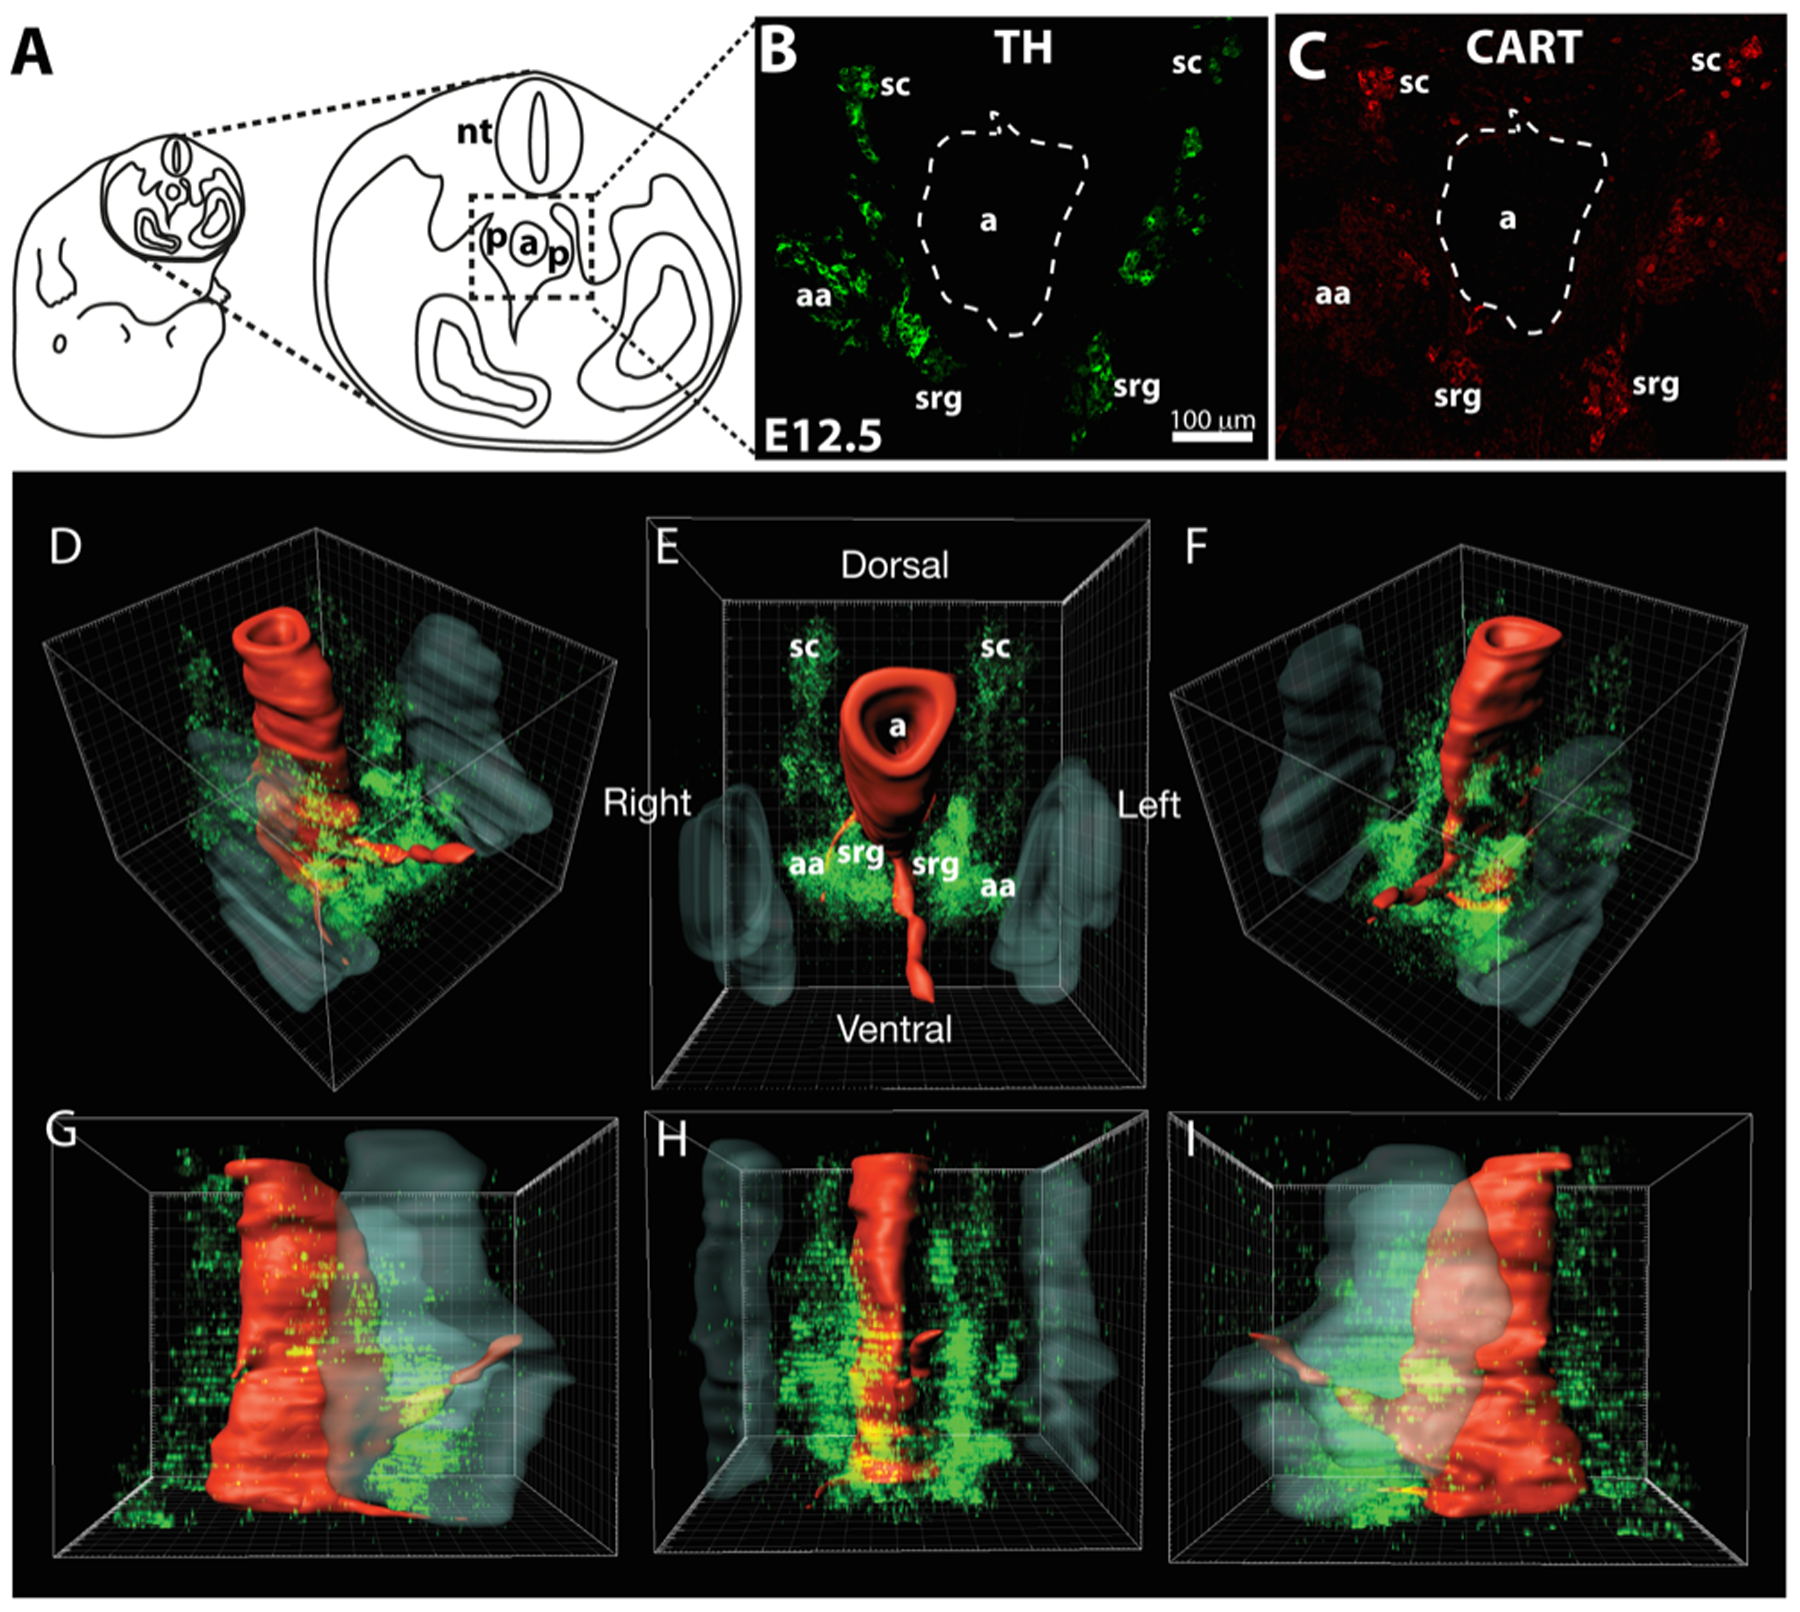
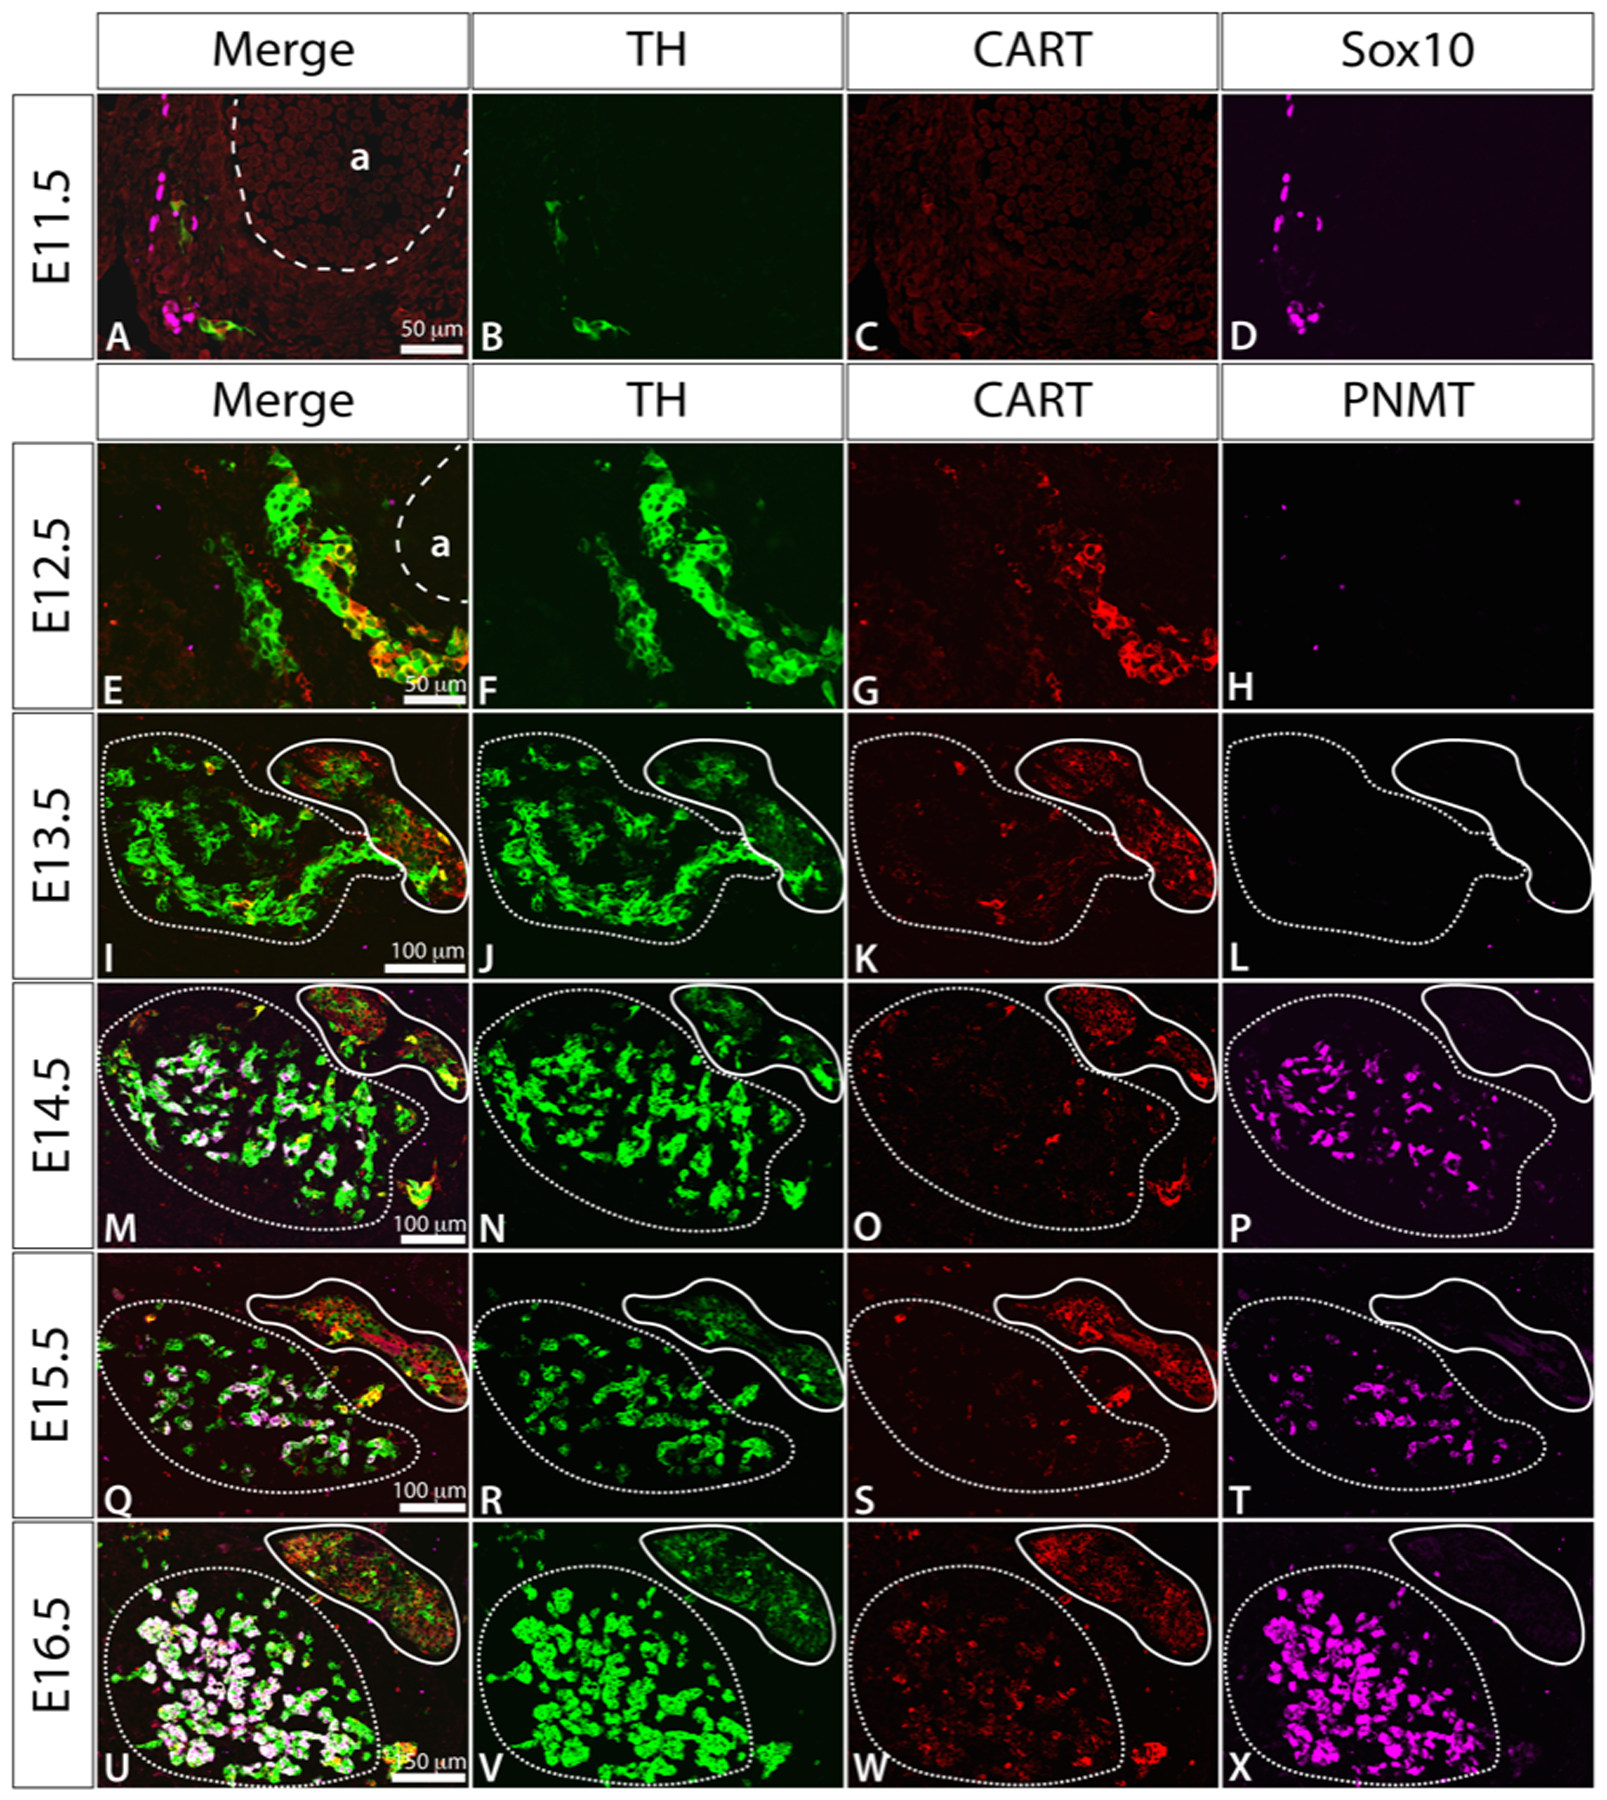
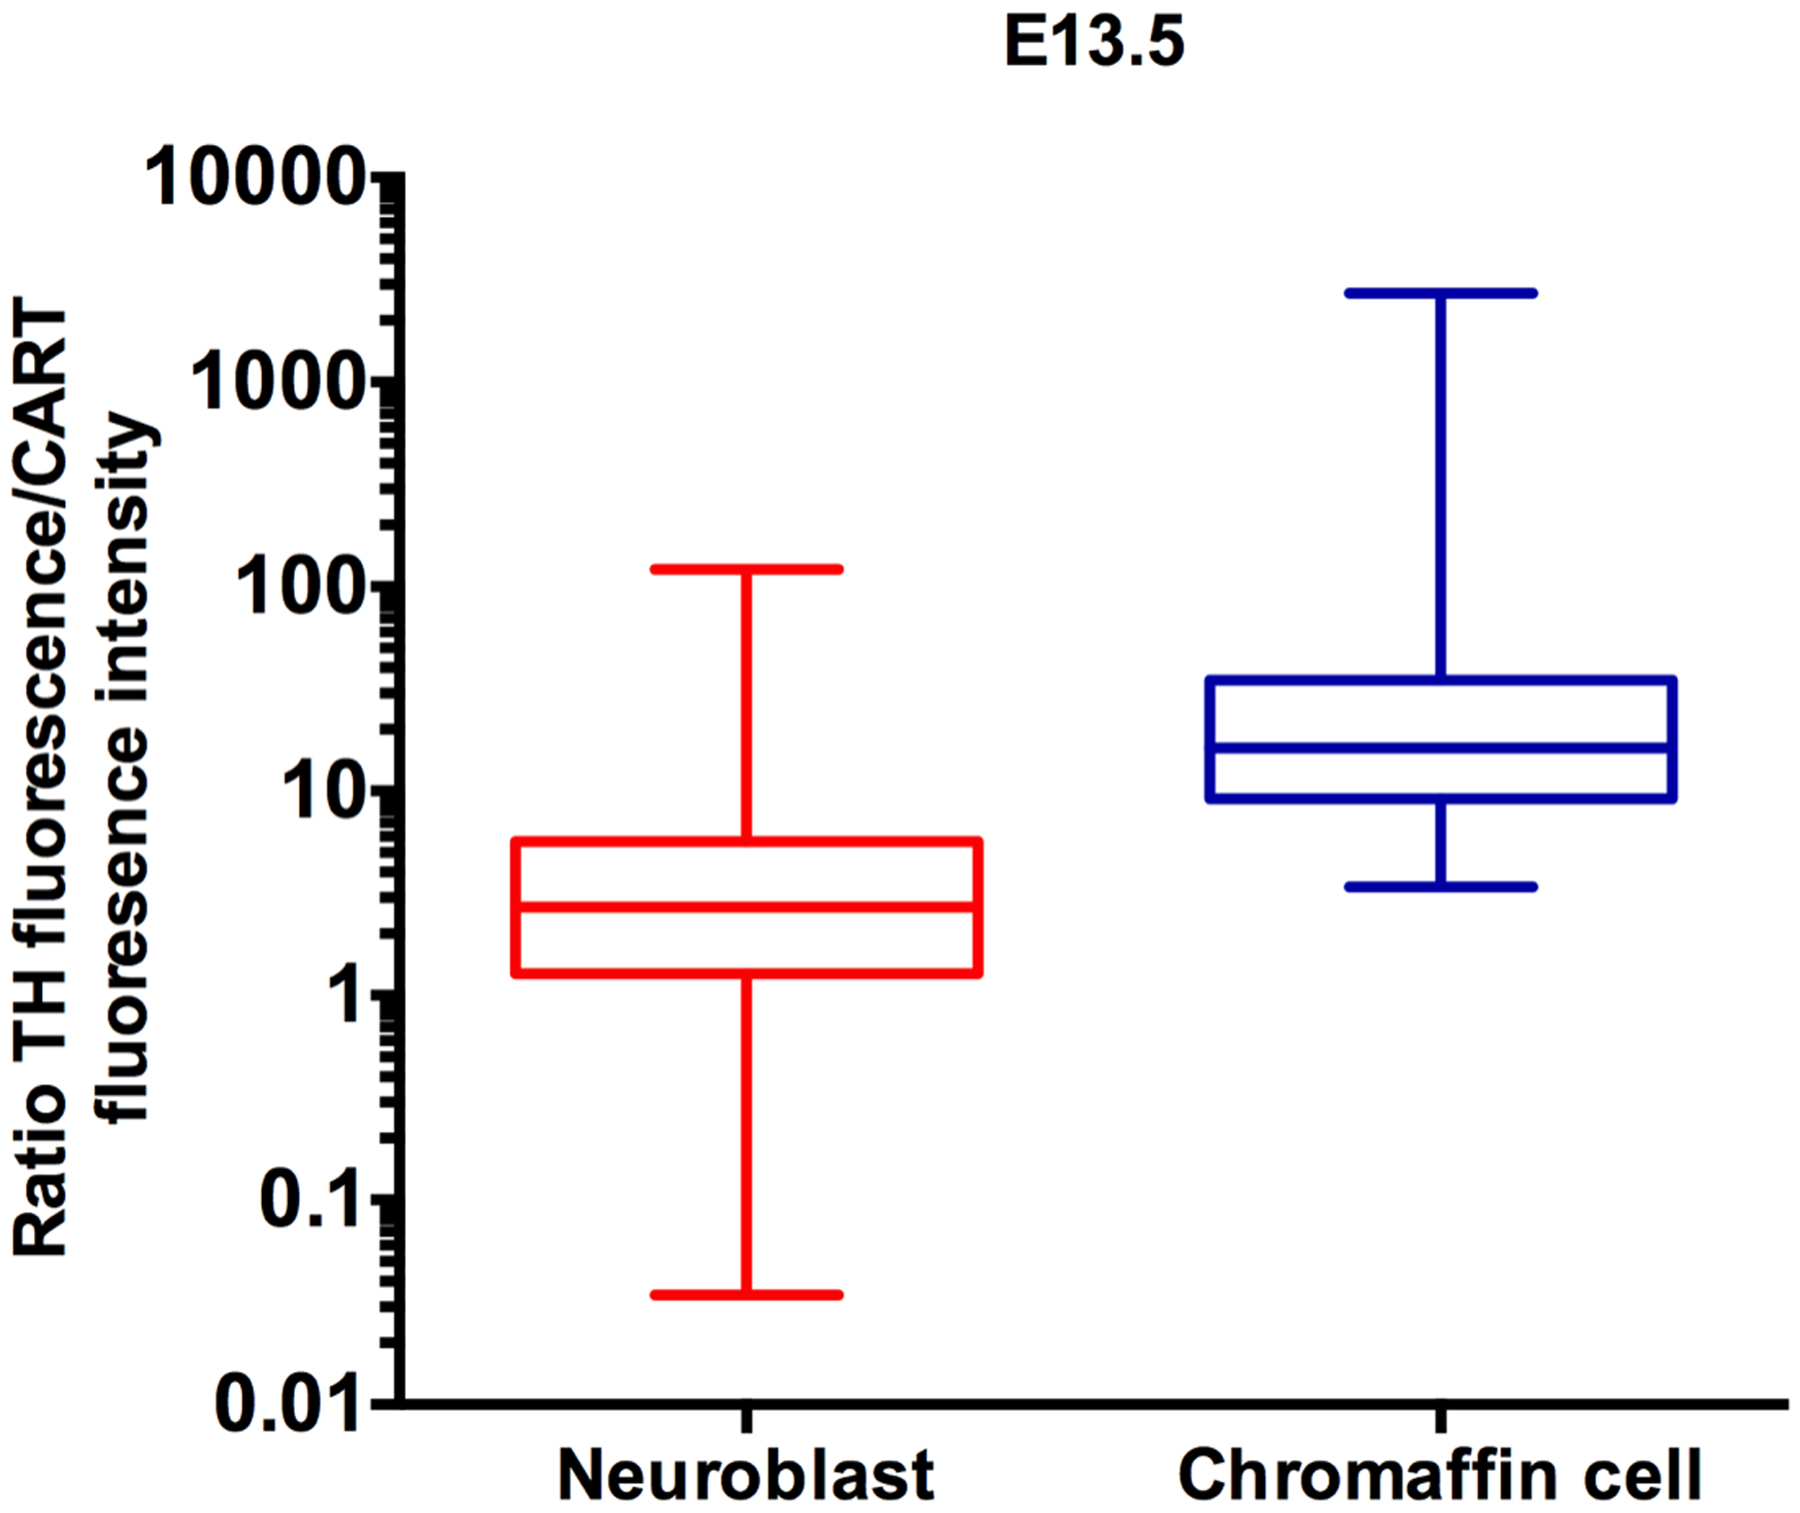
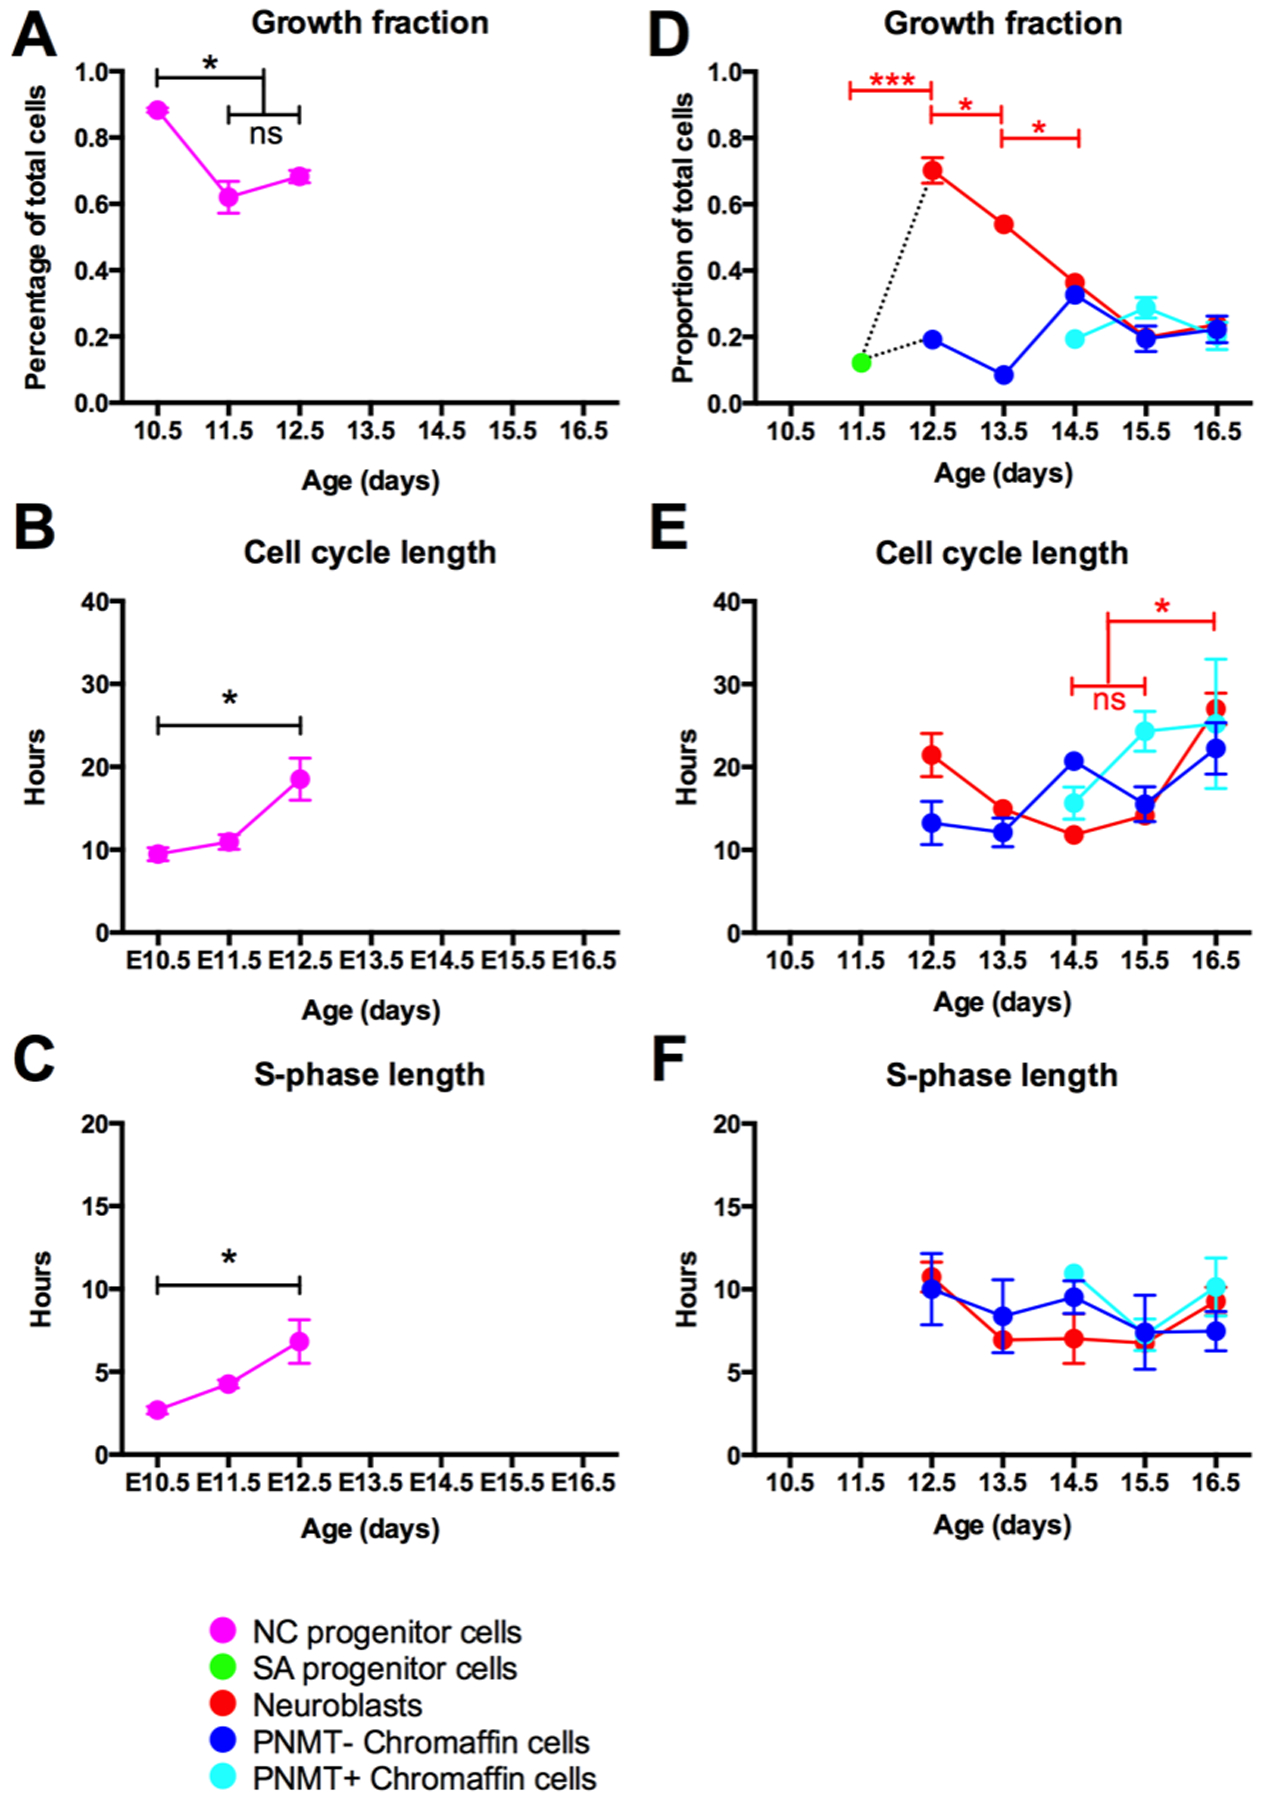
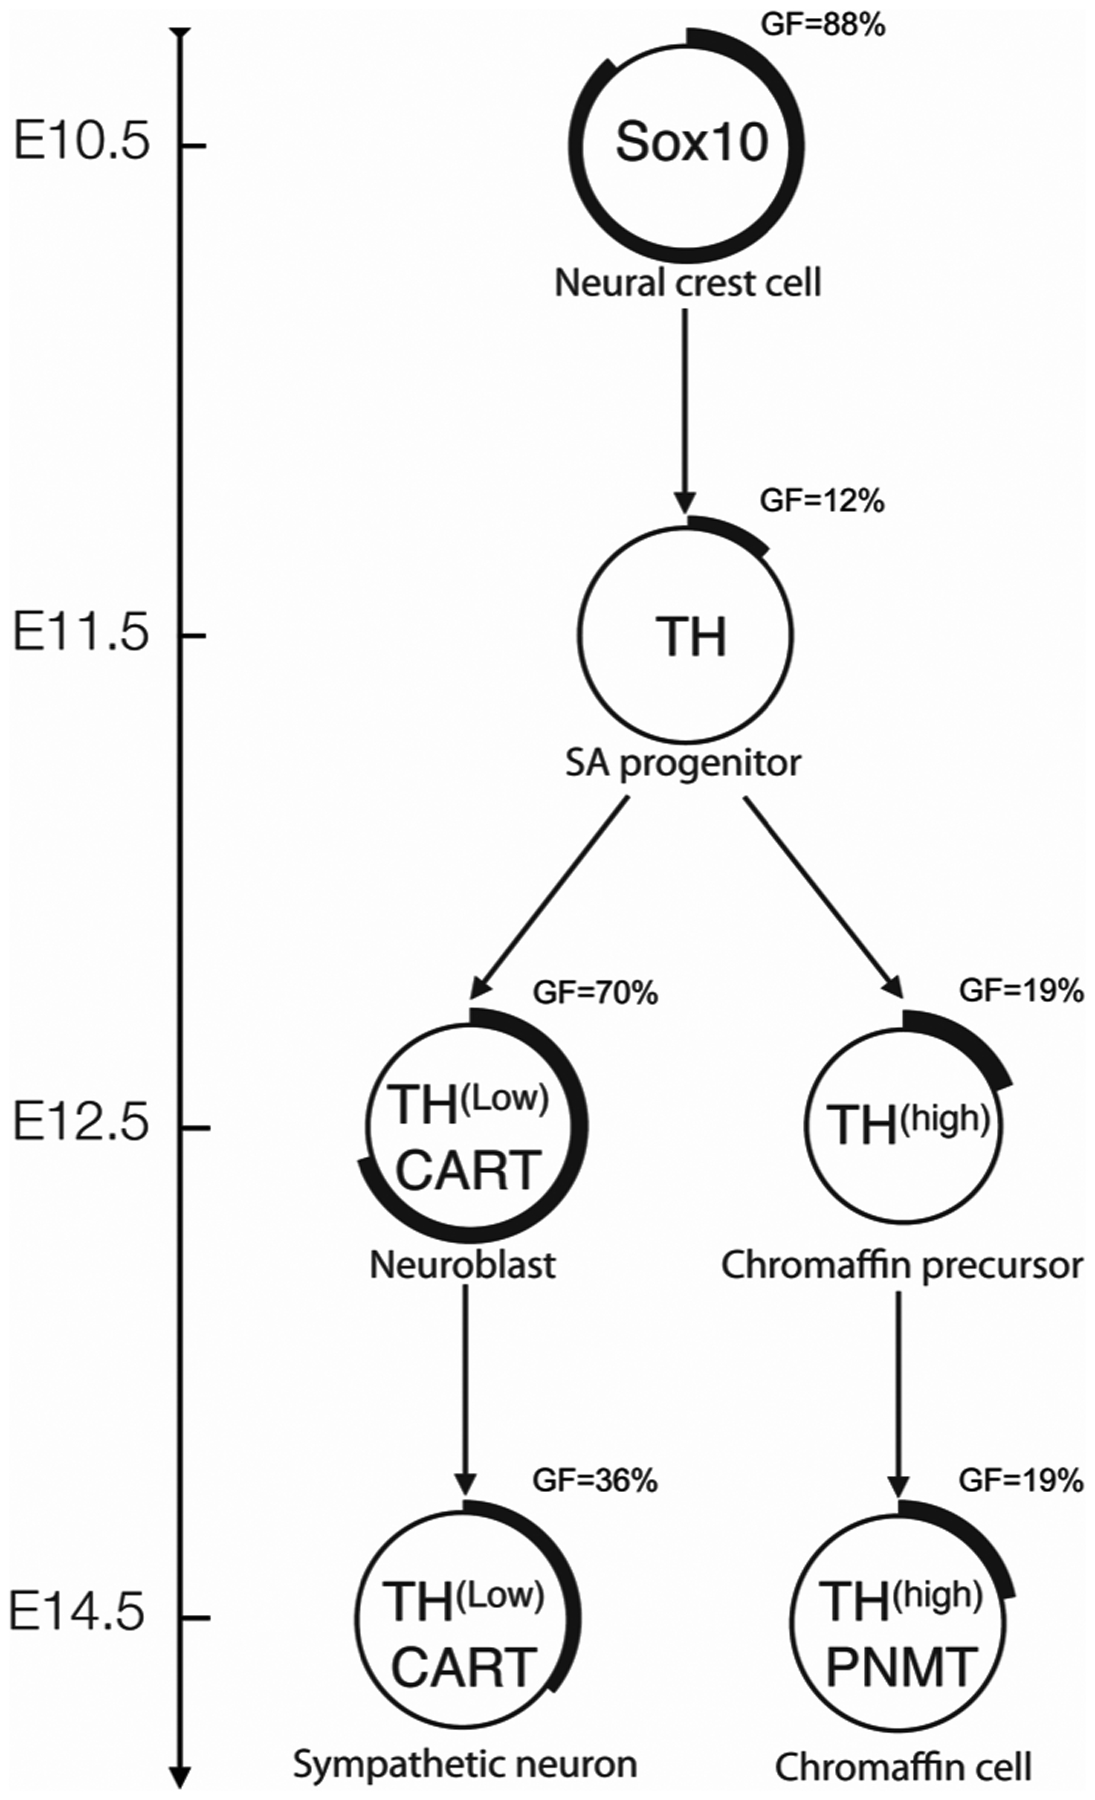
Adrenal medullary chromaffin cells and peripheral sympathetic neurons originate from a common sympathoadrenal (SA) progenitor cell. The timing and phenotypic changes that mark this lineage diversification are not fully understood. The present study investigated the expression patterns of phenotypic markers, and cell cycle dynamics, in the adrenal medulla and the neighboring suprarenal ganglion of embryonic mice. The noradrenergic marker, tyrosine hydroxylase (TH), was detected in both presumptive adrenal medulla and sympathetic ganglion cells, but with significantly stronger immunostaining in the former. There was intense cocaine and amphetamine-regulated transcript (CART) peptide immunostaining in most neuroblasts, whereas very few adrenal chromaffin cells showed detectable CART immunostaining. This phenotypic segregation appeared as early as E12.5, before anatomical segregation of the two cell types. Cell cycle dynamics were also examined. Initially, 88% of Sox10 positive (+) neural crest progenitors were proliferating at E10.5. Many SA progenitor cells withdrew from the cell cycle at E11.5 as they started to express TH. Whereas 70% of neuroblasts (TH+/CART+ cells) were back in the cell cycle at E12.5, only around 20% of chromaffin (CART negative) cells were in the cell cycle at E12.5 and subsequent days. Thus, chromaffin cell and neuroblast lineages showed differences in proliferative behavior from their earliest appearance. We conclude that the intensity of TH immunostaining and the expression of CART permit early discrimination of chromaffin cells and sympathetic neuroblasts, and that developing chromaffin cells exhibit significantly lower proliferative activity relative to sympathetic neuroblasts.

Keywords: adrenal chromaffin cells; cell cycle dynamic; cocaine and amphetamine-regulated transcript peptide; phenotypic lineage marker; sympathoadrenal cells.


Figures

Figure 1.
Figure 1.
Embryos were transversely sectioned through the upper abdominal cavity (A) and the region around the aorta (a), indicated by the dotted rectangle, imaged to include the sympathoadrenal primordia (p). B shows TH immunoreactivity in such a section at E12.5, while C shows CART immunoreactivity in the same section. Shown are the paravertebral sympathetic chain ganglia (sc), adrenal medullary anlagen (aa) and the prevertebral sympathetic suprarenal ganglia (srg). D-I shows a 3-dimensional reconstruction of the distribution of TH-immunoreactive sympathoadrenal cells (green) ventrolateral and ventral to the dorsal aorta in the sympathoadrenal primordial at E12.5. The dorsal aorta (red, a in E) and developing kidneys (grey) are outlined based on bisbenzimide staining. Views are right rostro-ventro-lateral (D), rostral (E), left rostro-ventro-lateral (F), right lateral (G), ventral (H) and left lateral (I). The paravertebral sympathetic chains (sc) are visible dorsal to the aorta as are the adrenal anlagen (aa) and suprarenal sympathetic ganglia (srg).
Figure 2.
Figure 2.
Immunostaining of transverse sections through the adrenal region of mouse embryos at E11.5-E16.5, showing TH (green), CART (red) and Sox10 (magenta) at E11.5 and TH (green), CART (red) and PNMT (magenta) at E12.5-E16.5. In E13.5-E16.5, in prevertebral suprarenal ganglion is outlined in a solid line and the adrenal medulla in a dashed line. For orientation, each image represents a region equivalent to the lower left portion of figure 1C. “a” in A and E is the dorsal aorta.
Figure 3.
Figure 3.
Box and whiskers plot of ratio of TH-IR intensity over CART-IR intensity for neuroblasts and chromaffin precursor cells from a total of 3 mouse embryos at E13.5. Each plot shows the median value, the 25th and 75th percentile and the minimum and maximum values. Note the logarithmic Y-axis.
Figure 4.
Figure 4.
Cell cycle parameters for developing mouse sympathetic ganglia and adrenal medulla from E10.5-E16.5. Plots record mean growth fractions (A and D), cell cycle lengths (B and E) and S-phase lengths (C and F) ± standard error of the mean. A-C, Data for Sox10+ neural crest progenitor cells from E10.5-E12.5. At E10.5, only Sox10 NCCs are present in the ganglion. At E11.5-E12.5, both Sox10+ NCCs are present with TH+ sympathoadrenal (SA) cells. Sox10+ cells are not shown after E12.5 as Sox10+ cells then include glial/sustentacular cells as well as NCCs. D-F, Data for SA cells, suprarenal ganglion (SRG) neuroblasts and chromaffin cells with (+) and without (−) PNMT from E11.5-E16.5. On E11.5, SA cells were identified by expression of TH; on E12.5 SRG neuroblasts were identified by expression of CART; on E13.5–16.5, SRG neuroblasts were identified by location in distinct SRG. Note the re-entry of cells into the cell cycle on E12.5 and the steady withdrawal thereafter. At E12.5, chromaffin cells were identified by presence of TH and absence of CART-IR; at E13.5–16.5, chromaffin cells were present in a distinct adrenal medulla. In each graph, asterisks indicate pairs of means that were significantly different using one-way ANOVA followed by Tukey’s test (*, p < 0.05; **, p < 0.01; ***, p < 0.001). NS, not significantly different. In D and E, only values for neuroblasts (red plot) were significantly different. Note that no CCL or S-phase length could be calculated for E11.5 SA cells as there were too few cells in the cell cycle.
Figure 5.
Figure 5.
Summary of phenotypic marker expression patterns and proliferation behavior during SA development. The neural crest-derived progenitor cells express Sox10 and are highly proliferative at E10.5. The percentage of cells in each population actively cycling is visually represented by the proportion of the outer ring that is thickened and also reported as growth fraction (GF) = x. At E10.5, in response to the BMPs released from the dorsal aorta, neural crest cells differentiate as bipotential SA progenitor cells, withdraw from the cell cycle and start expressing TH. On E12.5, two lineages have arisen; chromaffin cells can be distinguished from neuroblasts by a lack of CART expression, low intensity immunoreactivity for TH, and a low frequency of participation in the cell cycle. By E14.5, in the suprarenal ganglion primordia, neuroblasts are starting to withdraw from the cell cycle. In the adrenal medulla, significant numbers of TH+ chromaffin cells start expressing PNMT while most cells remain out of the cell cycle.

References

    1. Anderson DJ. 1993. Cell fate determination in the peripheral nervous system: The sympathoadrenal progenitor. Journal of Neurobiology 24:185–198. - PubMed
    1. Anderson DJ. 1993. Molecular control of cell fate in the neural crest: the sympathoadrenal lineage. Annu Rev Neurosci 16:129–158. - PubMed
    1. Anderson DJ. 1997. Cellular and molecular biology of neural crest cell lineage determination. Trends Genet 13:276–280. - PubMed
    1. Anderson DJ, Axel R. 1986. A bipotential neuroendocrine precursor whose choice of cell fate is determined by NGF and glucocorticoids. Cell 47:1079–1090. - PubMed
    1. Bronner-Fraser M 1994. Neural crest cell formation and migration in the developing embryo. FASEB J 8:699–706. - PubMed

Substances

LinkOut - more resources