. 2015 Jul 10;6(19):17698-712.
doi: 10.18632/oncotarget.4131.

BET inhibitor OTX015 targets BRD2 and BRD4 and decreases c-MYC in acute leukemia cells

Affiliations

BET inhibitor OTX015 targets BRD2 and BRD4 and decreases c-MYC in acute leukemia cells

Marie-Magdelaine Coudé et al. Oncotarget. .

Abstract

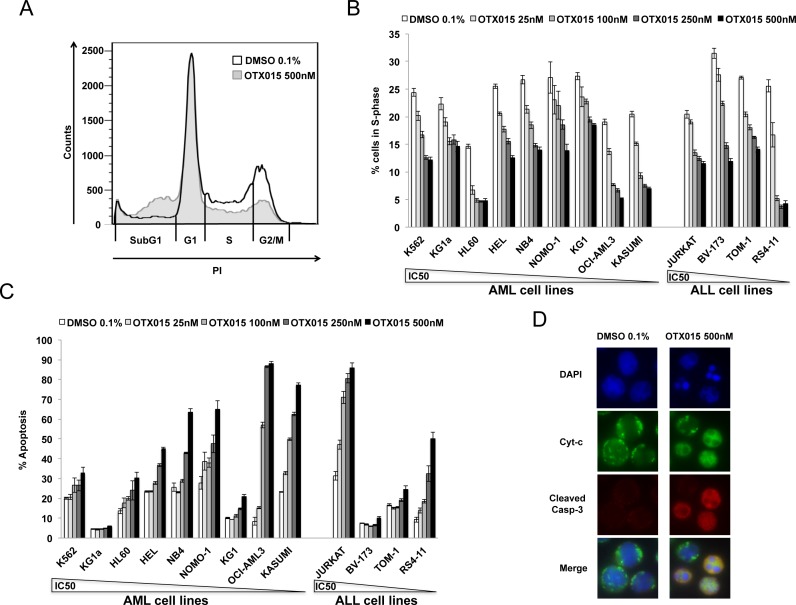
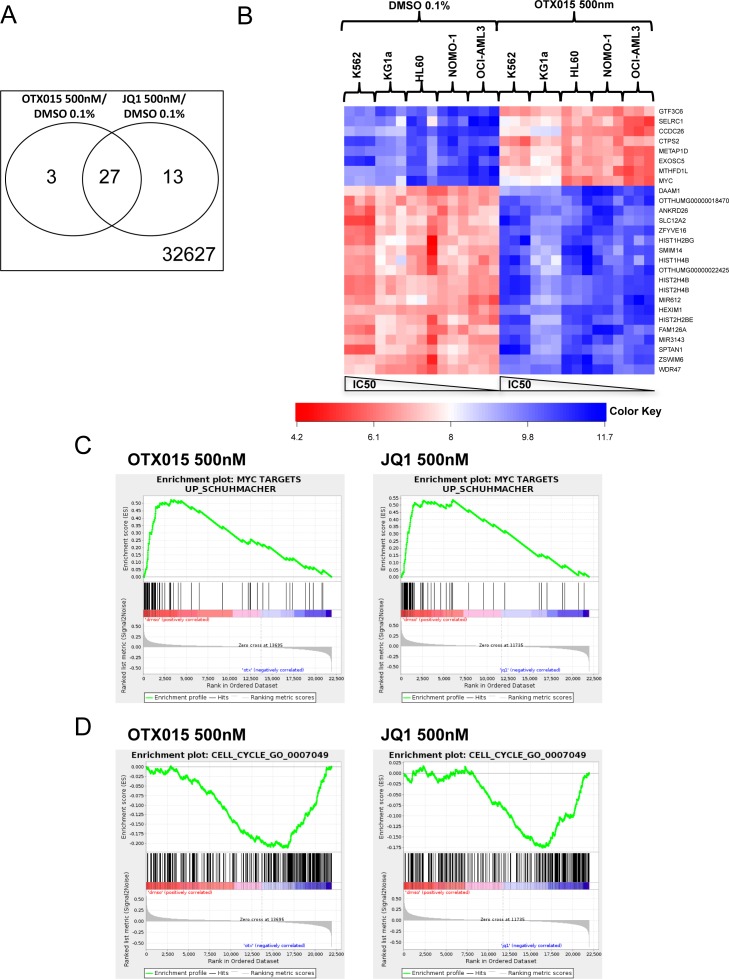
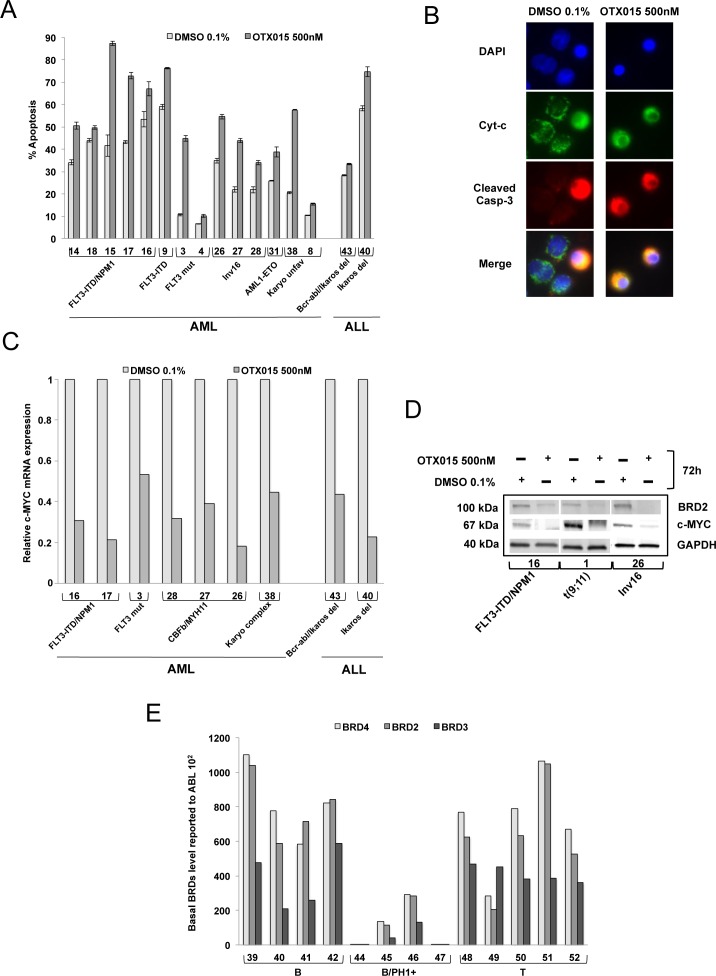
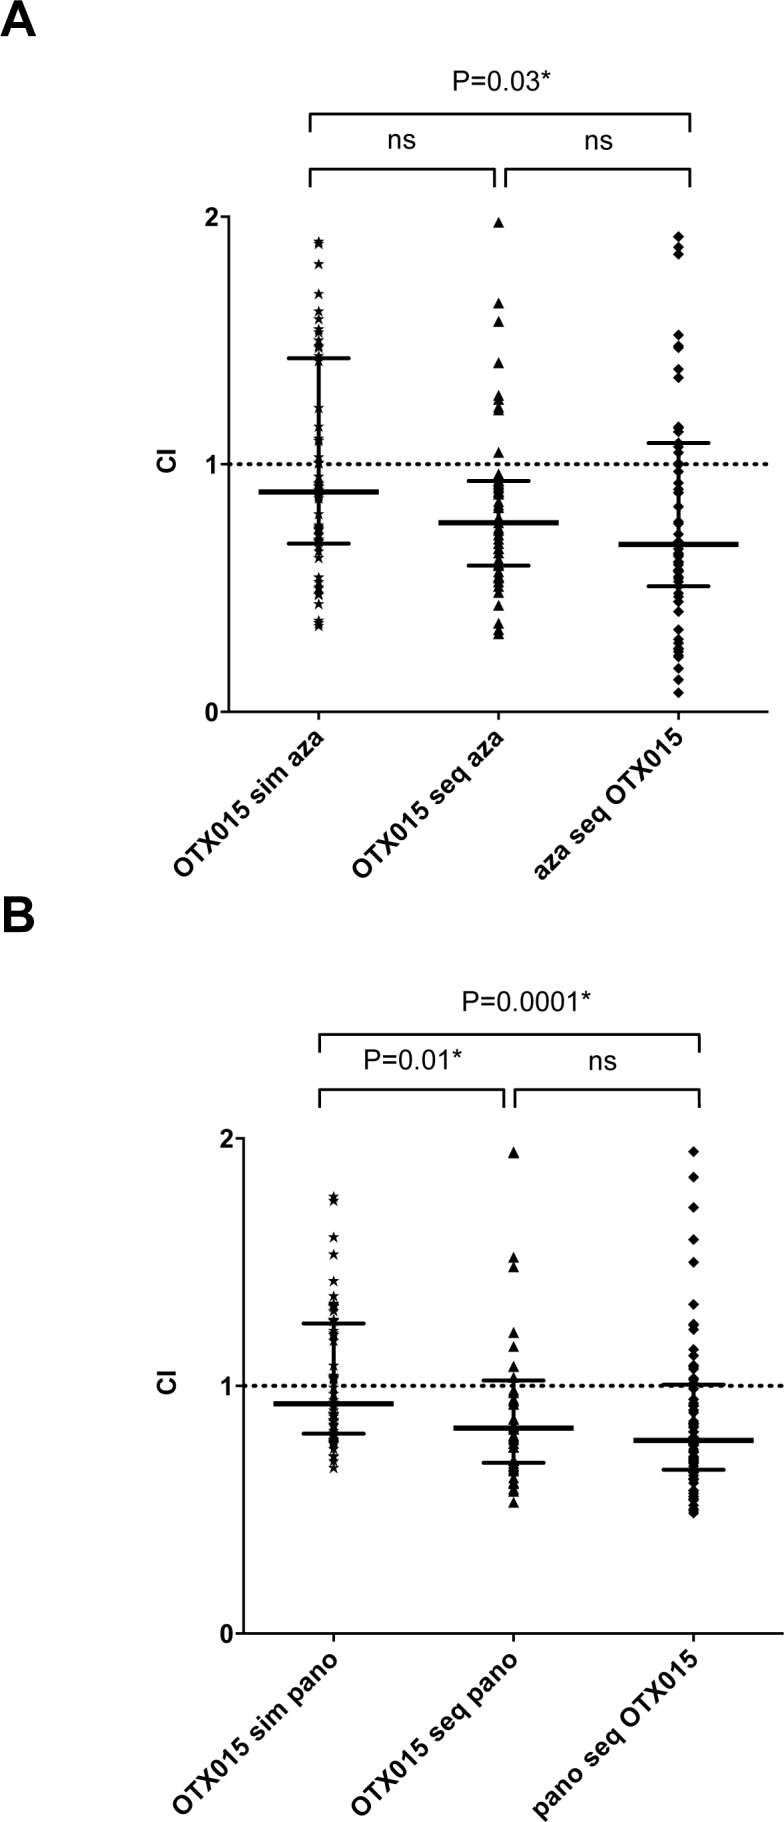
The bromodomain (BRD) and extraterminal (BET) proteins including BRD2, BRD3 and BRD4 have been identified as key targets for leukemia maintenance. A novel oral inhibitor of BRD2/3/4, the thienotriazolodiazepine compound OTX015, suitable for human use, is available. Here we report its biological effects in AML and ALL cell lines and leukemic samples. Exposure to OTX015 lead to cell growth inhibition, cell cycle arrest and apoptosis at submicromolar concentrations in acute leukemia cell lines and patient-derived leukemic cells, as described with the canonical JQ1 BET inhibitor. Treatment with JQ1 and OTX15 induces similar gene expression profiles in sensitive cell lines, including a c-MYC decrease and an HEXIM1 increase. OTX015 exposure also induced a strong decrease of BRD2, BRD4 and c-MYC and increase of HEXIM1 proteins, while BRD3 expression was unchanged. c-MYC, BRD2, BRD3, BRD4 and HEXIM1 mRNA levels did not correlate however with viability following exposure to OTX015. Sequential combinations of OTX015 with other epigenetic modifying drugs, panobinostat and azacitidine have a synergic effect on growth of the KASUMI cell line. Our results indicate that OTX015 and JQ1 have similar biological effects in leukemic cells, supporting OTX015 evaluation in a Phase Ib trial in relapsed/refractory leukemia patients.

Keywords: BET inhibitors; HEXIM1; OTX015; acute leukemias; c-MYC.


Conflict of interest statement

CONFLICTS OF INTEREST

HD received research funding from Oncoethix.

MER is an employee of OTD who receives funding from Oncoethix.

PH is the Chief Medical Officer and a shareholder of Oncoethix.

MMC, TB, JB, MD, MDe, SB, AM, ER, RI, AB, CG have no conflicts of interest.

Figures

Figure 1
Figure 1. Effect of OTX015 on the cell cycle and apoptosis in AML and ALL cell lines
Cell cycle alterations at 48h induced by increasing OTX015 doses (25nM-500nM) in leukemia cell lines: A. Representative flow cytometry overlay of the HEL cell line treated with 500nM OTX015 for 48h compared to 0.1% DMSO and B. percent cells in S-phase for all cell lines. Results are shown as mean +/− SEM from duplicates of three independent experiments. C. Apoptosis in AML and ALL cell lines after 72h exposure to increasing OTX015 doses (25nM-500nM). Apoptotic cells were defined as Annexin V+ with or without PI uptake. Results are shown as mean +/− SEM from duplicates of three independent experiments. D. Imunofluorescence for cytochrome c and activated caspase-3 in NOMO-1 cells after 72h exposure to 500nM OTX015 or 0.1% DMSO. Cytochrome c is shown in green, activated caspase-3 in red and nuclei are labelled blue. In non-apoptotic cells, cytochrome c (green) shows dotted staining localized to mitochondria, while no activated caspase-3 is detected, and in apoptotic cells, cytochrome c is released into the cytosol (green) and activated caspase-3 is localized in the cytoplasm (red). Merged images of apoptotic cells appear in yellow.
Figure 2
Figure 2. Molecular profiles after treatment with OTX015 and JQ1 in AML cell lines
GeneChip Human Transcriptome Array HTA 2.0 (Affymetrix®) was performed for K562, KG1a, HL60, NOMO-1 and OCI-AML3 cells treated with either 500nM OTX015, 500nM JQ1 or 0.1% DMSO for 24h. Experiments were performed as triplicates. A. Venn diagram of signatures of 29 and 39 genes in the OTX015 vs. DMSO contrast and the JQ1 vs. DMSO contrast respectively. B. Heatmap of the JQ1 and OTX015 commune signature showing differently regulated genes in cell lines after treatment with OTX015 500nM compared to DMSO 0,1%. C. and D. MYC and cell cycle signatures enriched in all cell lines after treatment with OTX015 and JQ1.
Figure 3
Figure 3. c-MYC, BRD2/3/4 and HEXIM1 expression in AML and ALL cell lines after OTX015 treatment
A. c-MYC basal gene expression in AML and ALL cell lines determined by RT-qPCR, relative to ABL 102. Results are shown as mean +/− SEM from duplicates of three independent experiments. B. Western blot showing c-MYC, BRD2/3/4, and HEXIM1 protein changes in OCI-AML3 and JURKAT cells treated with 500nM OTX015 for 24, 48 or 72h or 0.1% DMSO. GAPDH was used as a loading control. One representative experiment out of three is shown. C. RT-qPCR showing c-MYC decrease in AML and ALL cell lines after 4 and 24h exposure with 500nM OTX015, relative to GAPDH and normalized to 0.1% DMSO. Results are shown as mean +/− SEM from duplicates of three independent experiments. D. RT-qPCR showing BRD4, BRD2, and BRD3 basal gene expression in leukemia cell lines, relative to ABL 102. Results are shown as mean +/− SEM from duplicates of three independent experiments. E. RT-qPCR showing BRD4, BRD2, and BRD3 mRNA expression levels after 48h exposure to 500nM OTX015 in leukemia cell lines, relative to ABL and normalized to 0.1% DMSO. Results are shown as mean +/− SEM from duplicates of three independent experiments. F. RT-qPCR showing HEXIM1 mRNA increase in AML and ALL cell lines after 4h and 24h exposure with 500nM OTX015, relative to GAPDH and normalized to 0.1% DMSO. Results are shown as mean +/− SEM from duplicates of three independent experiments.
Figure 4
Figure 4. Induction of apoptosis, expression of c-MYC and BRD2 following OTX015, and basal expression of BRD2/3/4 in AML and ALL patient samples
A. Bone marrow mononuclear cells were exposed to 500nM OTX015 for 72h. Apoptotic cells were defined as Annexin V+ with or without PI uptake. Results are shown as mean +/− SEM. B. BM cells from a patient with MLL-rearranged AML (MLL-AF9) (Patient 1, Table 2) showing cytochrome c (green), activated caspase-3 (red) and nuclei (blue). In non-apoptotic cells cytochrome c (green) shows dotted staining localized in the mitochondria while no activated caspase-3 could be detected, and in apoptotic cells cytochrome c is released into the cytosol (green) and activated caspase-3 is localized to the cytoplasm (red). Merged images of apoptotic cells appear in yellow. C. RT-qPCR showing c-MYC mRNA expression in nine AML and ALL patient samples after 72h exposure with 500nM OTX015 or 0.1% DMSO, relative to ABL normalized to 0.1% DMSO. D. Western blot showing BRD2, c-MYC and GAPDH expression in three AML patient samples exposed 72h to 500nM OTX015 or 0.1% DMSO ex vivo. E. RT-qPCR showing BRD4, BRD2, and BRD3 basal gene expression levels in 13 ALL patient samples, relative to ABL 102.
Figure 5
Figure 5. Simultaneous and sequential treatment of KASUMI cells with OTX015 and azacitidine and panobinostat show additional and synergic effects
Combination Index (CI) versus Fractional Effect (FE) plots were calculated using CalcuSyn® Software Version 2.1. Median CI of different dose combinations (simultaneous and sequential) were calculated for OTX 015 and azacitidine A. or OTX015 and panobinostat B.. CI values < 0.9 indicate synergy. Median CI values were calculated as median with interquartile range from three independent experiments and compared by the Mann-Whitney test.

References

    1. Patel KP, Barkoh BA, Chen Z, Ma D, Reddy N, Medeiros LJ, Luthra R. Diagnostic testing for IDH1 and IDH2 variants in acute myeloid leukemia an algorithmic approach using high-resolution melting curve analysis. The Journal of molecular diagnostics : JMD. 2011;13:678–686. - PMC - PubMed
    1. Zuber J, Shi J, Wang E, Rappaport AR, Herrmann H, Sison EA, Magoon D, Qi J, Blatt K, Wunderlich M, Taylor MJ, Johns C, Chicas A, Mulloy JC, Kogan SC, Brown P, et al. RNAi screen identifies Brd4 as a therapeutic target in acute myeloid leukaemia. Nature. 2011;478:524–528. - PMC - PubMed
    1. Ott CJ, Kopp N, Bird L, Paranal RM, Qi J, Bowman T, Rodig SJ, Kung AL, Bradner JE, Weinstock DM. BET bromodomain inhibition targets both c-Myc and IL7R in high-risk acute lymphoblastic leukemia. Blood. 2012;120:2843–2852. - PMC - PubMed
    1. Delmore JE, Issa GC, Lemieux ME, Rahl PB, Shi J, Jacobs HM, Kastritis E, Gilpatrick T, Paranal RM, Qi J, Chesi M, Schinzel AC, McKeown MR, Heffernan TP, Vakoc CR, Bergsagel PL, et al. BET bromodomain inhibition as a therapeutic strategy to target c-Myc. Cell. 2011;146:904–917. - PMC - PubMed
    1. Emadali A, Rousseaux S, Bruder-Costa J, Rome C, Duley S, Hamaidia S, Betton P, Debernardi A, Leroux D, Bernay B, Kieffer-Jaquinod S, Combes F, Ferri E, McKenna CE, Petosa C, Bruley C, et al. Identification of a novel BET bromodomain inhibitor-sensitive, gene regulatory circuit that controls Rituximab response and tumour growth in aggressive lymphoid cancers. EMBO molecular medicine. 2013;5:1180–1195. - PMC - PubMed

Publication types

MeSH terms