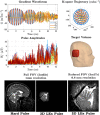
Parallel transmission for ultrahigh-field imaging
- PMID: 25989904
- PMCID: PMC4995736
- DOI: 10.1002/nbm.3313
Parallel transmission for ultrahigh-field imaging
Abstract
The development of MRI systems operating at or above 7 T has provided researchers with a new window into the human body, yielding improved imaging speed, resolution and signal-to-noise ratio. In order to fully realise the potential of ultrahigh-field MRI, a range of technical hurdles must be overcome. The non-uniformity of the transmit field is one of such issues, as it leads to non-uniform images with spatially varying contrast. Parallel transmission (i.e. the use of multiple independent transmission channels) provides previously unavailable degrees of freedom that allow full spatial and temporal control of the radiofrequency (RF) fields. This review discusses the many ways in which these degrees of freedom can be used, ranging from making more uniform transmit fields to the design of subject-tailored RF pulses for both uniform excitation and spatial selection, and also the control of the specific absorption rate. © 2015 The Authors. NMR in Biomedicine published by John Wiley & Sons Ltd.
Keywords: B1 mapping; RF shimming; SAR; parallel transmission; ultrahigh-field MRI.
© 2015 The Authors. NMR in Biomedicine published by John Wiley & Sons Ltd.
Figures


Similar articles
-
Parallel RF transmission in MRI.NMR Biomed. 2006 May;19(3):393-400. doi: 10.1002/nbm.1049. NMR Biomed. 2006. PMID: 16705630 Review.
-
Rapid brain MRI acquisition techniques at ultra-high fields.NMR Biomed. 2016 Sep;29(9):1198-221. doi: 10.1002/nbm.3478. Epub 2016 Feb 2. NMR Biomed. 2016. PMID: 26835884 Free PMC article. Review.
-
Slice-selective RF pulses for in vivo B1+ inhomogeneity mitigation at 7 tesla using parallel RF excitation with a 16-element coil.Magn Reson Med. 2008 Dec;60(6):1422-32. doi: 10.1002/mrm.21739. Magn Reson Med. 2008. PMID: 19025908 Free PMC article.
-
Tailored excitation in 3D with spiral nonselective (SPINS) RF pulses.Magn Reson Med. 2012 May;67(5):1303-15. doi: 10.1002/mrm.23118. Epub 2011 Aug 12. Magn Reson Med. 2012. PMID: 21842503
-
Reducing SAR in parallel excitation using variable-density spirals: a simulation-based study.Magn Reson Imaging. 2008 Oct;26(8):1122-32. doi: 10.1016/j.mri.2008.02.003. Epub 2008 Apr 28. Magn Reson Imaging. 2008. PMID: 18440750
Cited by
-
Helmet Radio Frequency Phased Array Applicators Enhance Thermal Magnetic Resonance of Brain Tumors.Bioengineering (Basel). 2024 Jul 19;11(7):733. doi: 10.3390/bioengineering11070733. Bioengineering (Basel). 2024. PMID: 39061815 Free PMC article.
-
Toward imaging the body at 10.5 tesla.Magn Reson Med. 2017 Jan;77(1):434-443. doi: 10.1002/mrm.26487. Epub 2016 Oct 21. Magn Reson Med. 2017. PMID: 27770469 Free PMC article.
-
Electromagnetic simulation of a 16-channel head transceiver at 7 T using circuit-spatial optimization.Magn Reson Med. 2021 Jun;85(6):3463-3478. doi: 10.1002/mrm.28672. Epub 2021 Feb 3. Magn Reson Med. 2021. PMID: 33533500 Free PMC article.
-
Deep learning-based local SAR prediction using B1 maps and structural MRI of the head for parallel transmission at 7 T.Magn Reson Med. 2023 Dec;90(6):2524-2538. doi: 10.1002/mrm.29797. Epub 2023 Jul 19. Magn Reson Med. 2023. PMID: 37466040 Free PMC article.
-
3D Metamaterials Facilitate Human Cardiac MRI at 21.0 Tesla: A Proof-of-Concept Study.Sensors (Basel). 2025 Jan 21;25(3):620. doi: 10.3390/s25030620. Sensors (Basel). 2025. PMID: 39943259 Free PMC article.
References
-
- Röschmann P. Radiofrequency penetration and absorption in the human body: limitations to high‐field whole‐body nuclear magnetic resonance imaging. Med. Phys. 1987; 14: 922–931. - PubMed
-
- Ibrahim TS, Lee R, Abduljalil AM, Baertlein BA, Robitaille P‐ML. Dielectric resonances and B1 field inhomogeneity in UHFMRI: computational analysis and experimental findings. Magn. Reson. Imaging 2001; 19: 219–226. - PubMed
-
- Van de Moortele PF, Akgun C, Adriany G, Moeller S, Ritter J, Collins CM, Smith MB, Vaughan JT, Uğurbil K. B1 destructive interferences and spatial phase patterns at 7 T with a head transceiver array coil. Magn. Reson. Med. 2005; 54: 1503–1518. - PubMed
-
- Wiesinger F, Van de Moortele PF, Adriany G, De Zanche N, Ugurbil K, Pruessmann KP. Parallel imaging performance as a function of field strength—an experimental investigation using electrodynamic scaling. Magn. Reson. Med. 2004; 52: 953–964. - PubMed
Publication types
MeSH terms
Grants and funding
LinkOut - more resources
Full Text Sources
Other Literature Sources
Medical
Miscellaneous

