. 2015 May 20:6:7155.
doi: 10.1038/ncomms8155.

Proteins that bind regulatory regions identified by histone modification chromatin immunoprecipitations and mass spectrometry

Affiliations

Proteins that bind regulatory regions identified by histone modification chromatin immunoprecipitations and mass spectrometry

Erik Engelen et al. Nat Commun. .

Abstract

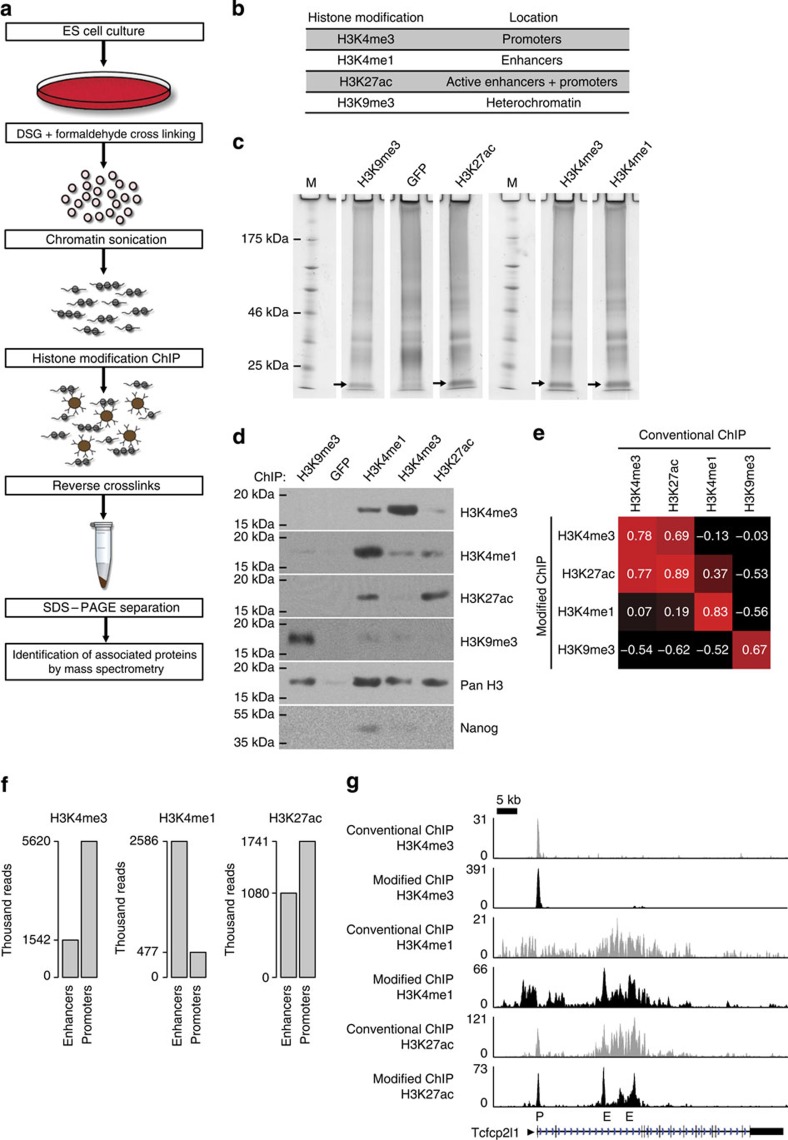
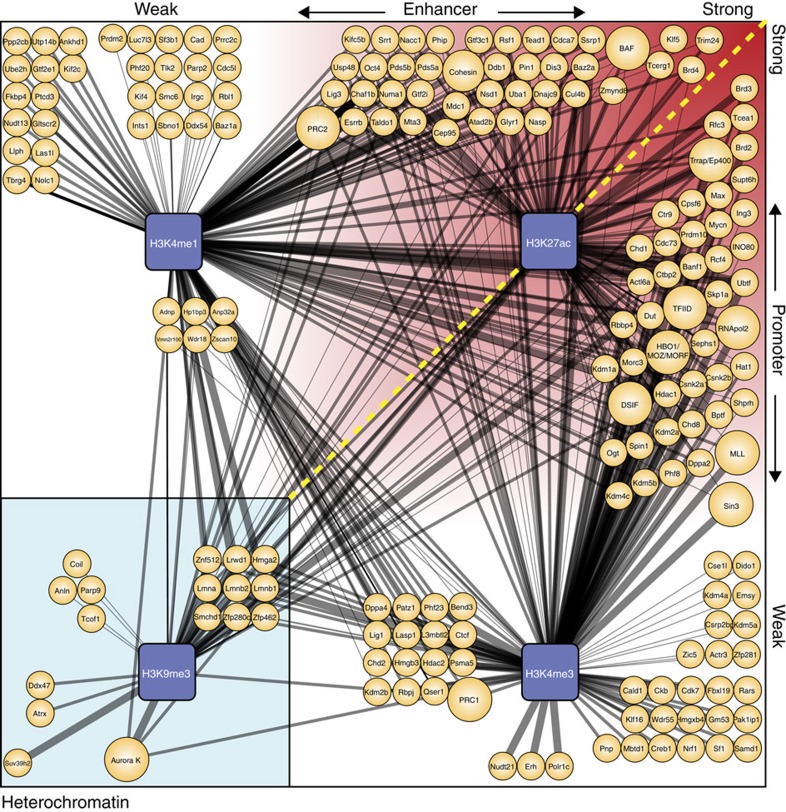
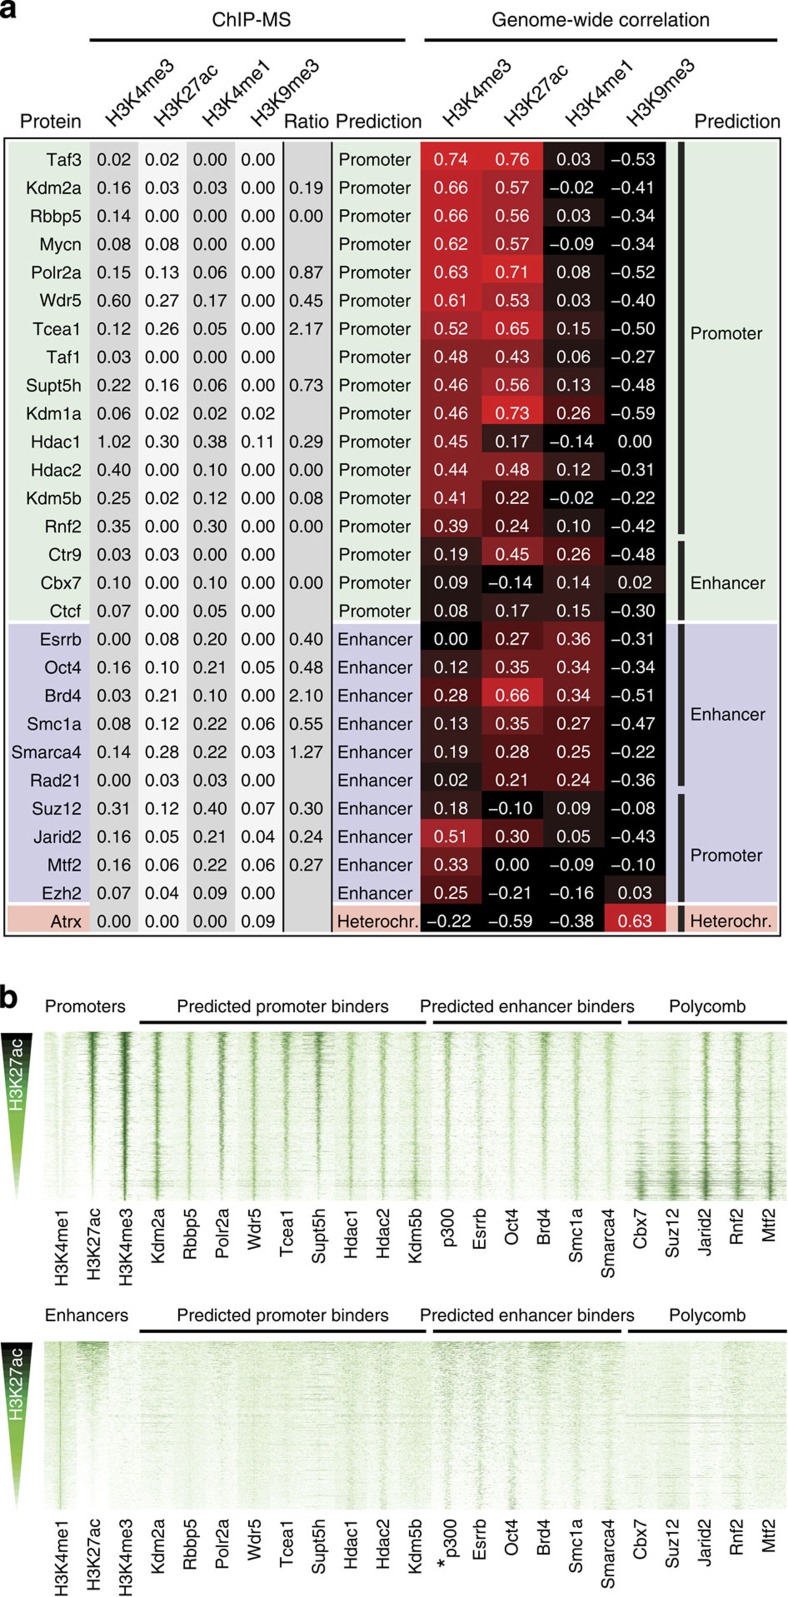
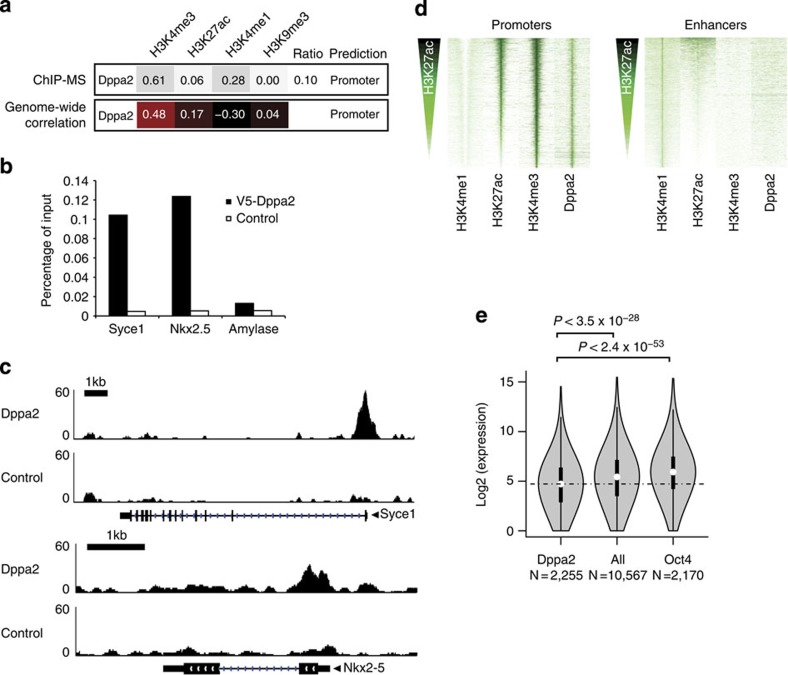
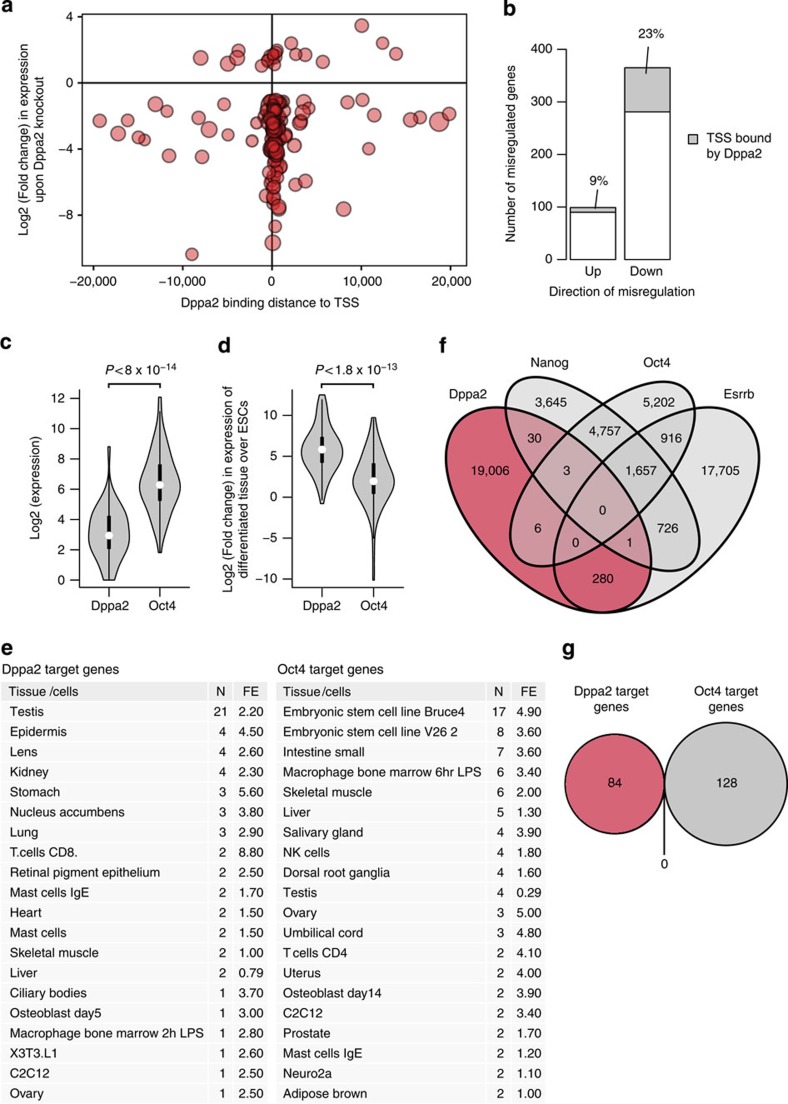
The locations of transcriptional enhancers and promoters were recently mapped in many mammalian cell types. Proteins that bind those regulatory regions can determine cell identity but have not been systematically identified. Here we purify native enhancers, promoters or heterochromatin from embryonic stem cells by chromatin immunoprecipitations (ChIP) for characteristic histone modifications and identify associated proteins using mass spectrometry (MS). 239 factors are identified and predicted to bind enhancers or promoters with different levels of activity, or heterochromatin. Published genome-wide data indicate a high accuracy of location prediction by ChIP-MS. A quarter of the identified factors are important for pluripotency and includes Oct4, Esrrb, Klf5, Mycn and Dppa2, factors that drive reprogramming to pluripotent stem cells. We determined the genome-wide binding sites of Dppa2 and find that Dppa2 operates outside the classical pluripotency network. Our ChIP-MS method provides a detailed read-out of the transcriptional landscape representative of the investigated cell type.


Figures

Figure 1
Figure 1. Outline and initial validation of the ChIP-MS protocol.
(a) Flowchart of the ChIP-MS protocol. (b) Histone modifications used in ChIP-MS and their predominant location on the genome. (c) Representative 10% polyacrylamide gel with proteins from ChIPs for the indicated histone modifications and the GFP control ChIP. Arrows indicate unresolved histones in the histone modification ChIPs, which are absent in the GFP control ChIP. Molecular weight markers are depicted by M. (d) Western blot analyses of the histone modification content, histone content and the presence of Nanog in the immunoprecipitated chromatin fractions. Different ChIPs are indicated at the top, antibodies used for the different western blot analyses are on the right. (e) Correlation between DNA regions precipitated by modified ChIP and conventional ChIP for H3K4me3, H3K27ac, H3K4me1 or H3K9me3. (f) Overlap of DNA precipitated with modified ChIP for H3K4me3, H3K4me1 or H3K27ac with promoters and enhancers. Number of ChIP-seq reads overlapping with promoters or enhancers is indicated. (g) ChIP-seq tracks for modified ChIP or conventional ChIP for H3K4me3, H3K4me1 or H3K27ac around pluripotency gene Tcfcp2l1. Sequence reads were plotted relative to chromosomal position. Genome location of Tcfcp2l1 is shown, scale bar indicates 5 kb of genome. P indicates promoter, E indicates putative enhancer.
Figure 2
Figure 2. ChIP-MS predicted locations of identified factors and complexes.
Visual representation of factors (small orange circles) and complexes (large orange circles) identified by ChIP-MS for four different histone modifications (blue squares). Thickness of the edges indicates average emPAI score of a factor or complex in histone modification ChIP. Factors and complexes are positioned according to their ChIP-MS location prediction. To the left of the yellow dashed line are predicted enhancer binders, positioned horizontally from weak activity enhancers (left) to strong activity enhancers (right) according to their H3K27ac ratio. To the right of the yellow dashed line are predicted promoter binders positioned vertically from weak activity promoters (bottom) to strong activity promoters (top) according to their H3K27ac ratio. In the left bottom square are factors and complexes predicted to bind heterochromatin.
Figure 3
Figure 3. Validation of ChIP-MS predictions with published genome-wide location information.
(a) Comparison of location prediction by ChIP-MS with location prediction by correlation of genome-wide binding sites with the indicated histone modifications on the genome. Protein factors for which genome-wide locations in mouse ESCs are determined by ChIP-seq are listed on the left, according to their ChIP-MS prediction as promoter binder (top, green panel), enhancer binder (middle, blue panel) or heterochromatin binder (bottom, red panel). Indicated in columns from left to right are: protein factor, its average emPAI values in the different histone modification ChIPs, its H3K27ac ratio (if highest emPAI value⩾0.1), ChIP-MS location prediction, correlation of genome-wide binding sites with the indicated histone modifications and location prediction by highest correlation with a histone modification, according to Fig. 1b. (b) Binding of selected protein factors to promoters and enhancers in mouse ESCs. Heatmaps of 12,913 promoters (upper panel) or 30,564 enhancers (lower panel), centred on H3K4me3 signal (Promoters) or H3K4me1 signal (Enhancers), ranked on H3K27ac content from top to bottom. Displayed is 8 kb around the centre of the promoter or enhancer. Normalized ChIP-seq reads representing the level of H3K4me1, H3K27ac and H3K4me3 histone modifications are indicated in the first three lanes. Normalized ChIP-seq reads representing relative binding intensity to promoters (upper panel) and enhancers (lower panel) of protein factors from a (highest emPAI value ⩾0.1) are displayed in lanes 4–12 and 14–20. Factors are arranged according to binding prediction or Polycomb factor identity. *p300 was not predicted by ChIP-MS but its genome-wide location was included in lane 13 for comparison.
Figure 4
Figure 4. Analyses of genome-wide binding sites of Dppa2.
(a) Comparison of location prediction for Dppa2 by ChIP-MS with location prediction by the correlation of identified Dppa2 genome-wide binding sites with the indicated histone modifications on the genome. Indicated in the upper panel from left to right are: Dppa2 average emPAI values in the different histone modification ChIPs, its H3K27ac ratio and ChIP-MS location prediction. Indicated in the lower panel from left to right are: the correlation of Dppa2 genome-wide binding sites with the indicated histone modifications and location prediction by highest correlation with a histone modification, according to Fig. 1b. (b) Binding of Dppa2 to the promoters of the indicated genes, detected by anti-V5 ChIP on V5-Dppa2-expressing ESCs or control ESCs. Precipitated DNA for the indicated genes is shown as percentage of input, the Amylase gene is used as a negative control region. (c) Localization of Dppa2 on the promoter of Syce1 (upper panel) or Nkx25 (lower panel). Sequence reads from anti-V5 ChIP-seq on V5-Dppa2-expressing ESCs (Dppa2) or control ESCs (Control) were plotted relative to chromosomal position. Genome locations of Syce1 gene (upper panel) and Nkx25 gene (lower panel) are shown, scale bars indicate 1 kb of genome. (d) Binding of Dppa2 to promoters and enhancers in mouse ESCs. Heatmaps of 12,913 promoters (left panel) or 30,564 enhancers (right panel), centred on H3K4me3 signal (Promoters) or H3K4me1 signal (Enhancers), ranked on H3K27ac content from top to bottom. Displayed is 8 kb around the centre of the promoter or enhancer. Normalized ChIP-seq reads representing the level of H3K4me1, H3K27ac and H3K4me3 histone modifications are indicated in the first three lanes. Normalized V5-Dppa2 ChIP-seq reads representing the relative binding intensity of Dppa2 to promoters (left panel) and enhancers (right panel) are displayed in the fourth lane of each panel. (e) Distribution of absolute expression levels of H3K4me3 marked genes in mouse ESCs that (from left to right) are bound at the promoter by Dppa2, all genes, and bound within 20 kb around the promoter by Oct4. Shown is a violin plot where the white dot indicates the median and the thick black bar indicates 50% of the genes. Log2 value of the absolute expression, derived from published RNAseq data, the number of genes in each category and P-values by Mann–Whitney test are indicated.
Figure 5
Figure 5. Dppa2 target genes and their overlap with the pluripotency network.
(a) Bubble plot indicating the positions of Dppa2-binding sites relative to the transcription start site (TSS) on genes that are either upregulated ⩾2-fold (upper part) or downregulated ⩾2-fold (lower part) upon Dppa2 gene knockout in mouse ESCs. Log2 of the fold change in expression upon Dppa2 KO is indicated on the y-axis. Distance of Dppa2-binding sites from the TSS is indicated on the x-axis. Size of the bubbles correlates with fold difference of Dppa2 ChIP peak over control. (b) Bar diagram showing the total number of upregulated and downregulated genes upon Dppa2 knockout and the number of these genes bound by Dppa2 within 1 kb from the TSS (grey areas). The number of Dppa2 bound genes is also indicated as a percentage of the total number of upregulated or downregulated genes. (c) Distribution of absolute expression levels in mouse ESCs of Dppa2 target genes and Oct4 target genes. Dppa2 target genes are bound by Dppa2 within 1 kb of the TSS and ⩾2-fold downregulated upon Dppa2 knockout, Oct4 target genes are bound by Oct4 within 20 kb of the TSS and ⩾2-fold downregulated after 24 h of Oct4 depletion. Shown is a violin plot where the white dot indicates the median and the thick black bar indicates 50% of the genes. Log2 of the absolute expression, derived from published RNAseq data and P-value by Mann–Whitney test are indicated. (d) Distribution of the fold change in expression of Dppa2 target genes and Oct4 target genes in the differentiated tissue with the highest expression versus expression in mouse ESCs. Shown is a violin plot where the white dot indicates the median and the thick black bar indicates 50% of the genes. Log2 of the fold change in expression, derived from published RNAseq data and P-value by Mann–Whitney test are indicated. (e) Lists of tissues or cells where Dppa2 target genes (left panel) or Oct4 target genes (right panel) are highest expressed. Tissue or cells, the number of genes (N) and fold enrichment (FE) of a tissue/cell type within Dppa2 target genes or Oct4 target genes are indicated. The 20 tissues/cells with the highest number of gene overlap and fold enrichment are shown. (f) Venn diagram showing the overlap of genomic binding sites in mouse ESCs of Dppa2, Nanog, Oct4 and Esrrb. (g) Venn diagram showing the lack of overlap of Dppa2 target genes and Oct4 target genes.

References

    1. Mouse E. C. et al.. An encyclopedia of mouse DNA elements (Mouse ENCODE). Genome Biol. 13, 418 (2012). - PMC - PubMed
    1. Consortium, E.P.. et al.. An integrated encyclopedia of DNA elements in the human genome. Nature 489, 57–74 (2012). - PMC - PubMed
    1. Chen X. et al.. Integration of external signaling pathways with the core transcriptional network in embryonic stem cells. Cell 133, 1106–1117 (2008). - PubMed
    1. Takahashi K. & Yamanaka S. Induction of pluripotent stem cells from mouse embryonic and adult fibroblast cultures by defined factors. Cell 126, 663–676 (2006). - PubMed
    1. Soufi A., Donahue G. & Zaret K. S. Facilitators and impediments of the pluripotency reprogramming factors' initial engagement with the genome. Cell 151, 994–1004 (2012). - PMC - PubMed

Publication types

MeSH terms