. 2015 May 20:15:123.
doi: 10.1186/s12870-015-0500-y.

OsTCTP, encoding a translationally controlled tumor protein, plays an important role in mercury tolerance in rice

Affiliations

OsTCTP, encoding a translationally controlled tumor protein, plays an important role in mercury tolerance in rice

Zhan Qi Wang et al. BMC Plant Biol. .

Abstract

Background: Mercury (Hg) is not only a threat to public health but also a growth risk factor to plants, as it is readily accumulated by higher plants. Accumulation of Hg in plants disrupts many cellular-level functions and inhibits growth and development; however, the detoxification and tolerance mechanisms of plants to Hg stress are still not fully understood. Exposure to toxic Hg also occurs in some crops cultivated under anoxic conditions, such as rice (Oryza sativa L.), a model organism and one of the most important cultivated plants worldwide. In this study, we functionally characterized a rice translationally controlled tumor protein gene (Os11g43900, OsTCTP) involved in Hg stress tolerance.

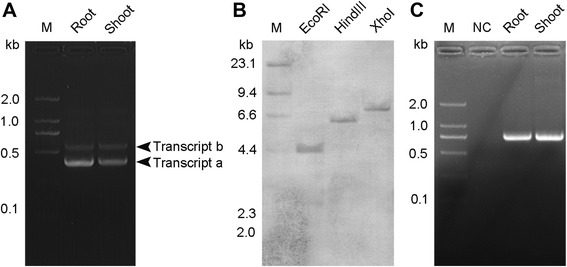
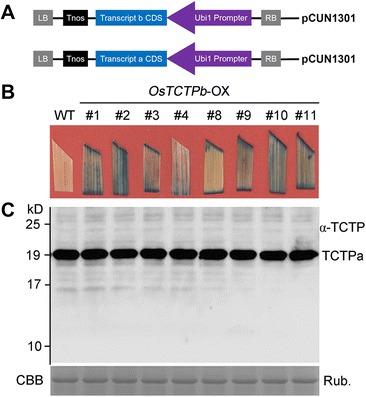
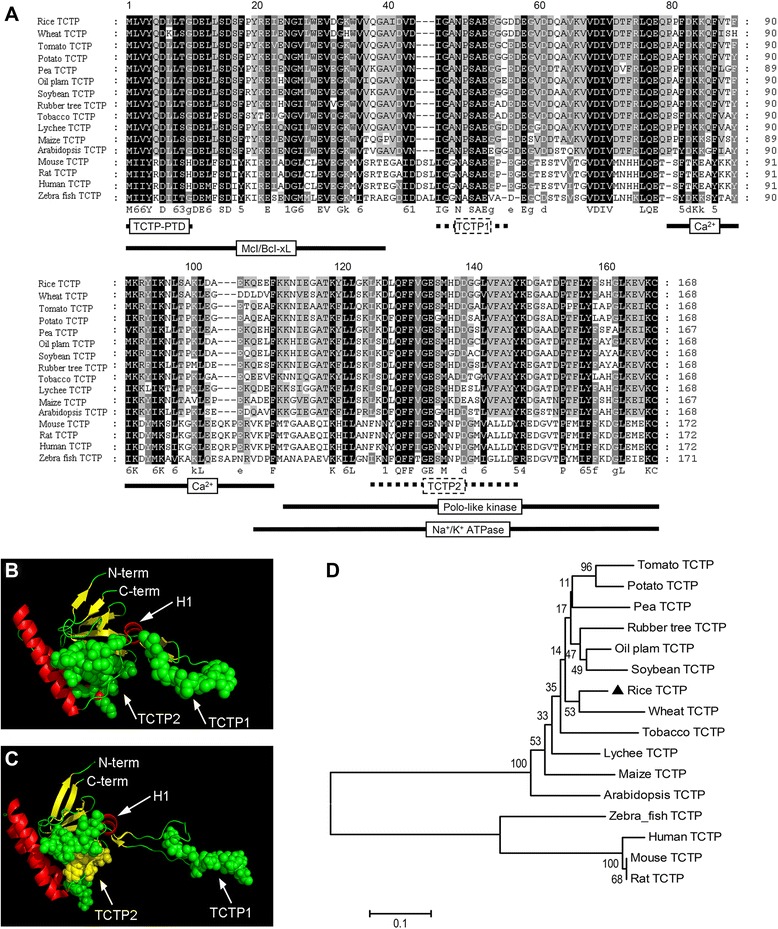
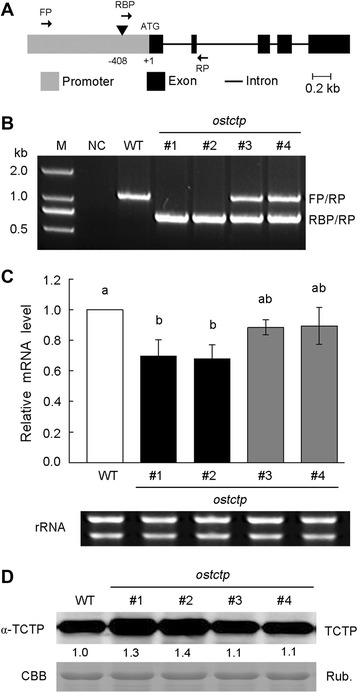
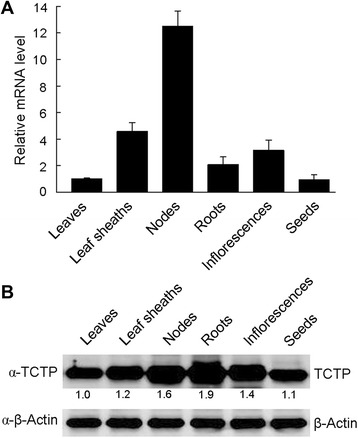
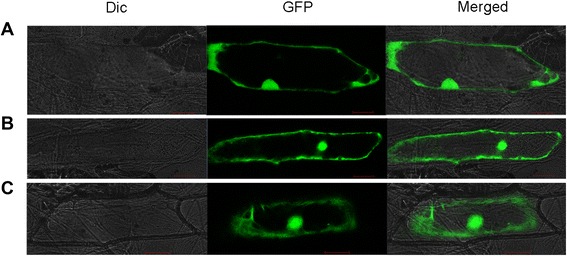
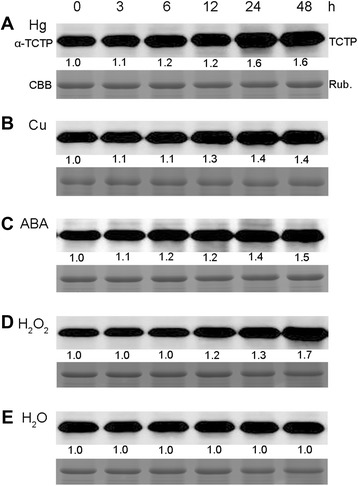
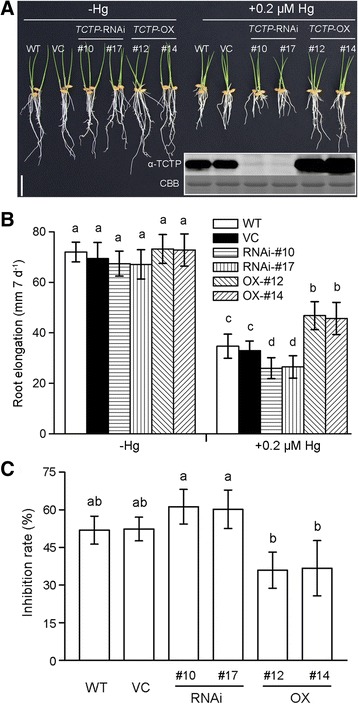
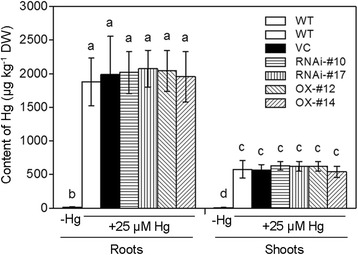
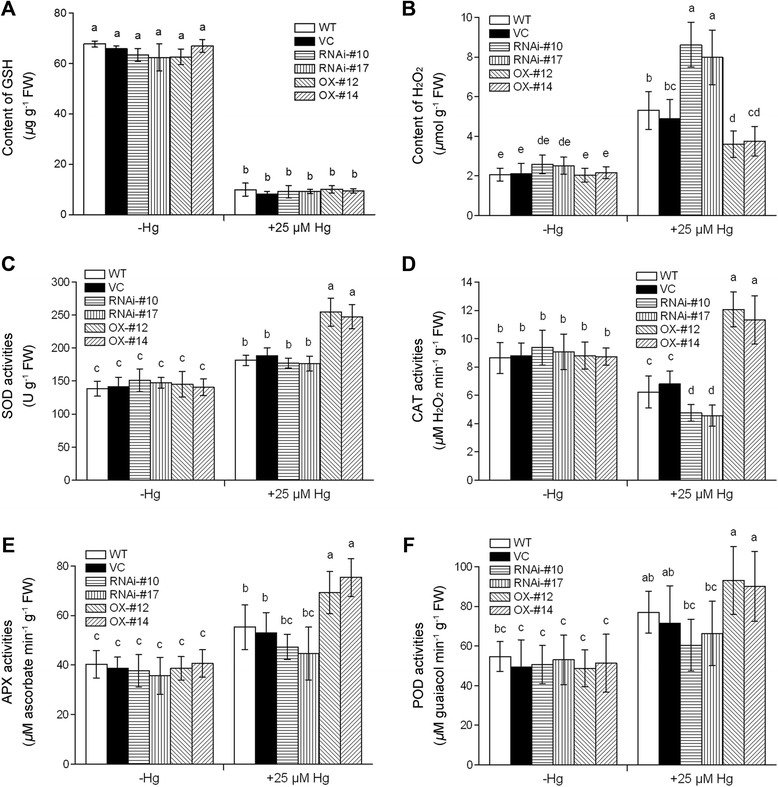
Results: OsTCTP was ubiquitously expressed in all examined plant tissues, especially in actively dividing and differentiating tissues, such as roots and nodes. OsTCTP was found to localize both the cytosol and the nucleus. OsTCTP was induced by mercuric chloride, cupric sulfate, abscisic acid, and hydrogen peroxide at the protein level in a time-dependent manner. Overexpression of OsTCTP potentiated the activities of several antioxidant enzymes, reduced the Hg-induced H2O2 levels, and promoted Hg tolerance in rice, whereas knockdown of OsTCTP produced opposite effects. And overexpression of OsTCTP did not prevent Hg absorption and accumulation in rice. We also demonstrated that Asn 48 and Asn 97 of OsTCTP amino acids were not the potential N-glycosylation sites.

Conclusions: Our results suggest that OsTCTP is capable of decreasing the Hg-induced reactive oxygen species (ROS), therefore, reducing the damage of ROS and enhancing the tolerance of rice plants to Hg stress. Thus, OsTCTP is a valuable gene for genetic engineering to improve rice performance under Hg contaminated paddy soils.


Figures

Figure 1
Figure 1
Genomic organization and alternative splicing of OsTCTP. (A) RT-PCR analysis using a primer pair covering the differentiated regions of the OsTCTPa and OsTCTPb cDNAs. The root and shoot mRNAs from cv. ‘Nipponbare’ were used for RT-PCR. (B) Southern blot analysis of the OsTCTP gene. Total DNA from cv. ‘Nipponbare’ (30 μg for each lane) was digested individually with EcoRI, HindIII and XhoI and hybridized with a gene-specific probe covering the region from nucleotide 513 to the 3’ end of the OsTCTPa cDNA. (C) Genomic PCR analysis using two primers covering the differentiated regions of the OsTCTPa and OsTCTPb. The leaf DNA from cv. ‘Nipponbare’ was used for genomic PCR. M, DNA size markers.
Figure 2
Figure 2
OsTCTP expression patterns in transgenic rice plants. (A) Structure of constructs for rice transformation. The overexpression constructs (OsTCTPa and OsTCTPb) were developed under the control of the Ubi1 promoter and nopaline synthase (Nos) terminator cassette. (B) GUS staining of OsTCTPb overexpression transgenic rice plants. (C) Western blot analysis of OsTCTP protein from transgenic plants using an antibody against rice OsTCTP. Equal amounts (20 μg) were loaded to each lane and confirmed by coomassie brilliant blue (CBB) staining of Rubisco (bottom). The experiments were repeated for three times with similar results.
Figure 3
Figure 3
Sequence comparison, structural modeling and phylogenetic analysis of TCTP. (A) The amino acid sequence alignment was performed using the ClustalW2 software on representative plant and nonplant sequences. Positions with strictly conserved amino acids are highlighted in black, conserved substitutions in dark gray, and blocks of similar residues in light gray. Domains identified for nonplant TCTPs (Mcl/Bcl-xL interaction [42], Polo kinase interaction [43], Na+/K+ ATPase interaction [44], Ca2+ binding [45], TCTP self-interaction [46] and protein transduction domain [47]) are indicated by black lines and the TCTP signature by a dotted line. (B) The putative 3D structure of the OsTCTP. The structure of the OsTCTP protein was modeled using the known structure of the human TCTP (PDB ID 2HR9, http://www.rcsb.org) as a template on the Swiss-Model server (http://swissmodel.expasy.org [73]). The model obtained for the rice protein (b) shows high similarity when compared with the structure of the human protein (C). The conserved domains TCTP1 and TCTP2 of TCTP proteins are shown as calottes. The conserved helix (H1) is marked by an arrow. Helices, β-sheets, and coil regions of the two structures are represented in red, yellow, and green, respectively. (D) Phylogenetic analysis of OsTCTP and its 15 close homologs. The numbers under the branches refer to the bootstrap value of the neighbor-joining phylogenetic tree. The length of the branches is proportional to the amino acid variation rates. The scale bar indicates the number of amino acid substitutions per site.
Figure 4
Figure 4
OsTCTP expression patterns in ostctp mutant plants. (A) Gene structure of OsTCTP. Gray box is the promoter region; Block boxes indicate exons in coding region; lines connecting boxes are introns. Triangles are T-DNA insertions of ostctp. Arrows FP, RP, and RBP are primers used for genotyping ostctp. (B) PCR analysis of genotyping of mutant ostctp. FP, RP, and RBP are primers used for genotyping ostctp. (C) qRT-PCR analysis of OsTCTP mRNA level in mutant ostctp. Histone H3 was used as an internal standard and data are given as means ± SD of three biological replicates. Means with different letters are significantly different (P < 0.05, Tukey’s test). (D) Western blot analysis of OsTCTP protein from mutant ostctp using an antibody against rice OsTCTP. Equal amounts (20 μg) were loaded to each lane and were confirmed by coomassie brilliant blue (CBB) staining of Rubisco (bottom). The experiments were repeated for three times with similar results. Quantitative assessment was processed by Quantity One® Software (http://www.bio-rad.com).
Figure 5
Figure 5
qRT-PCR and western blot analyses of OsTCTP in wild-type rice plants. (A) qRT-PCR analysis of OsTCTP mRNA level in wild-type rice plants. HistoneH3 was used as an internal standard and data are given as means ± SD of three biological replicates. Means with different letters are significantly different (P < 0.05, Tukey’s test). (B) Western blot analysis of OsTCTP protein from wild-type rice plants using an antibody against rice OsTCTP. Equal amounts (20 μg) were loaded to each lane and β-actin was used as an internal standard. The experiments were repeated for three times with similar results. Quantitative assessment was processed by Quantity One® Software (http://www.bio-rad.com).
Figure 6
Figure 6
Subcellular localization of OsTCTP. (A) GFP protein localization in onion epidermal cells. (B) OsTCTP-GFP fusion protein localization in onion epidermal cells. (C) Plasmolysed cell transformed with OsTCTP-GFP fusion protein. Dic, bright field images; GFP, GFP fluorescence; and Merged, merged image. Scale bars =100 μm.
Figure 7
Figure 7
Protein accumulation profiles of OsTCTP under Hg, Cu, ABA and H2O2 treatments. Western blot analysis of OsTCTP accumulation under different stress conditions. Hydroponically grown 2-week-old rice plants were transferred to solutions containing 25 μM Hg (A), 50 μM Cu (B), 50 μM ABA (C), 100 mM H2O2 (D), or water (H2O, E) for the time periods indicated. Equal amounts (20 μg) were loaded to each lane and were confirmed by coomassie brilliant blue (CBB) staining of Rubisco (bottom). Numbers under lanes in (A–E) indicate relative band intensities that were quantified and normalized the controls (0 hour) for each panel. Quantitative assessment was processed by Quantity One® Software (http://www.bio-rad.com). The experiments were repeated for three times with similar results.
Figure 8
Figure 8
Phenotypic analysis of the wild type (WT), vector control (VC), OsTCTP-OX and OsTCTP-RNAi transgenic rice plants. (A) Hg tolerance of WT (cv. Nipponbare), VC (vector control), OsTCTP-RNAi (#10 and #17) and OsTCTP-OX (#12 and #14). Germinated seeds were exposed to 0.5 mM CaCl2 solution (pH 5.5) containing 0 or 0.2 μM HgCl2 for 7 days. Scale bar = 2 cm. (B) Root length of WT (cv. Nipponbare), VC (vector control), OsTCTP-RNAi (#10 and #17) and OsTCTP-OX (#12 and #14). Root length was measured before and after the treatment. (C) The inhibition rate was defined as [1 – (the ratio of the root elongated of the plants receiving Hg treatment to that of the no-Hg control) × 100%]. For (B) and (C), data are given as means ± SD (n = 10). Means with different letters are significantly different (P < 0.05, Tukey’s test).
Figure 9
Figure 9
Mercury concentrations in roots or leaves of the wild type (WT), vector control (VC), OsTCTP-OX and OsTCTP-RNAi transgenic rice seedlings under 25 μM HgCl2 treatment for 3 days. Data are given as the mean ± SD of three biological replicates. Means with different letters are significantly different (P < 0.05, Tukey’s test).
Figure 10
Figure 10
Analysis of GSH content, H2O2 level and antioxidant enzyme activities in roots of the wild type (WT), vector control (VC), OsTCTP-OX and OsTCTP-RNAi transgenic rice plants. (A) The total GSH content in roots of WT (cv. ‘Nipponbare’), VC (vector control), OsTCTP-RNAi (#10 and #17) and OsTCTP-OX (#12 and #14). (B) The H2O2 levels in roots of WT (cv. ‘Nipponbare’), VC (vector control), OsTCTP-RNAi (#10 and #17) and OsTCTP-OX (#12 and #14). (C) Superoxide dismutase (SOD) activity. (D) Catalase (CAT) activity. (E) Ascorbate peroxidase (APX) activity. (F) Peroxidase (POD) activity. Data are given as means ± SD of three biological replicates. Means with different letters are significantly different (P < 0.05, Tukey’s test).

References

    1. Carrasco-Gil S, Siebner H, Leduc DL, Webb SM, Millán R, Andrews JC, et al. Mercury localization and speciation in plants grown hydroponically or in a natural environment. Environ Sci Technol. 2013;47(7):3082–90. - PubMed
    1. Tchounwou PB, Ayensu WK, Ninashvili N, Sutton D. Environmental exposure to mercury and its toxicopathologic implications for public health. Environ Toxicol. 2003;18(3):149–75. doi: 10.1002/tox.10116. - DOI - PubMed
    1. Chen J, Yang ZM. Mercury toxicity, molecular response and tolerance in higher plants. Biometals. 2012;25(5):847–57. doi: 10.1007/s10534-012-9560-8. - DOI - PubMed
    1. Israr M, Sahi S, Datta R, Sarkar D. Bioaccumulation and physiological effects of mercury in Sesbania drummondii. Chemosphere. 2006;65(4):591–8. doi: 10.1016/j.chemosphere.2006.02.016. - DOI - PubMed
    1. Ruiz ON, Alvarez D, Torres C, Roman L, Daniell H. Metallothionein expression in chloroplasts enhances mercury accumulation and phytoremediation capability. Plant Biotechnol J. 2011;9(5):609–17. doi: 10.1111/j.1467-7652.2011.00616.x. - DOI - PMC - PubMed

Publication types

MeSH terms