

A new GWAS and meta-analysis with 1000Genomes imputation identifies novel risk variants for colorectal cancer
- PMID: 25990418
- PMCID: PMC4438486
- DOI: 10.1038/srep10442
A new GWAS and meta-analysis with 1000Genomes imputation identifies novel risk variants for colorectal cancer
Erratum in
-
Erratum: A new GWAS and meta-analysis with 1000Genomes imputation identifies novel risk variants for colorectal cancer.Sci Rep. 2015 Aug 3;5:12372. doi: 10.1038/srep12372. Sci Rep. 2015. PMID: 26237130 Free PMC article. No abstract available.
Abstract
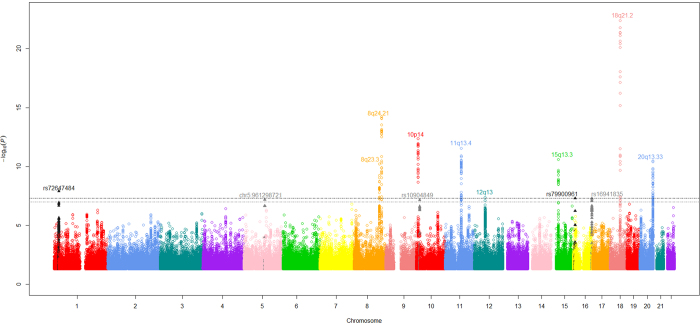
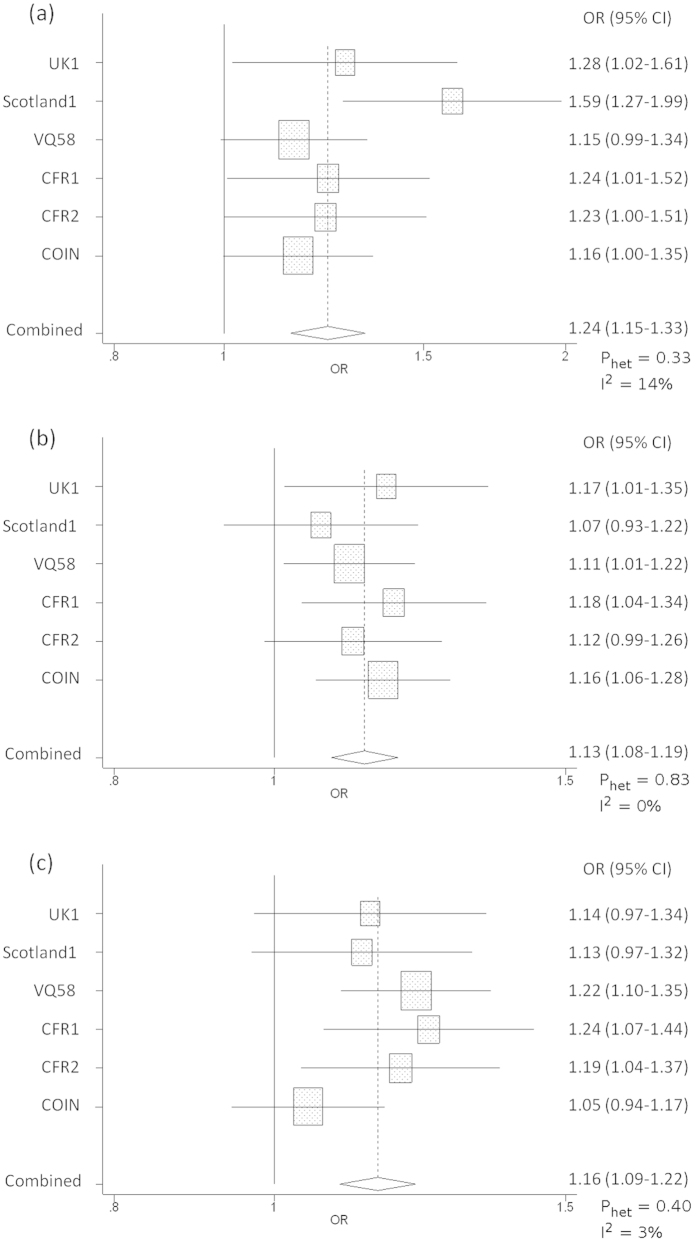
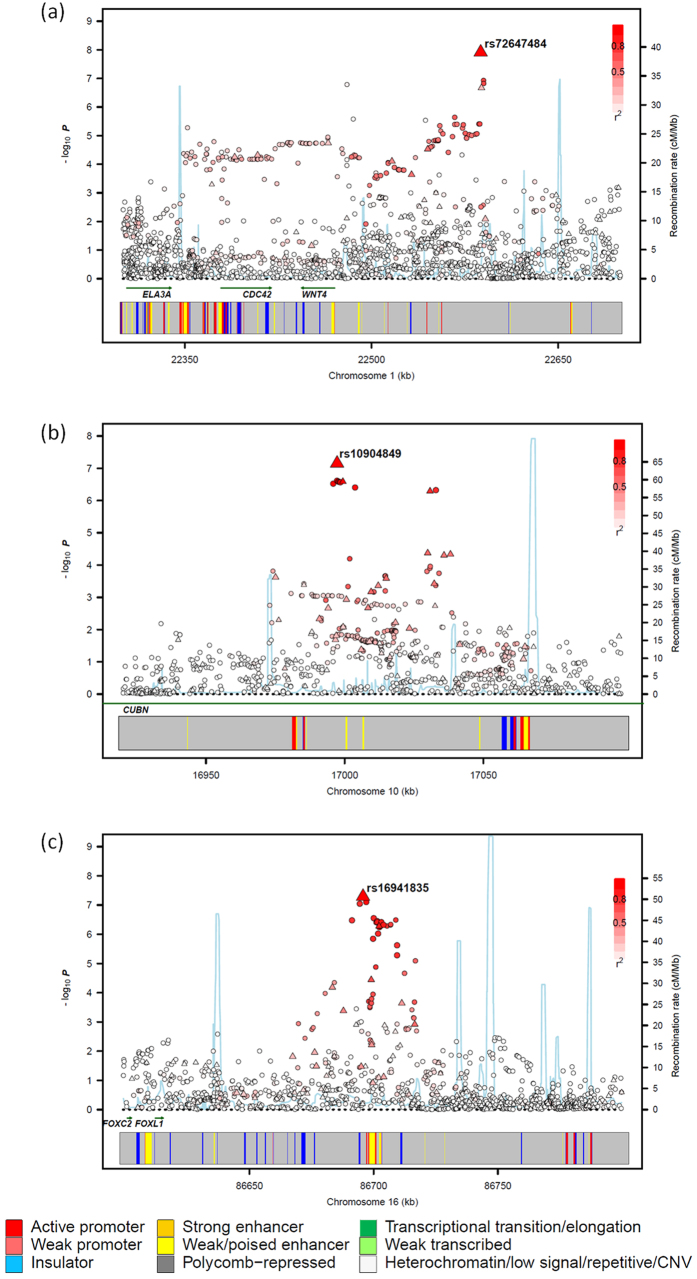
Genome-wide association studies (GWAS) of colorectal cancer (CRC) have identified 23 susceptibility loci thus far. Analyses of previously conducted GWAS indicate additional risk loci are yet to be discovered. To identify novel CRC susceptibility loci, we conducted a new GWAS and performed a meta-analysis with five published GWAS (totalling 7,577 cases and 9,979 controls of European ancestry), imputing genotypes utilising the 1000 Genomes Project. The combined analysis identified new, significant associations with CRC at 1p36.2 marked by rs72647484 (minor allele frequency [MAF] = 0.09) near CDC42 and WNT4 (P = 1.21 × 10(-8), odds ratio [OR] = 1.21 ) and at 16q24.1 marked by rs16941835 (MAF = 0.21, P = 5.06 × 10(-8); OR = 1.15) within the long non-coding RNA (lncRNA) RP11-58A18.1 and ~500 kb from the nearest coding gene FOXL1. Additionally we identified a promising association at 10p13 with rs10904849 intronic to CUBN (MAF = 0.32, P = 7.01 × 10(-8); OR = 1.14). These findings provide further insights into the genetic and biological basis of inherited genetic susceptibility to CRC. Additionally, our analysis further demonstrates that imputation can be used to exploit GWAS data to identify novel disease-causing variants.
Figures
References
-
- Lichtenstein P. et al. Environmental and heritable factors in the causation of cancer--analyses of cohorts of twins from Sweden, Denmark, and Finland. N. Engl. J. Med. 343, 78–85 (2000). - PubMed
-
- Aaltonen L., Johns L., Jarvinen H., Mecklin J. P. & Houlston R. Explaining the familial colorectal cancer risk associated with mismatch repair (MMR)-deficient and MMR-stable tumors. Clin. Cancer Res. 13, 356–361 (2007). - PubMed
-
- Lubbe S. J., Webb E. L., Chandler I. P. & Houlston R. S. Implications of familial colorectal cancer risk profiles and microsatellite instability status. J. Clin. Oncol. 27, 2238–2244 (2009). - PubMed
-
- Broderick P. et al. A genome-wide association study shows that common alleles of SMAD7 influence colorectal cancer risk. Nat. Genet. 39, 1315–1317 (2007). - PubMed
Publication types
MeSH terms
Substances
Grants and funding
- G1001799/MRC_/Medical Research Council/United Kingdom
- U01/U24 CA074799/CA/NCI NIH HHS/United States
- MC_UU_12023/20/MRC_/Medical Research Council/United Kingdom
- MC_U122861325/MRC_/Medical Research Council/United Kingdom
- U24 CA074806/CA/NCI NIH HHS/United States
- MR/N01104X/1/MRC_/Medical Research Council/United Kingdom
- 13154/CRUK_/Cancer Research UK/United Kingdom
- U01 CA097735/CA/NCI NIH HHS/United States
- WT_/Wellcome Trust/United Kingdom
- U24 CA074799/CA/NCI NIH HHS/United States
- U01 CA074800/CA/NCI NIH HHS/United States
- 15116/CRUK_/Cancer Research UK/United Kingdom
- U01 CA074799/CA/NCI NIH HHS/United States
- MC_PC_U127527198/MRC_/Medical Research Council/United Kingdom
- U24 CA074783/CA/NCI NIH HHS/United States
- 12076/CRUK_/Cancer Research UK/United Kingdom
- 16459/CRUK_/Cancer Research UK/United Kingdom
- U24 CA074794/CA/NCI NIH HHS/United States
- U24 CA097735/CA/NCI NIH HHS/United States
- U01 CA074794/CA/NCI NIH HHS/United States
- R01 CA143237/CA/NCI NIH HHS/United States
- G0701770/MRC_/Medical Research Council/United Kingdom
- MR/K018647/1/MRC_/Medical Research Council/United Kingdom
- MC_UU_12023/3/MRC_/Medical Research Council/United Kingdom
- U01/U24 CA074783/CA/NCI NIH HHS/United States
- U01/U24 CA074794/CA/NCI NIH HHS/United States
- 090532/Z/09/Z/WT_/Wellcome Trust/United Kingdom
- C348/A12076/CRUK_/Cancer Research UK/United Kingdom
- UM1 CA167551/CA/NCI NIH HHS/United States
- U01 CA122839/CA/NCI NIH HHS/United States
- U01 CA074783/CA/NCI NIH HHS/United States
- 20240/CRUK_/Cancer Research UK/United Kingdom
- U01/U24 CA097735/CA/NCI NIH HHS/United States
- U01 CA074806/CA/NCI NIH HHS/United States
- U24 CA074800/CA/NCI NIH HHS/United States
- U01/U24 CA074806/CA/NCI NIH HHS/United States
- C1298/A8362/CRUK_/Cancer Research UK/United Kingdom
- U01/U24 CA074800/CA/NCI NIH HHS/United States
LinkOut - more resources
Full Text Sources
Other Literature Sources
Medical
Miscellaneous
