

A low-latency, big database system and browser for storage, querying and visualization of 3D genomic data
- PMID: 25990738
- PMCID: PMC4652742
- DOI: 10.1093/nar/gkv476
A low-latency, big database system and browser for storage, querying and visualization of 3D genomic data
Abstract
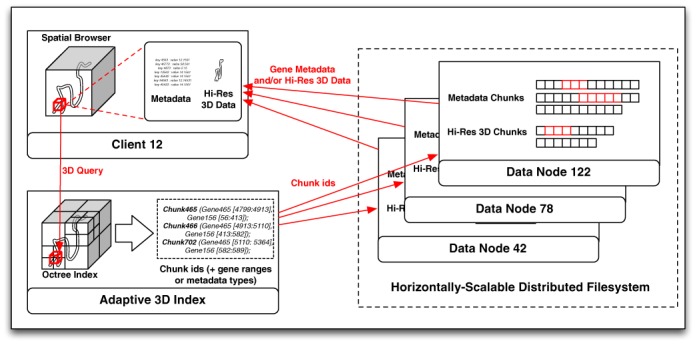
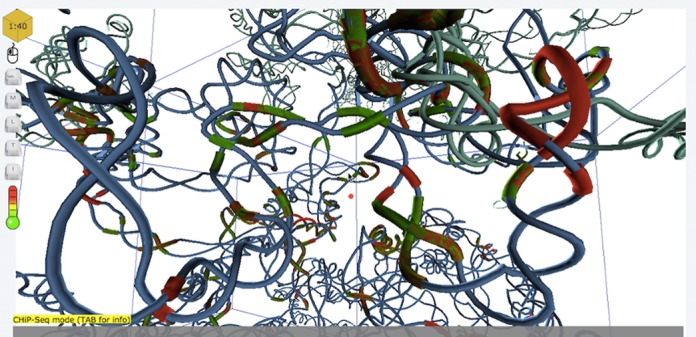
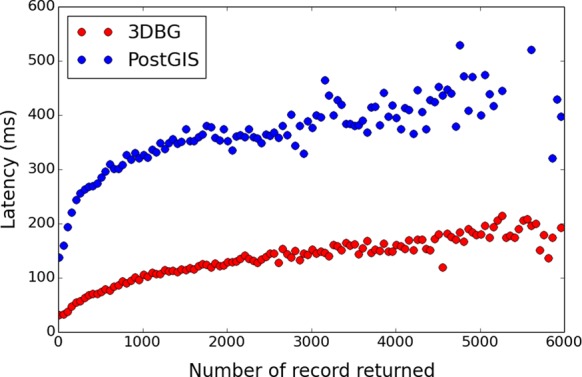
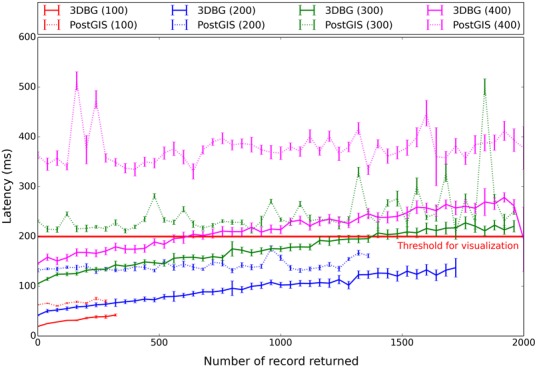
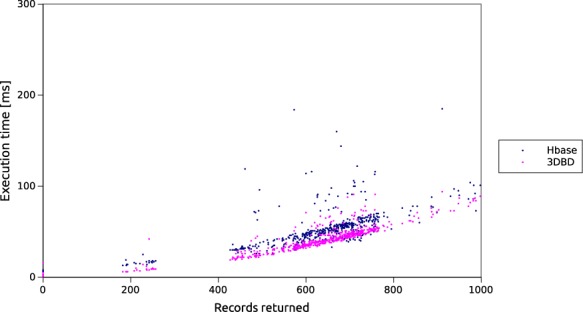
Recent releases of genome three-dimensional (3D) structures have the potential to transform our understanding of genomes. Nonetheless, the storage technology and visualization tools need to evolve to offer to the scientific community fast and convenient access to these data. We introduce simultaneously a database system to store and query 3D genomic data (3DBG), and a 3D genome browser to visualize and explore 3D genome structures (3DGB). We benchmark 3DBG against state-of-the-art systems and demonstrate that it is faster than previous solutions, and importantly gracefully scales with the size of data. We also illustrate the usefulness of our 3D genome Web browser to explore human genome structures. The 3D genome browser is available at http://3dgb.cs.mcgill.ca/.
© The Author(s) 2015. Published by Oxford University Press on behalf of Nucleic Acids Research.
Figures
References
-
- Lander E.S., Linton L.M., Birren B., Nusbaum C., Zody M.C., Baldwin J., Devon K., Dewar K., Doyle M., FitzHugh W., et al. Initial sequencing and analysis of the human genome. Nature. 2001;409:860–921. - PubMed
-
- Venter J.C., Adams M.D., Myers E.W., Li P.W., Mural R.J., Sutton G.G., Smith H.O., Yandell M., Evans C.A., Holt R.A., et al. The sequence of the human genome. Science. 2001;291:1304–1351. - PubMed
Publication types
MeSH terms
Grants and funding
LinkOut - more resources
Full Text Sources
Other Literature Sources
