. 2015 Nov;115(5):426-36.
doi: 10.1038/hdy.2015.42. Epub 2015 May 20.

Properties of different selection signature statistics and a new strategy for combining them

Affiliations

Properties of different selection signature statistics and a new strategy for combining them

Y Ma et al. Heredity (Edinb). 2015 Nov.

Abstract

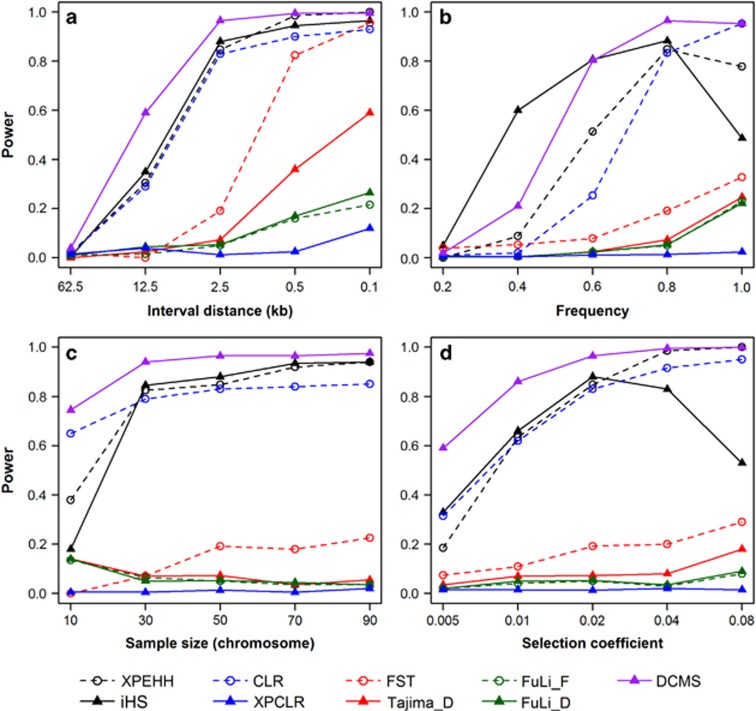
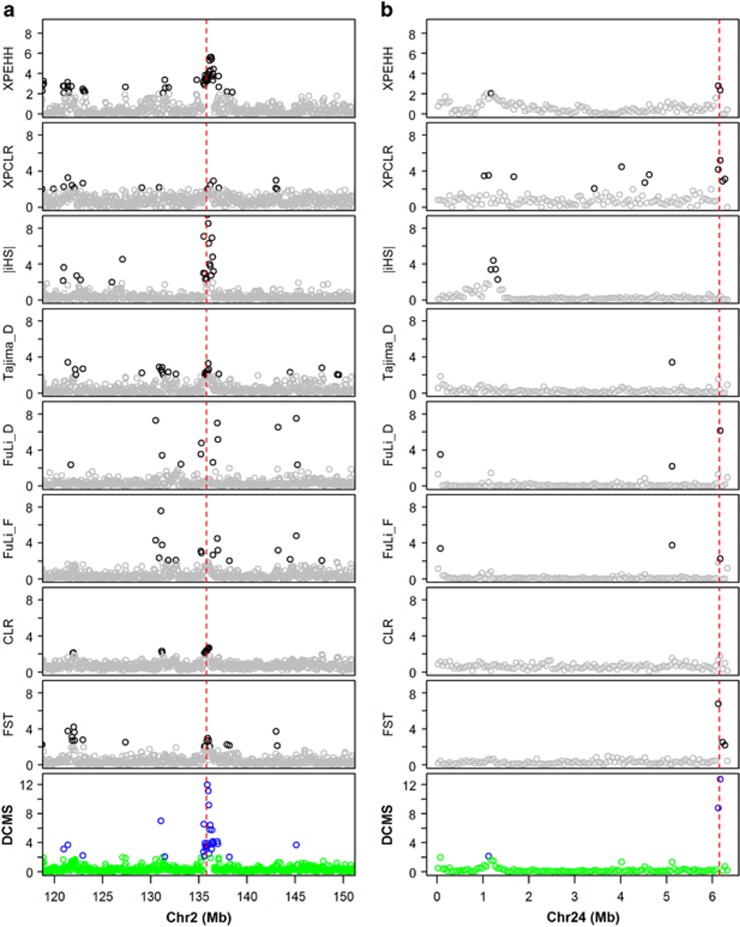
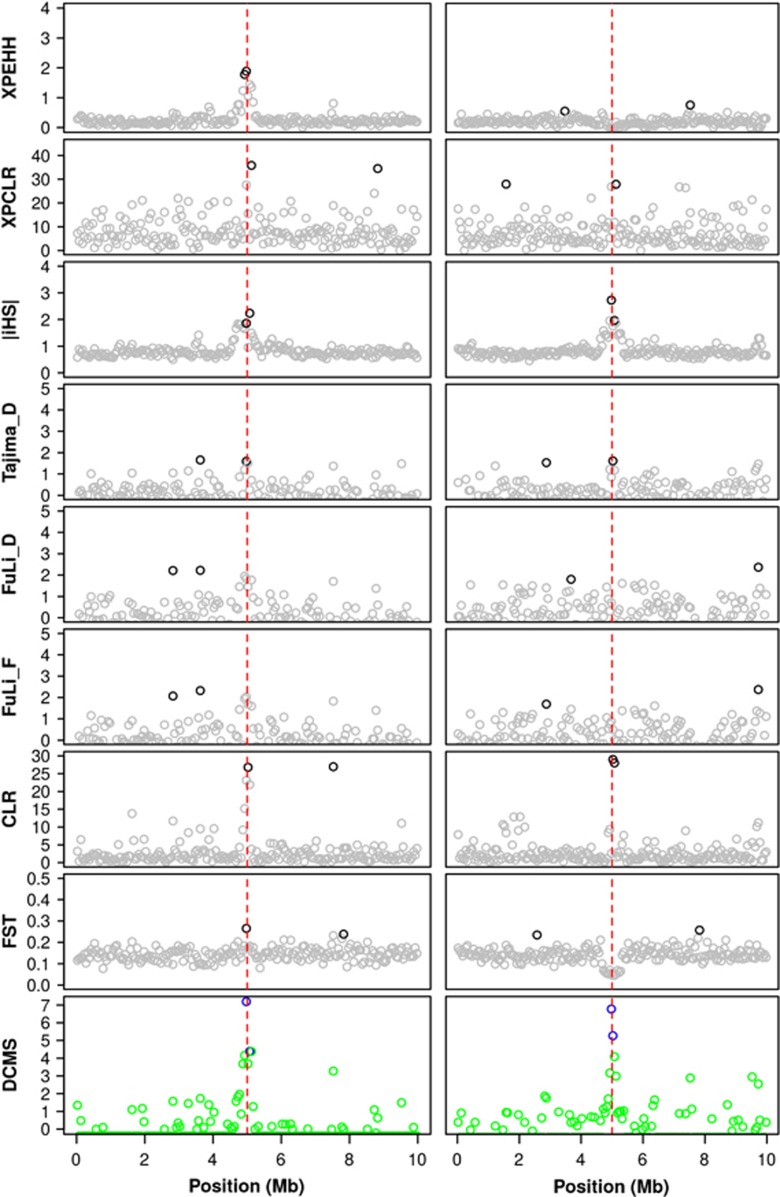
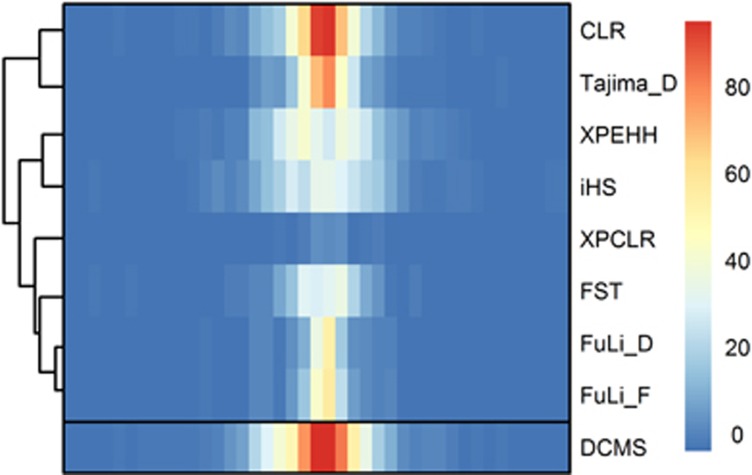
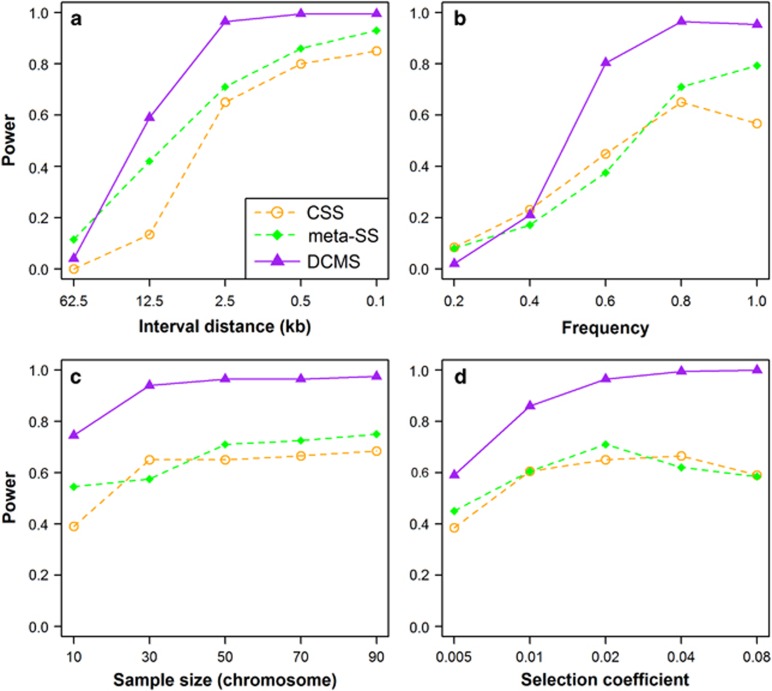
Identifying signatures of recent or ongoing selection is of high relevance in livestock population genomics. From a statistical perspective, determining a proper testing procedure and combining various test statistics is challenging. On the basis of extensive simulations in this study, we discuss the statistical properties of eight different established selection signature statistics. In the considered scenario, we show that a reasonable power to detect selection signatures is achieved with high marker density (>1 SNP/kb) as obtained from sequencing, while rather small sample sizes (~15 diploid individuals) appear to be sufficient. Most selection signature statistics such as composite likelihood ratio and cross population extended haplotype homozogysity have the highest power when fixation of the selected allele is reached, while integrated haplotype score has the highest power when selection is ongoing. We suggest a novel strategy, called de-correlated composite of multiple signals (DCMS) to combine different statistics for detecting selection signatures while accounting for the correlation between the different selection signature statistics. When examined with simulated data, DCMS consistently has a higher power than most of the single statistics and shows a reliable positional resolution. We illustrate the new statistic to the established selective sweep around the lactase gene in human HapMap data providing further evidence of the reliability of this new statistic. Then, we apply it to scan selection signatures in two chicken samples with diverse skin color. Our analysis suggests that a set of well-known genes such as BCO2, MC1R, ASIP and TYR were involved in the divergent selection for this trait.


Figures

Figure 1
Figure 1
Power of eight different selection signature test statistics and the novel combining strategy when varying four different parameters: (a) Marker interval distance; (b) frequency of the selected allele; (c) sample size; (d) selection coefficient. The selected scenarios in simulation data were treated as observed population in all methods and the neutral (or no selection) scenarios was treated as reference population when the between-population was performed.
Figure 2
Figure 2
Selection signature detected by DCMS in (a) Chromosome 2 in human HapMap data in the analysis of the CEU population vs the ASW population, (b) Chromosome 24 in the comparison of yellow skin vs white skin populations. The y axis reflects the −log (P-values). The red dashed line in (a) marks the location of the LCT gene in the human genome, and the red dashed line in (b) marks the location of the BCO2 gene in the chicken genome. The deep-colored symbols represent the P-value of statistical scores for each statistic less than 1%.
Figure 3
Figure 3
Observed values of the eight test statistics and the combining strategy in two replicates of the simulated reference scenario. The red dashed lines indicate the position of the SNP under selection. In the left column, the statistic was calculated between the selected population and a no selection population (Sel vs noSel), while in the right column, both populations were under selection (Sel_1 vs Sel_2). The deep colored symbols represent the top 1% quantile of statistical scores for each statistic.
Figure 4
Figure 4
Heat map of the empirical power (in per cent) of eight different selection signature test statistics and the novel combining strategy in 50 kb intervals. The simulated scenario was s=0.02, N=50, d=0.1 kb and P=1.0 (for |iHS|, P=0.8). The middle of this graph indicates the position of the SNP under selection. The clustering of the test statistics is indicated on the left margin for eight used methods.
Figure 5
Figure 5
Comparison of the novel combing strategy DCMS and alternative combining methods CSS (Randhawa et al., 2014) and meta-SS (Utsunomiya et al., 2013) when varying four different parameters: (a) Marker interval distance; (b) frequency of the selected allele; (c) sample size; (d) selection coefficient.

References

    1. Andersson L, Georges M. (2004). Domestic-animal genomics: deciphering the genetics of complex traits. Nat Rev Genet 5: 202–212. - PubMed
    1. Anno S, Ohshima K, Abe T. (2010). Approaches to understanding adaptations of skin color variation by detecting gene-environment interactions. Expert Rev Mol Diagn 10: 987–991. - PubMed
    1. Bersaglieri T, Sabeti PC, Patterson N, Vanderploeg T, Schaffner SF, Drake JA et al. (2004). Genetic signatures of strong recent positive selection at the lactase gene. Am J Hum Genet 74: 1111–1120. - PMC - PubMed
    1. Browning BL, Browning SR. (2009). A unified approach to genotype imputation and haplotype-phase inference for large data sets of trios and unrelated individuals. Am J Hum Genet 84: 210–223. - PMC - PubMed
    1. Chen H, Patterson N, Reich D. (2010). Population differentiation as a test for selective sweeps. Genome Res 20: 393–402. - PMC - PubMed

Publication types