. 2015 May 19;8(377):ra49.
doi: 10.1126/scisignal.2005596.

The catalytic activity of the kinase ZAP-70 mediates basal signaling and negative feedback of the T cell receptor pathway

Affiliations

The catalytic activity of the kinase ZAP-70 mediates basal signaling and negative feedback of the T cell receptor pathway

Hanna Sjölin Goodfellow et al. Sci Signal. .

Abstract

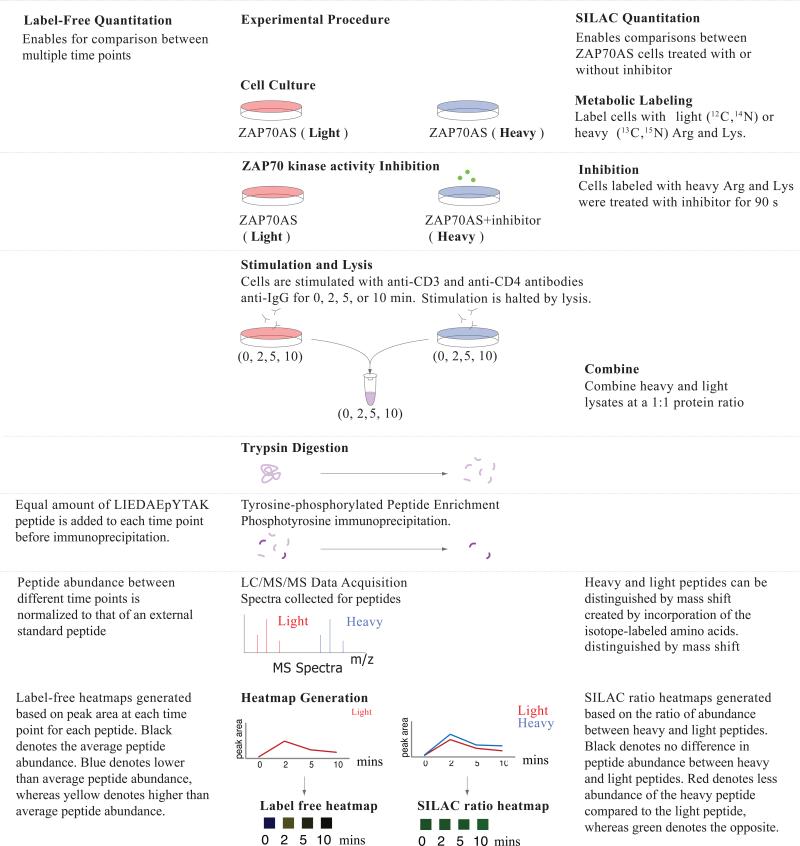
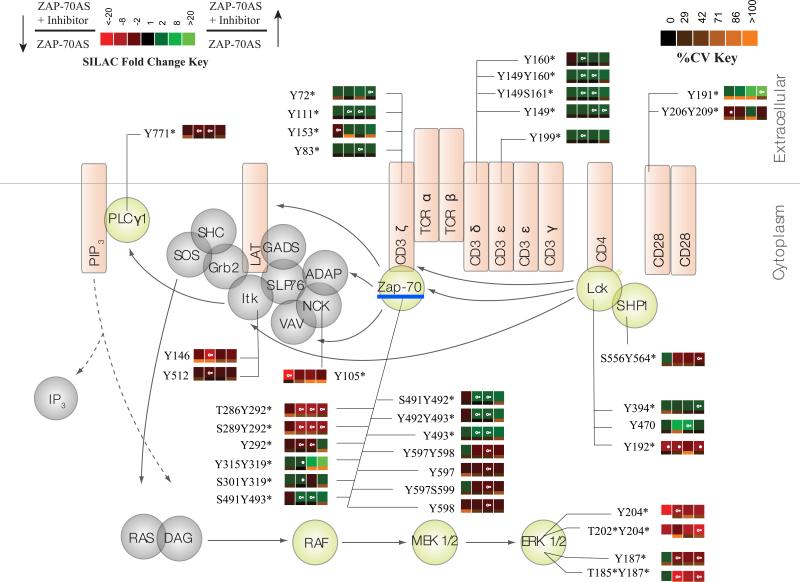
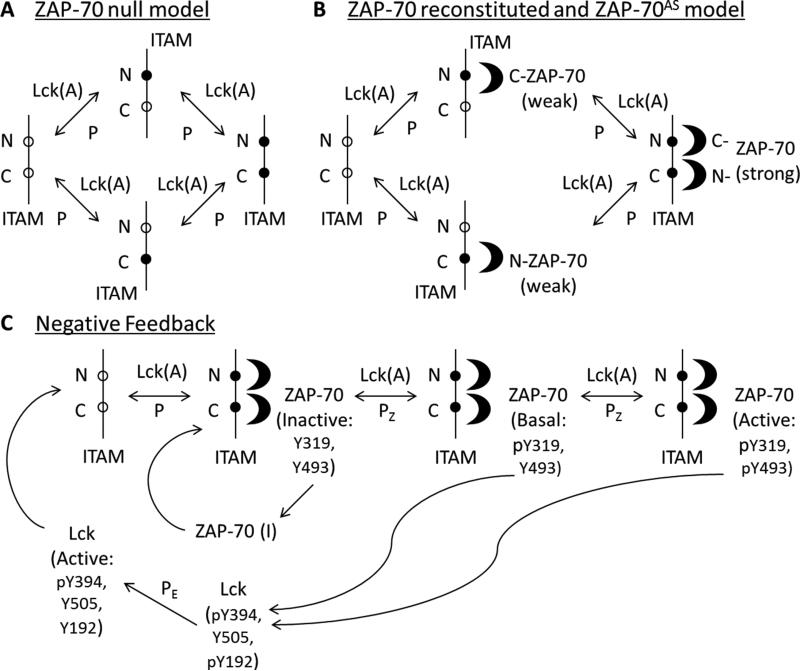
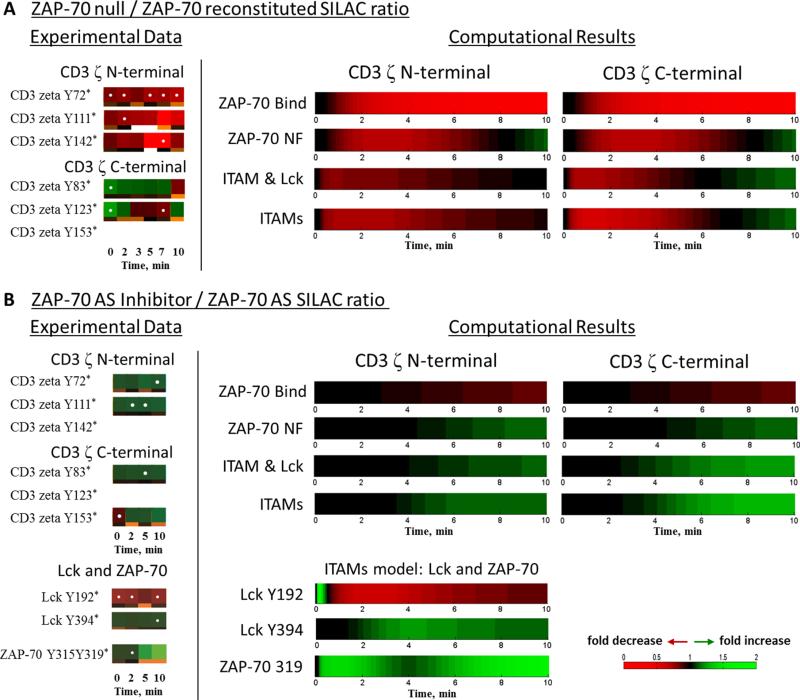
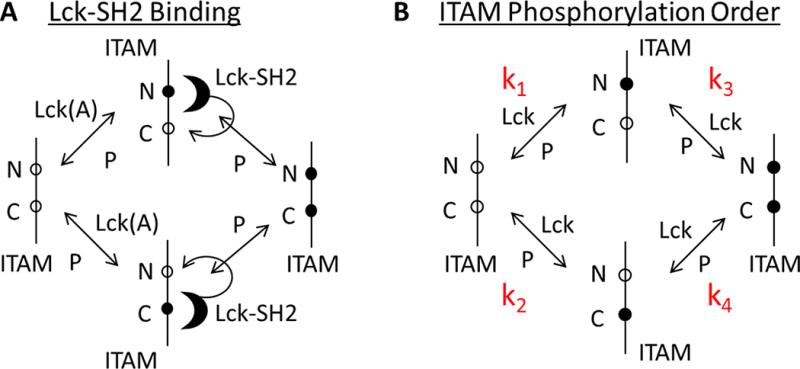
T cell activation by antigens binding to the T cell receptor (TCR) must be properly regulated to ensure normal T cell development and effective immune responses to pathogens and transformed cells while avoiding autoimmunity. The Src family kinase Lck and the Syk family kinase ZAP-70 (ζ chain-associated protein kinase of 70 kD) are sequentially activated in response to TCR engagement and serve as critical components of the TCR signaling machinery that leads to T cell activation. We performed a mass spectrometry-based phosphoproteomic study comparing the quantitative differences in the temporal dynamics of phosphorylation in stimulated and unstimulated T cells with or without inhibition of ZAP-70 catalytic activity. The data indicated that the kinase activity of ZAP-70 stimulates negative feedback pathways that target Lck and thereby modulate the phosphorylation patterns of the immunoreceptor tyrosine-based activation motifs (ITAMs) of the CD3 and ζ chain components of the TCR and of signaling molecules downstream of Lck, including ZAP-70. We developed a computational model that provides a mechanistic explanation for the experimental findings on ITAM phosphorylation in wild-type cells, ZAP-70-deficient cells, and cells with inhibited ZAP-70 catalytic activity. This model incorporated negative feedback regulation of Lck activity by the kinase activity of ZAP-70 and predicted the order in which tyrosines in the ITAMs of TCR ζ chains must be phosphorylated to be consistent with the experimental data.


Figures

Fig. 1
Fig. 1. Experimental design for SILAC experiments
Human Jurkat P116 cells expressing ZAP-70AS were incubated with light or heavy stable isotope–labeled arginine and lysine amino acids, physically differentiating the two proteomes by a shift in molecular weight. Cells were treated with DMSO (light-labeled cells) or HXJ-42 (ZAP-70AS+Inhibitor, heavy-labeled cells) for 90 s before stimulation. Each cell population was then incubated with OKT3 and OKT4 antibodies against CD3 and CD4, respectively, for 30 s before being treated with crosslinking IgG for the indicated times. A total of five biological replicates were performed. Sample preparation, mass spectrometry experiments, and data analysis were performed as indicated.
Fig. 2
Fig. 2. Individual phosphorylation site changes with inhibitor treatment
(A to C) Comparison of the relative abundances of the indicated phosphopeptides for (A) Itk, Vav, and ERK, (B) CD3 ITAMs, and (C) Lck, ZAP-70, Nck, and PYK2 after cells preincubated with DMSO (control) or the ZAP-70AS inhibitor were left unstimulated (zero time point) or were stimulated through the TCR for the indicated times. A total of five biological replicates were performed and the calculated average ratio and SD is plotted for each timepoint. *P < 0.05.
Fig. 3
Fig. 3. Targets of ZAP-70–dependent negative feedback regulation in TCR-proximal signaling
A model of the changes in the phosphorylation of TCR signaling components that occurred after inhibition of ZAP-70 catalytic activity (represented by the blue line), illustrated as quantitative SILAC ratio heatmaps beside individual proteins, corresponding to the changes in phosphorylation between the inhibitor-treated and control cells across the four time points of TCR stimulation. Heatmaps were calculated from the average of five independent biological replicate experiments. Green represents increased phosphorylation, whereas red represents decreased phosphorylation in ZAP-70–inhibited cells relative to DMSO-treated controls. White dots within the heatmap indicate a statistically significant difference (q value < 0.05) for that time point and phosphopeptide. Below each heatmap square is a color bar representing the coefficient of variation for that point. Orange represents a high degree of variation, whereas black represents a low degree of variation amongst the replicate analyses.
Fig. 4
Fig. 4. Computational model of proximal TCR signaling
(A) In ZAP-70 null cells, active Lck sequentially phosphorylates (whereas phosphatases denoted by “P” dephosphorylate) the N- and C- terminal tyrosines within individual ITAMs, generating singly phosphorylated and later doubly phosphorylated ITAMs. (B) In the ZAP-70–reconstituted cells or in ZAP-70AS cells, ZAP-70 weakly binds to the singly phosphorylated ITAMs and strongly binds to the doubly phosphorylated ITAMs. (C) Active Lck phosphorylates the SH2-linker tyrosine residues Y315 and Y319 of ZAP-70, generating open ZAP-70. The subsequent phosphorylation by Lck of Y493 generates active ZAP-70. Active and open forms of ZAP-70 are dephosphorylated by phosphatases (Pz). Active and open forms of ZAP-70 phosphorylate a negative regulatory site (Y192) in Lck. The phosphatases denoted by “PE” dephosphorylate Lck to return it to its active state. Active Lck further regulates ITAM phosphorylation through this negative feedback loop.
Fig. 5
Fig. 5. Correlation between the experimental and calculated SILAC ratios
(A) Comparison of the experimental (left) and calculated (right) SILAC ratios of the N- and C-terminal tyrosines within each ITAM for the ZAP-70 null / ZAP-70 reconstituted system as a ratio heatmap. (B) Comparison of the experimental (left) and calculated (right) SILAC ratios for tyrosine phosphorylation of ζ-chain ITAMs, Lck, and ZAP-70 proteins of the ZAP-70AS+Inhibitor / ZAP-70AS system as a ratio heatmap. The experimental ZAP-70 null / ZAP-70 reconstituted SILAC ratios (left panel) are taken from a previous study (34). The calculated SILAC ratios (right) were determined for the presence of various biological effects. The “ZAP-70 Bind” model captures the results when ZAP-70–mediated negative feedback is absent. The “ZAP-70 NF” model shows the results when ZAP-70–medited negative feedback occurs. The “ITAM and Lck” model illustrates the results with the fast initial phosphorylation of the N-terminal tyrosine residues of ITAMs by Lck and the subsequent binding of the SH2 domain of Lck to the N- and C-terminal tyrosines. The “ITAMs” model captures the results with ordered phosphorylation of ζ-chain ITAM tyrosines (scenarios 1, 2, and 3). The “ITAM and Lck” and “ITAMs” models include the ZAP-70–mediated negative feedback. The calculated SILAC ratios for the tyrosine phosphorylation of the Lck and ZAP-70 proteins of the ZAP-70AS+Inhibitor / ZAP-70AS system are shown only for the “ITAMs” model. In the heatmap, red indicates a decrease in phosphorylation, black indicates no change, and green represents an increase in phosphorylation when comparing ZAP-70 null cells to Zap-70–reconstituted cells or ZAP-70AS inhibited cells versus DMSO-treated control cells. The experimental phosphorylation of Y153 in the ZAP-70 null / ZAP-70 reconstituted SILAC ratio and of Y142 and Y123 in the ZAP-70AS+Inhibitor / ZAP-70AS SILAC ratio were not detected, which is indicated by missing heatmaps .
Fig. 6
Fig. 6. Computational models that describe the asymmetry in ITAM phosphorylation
(A) Active Lck sequentially phosphorylates (and the phosphatases “P” dephosphorylate) the N- and C-terminal tyrosines within each ITAM, generating singly phosphorylated and later doubly phosphorylated ITAMs. Next, Lck binds through its noncatalytic SH2 domain to the phosphorylated N- and C-terminal tyrosines of each ITAM. Once bound, Lck rapidly phosphorylates the neighboring C- and N-terminal tyrosines of each ITAM, generating doubly phosphorylated ITAMs. (B) Kinetic scheme of the order of tyrosine-phosphorylation in ITAMs according to scenarios 1, 2, and 3. k1 and k2 are the rates of production of singly phosphorylated N- and C-terminal tyrosines from their unphosphorylated forms, respectively, whereas k3 and k4 are the rates of production of doubly phosphorylated N- and C-terminal tyrosines from their singly phosphorylated forms, respectively.

References

    1. Smith-Garvin JE, Koretzky GA, Jordan MS. T Cell Activation. Annu. Rev. Immunol. 2009;27:591–619. - PMC - PubMed
    1. Brownlie RJ, Zamoyska R. T cell receptor signalling networks: branched, diversified and bounded. Nat. Rev. Immunol. 2013;13:257–269. - PubMed
    1. Jordan MS, Singer AL, Koretzky GA. Adaptors as central mediators of signal transduction in immune cells. Nat. Immunol. 2003;4:110–116. - PubMed
    1. Tan YX, Zikherman J, Weiss A. Novel Tools to Dissect the Dynamic Regulation of TCR Signaling by the Kinase Csk and the Phosphatase CD45. Cold Spring Harb. Symp. Quant. Biol. 2013:a020347. - PMC - PubMed
    1. Chow LM, Fournel M, Davidson D, Veillette A. Negative regulation of T-cell receptor signalling by tyrosine protein kinase p50csk. Nature. 1993;365:156–160. - PubMed

Publication types

MeSH terms

Substances