Review
. 2016 Feb;17(1):205-20.
doi: 10.1007/s10522-015-9584-x. Epub 2015 May 20.

Complex systems dynamics in aging: new evidence, continuing questions

Affiliations
Review

Complex systems dynamics in aging: new evidence, continuing questions

Alan A Cohen. Biogerontology. 2016 Feb.

Abstract

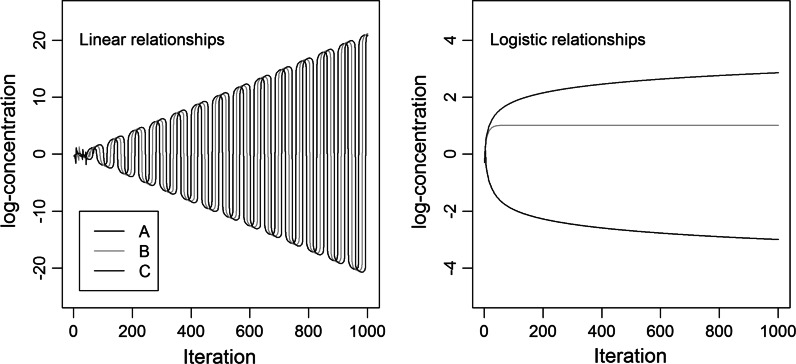
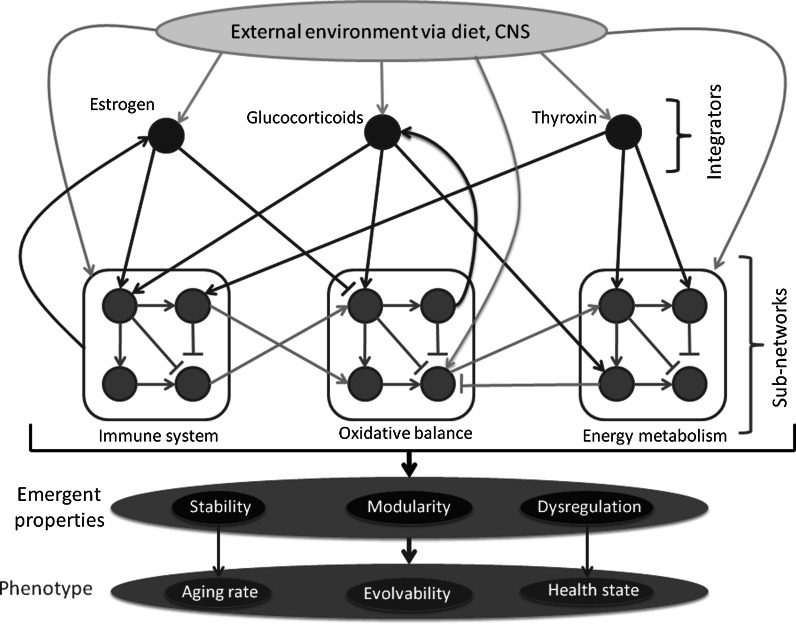
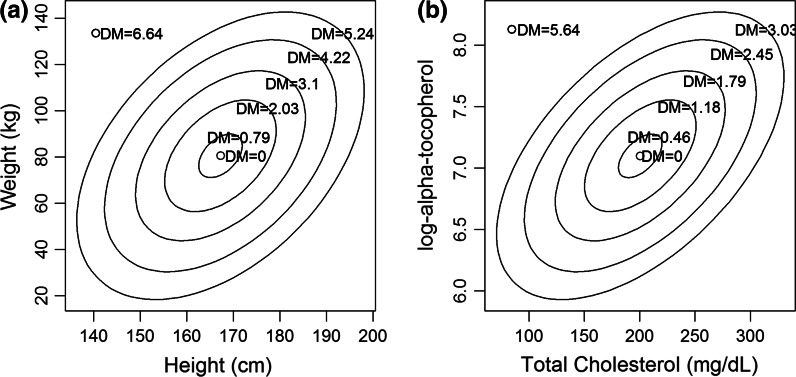
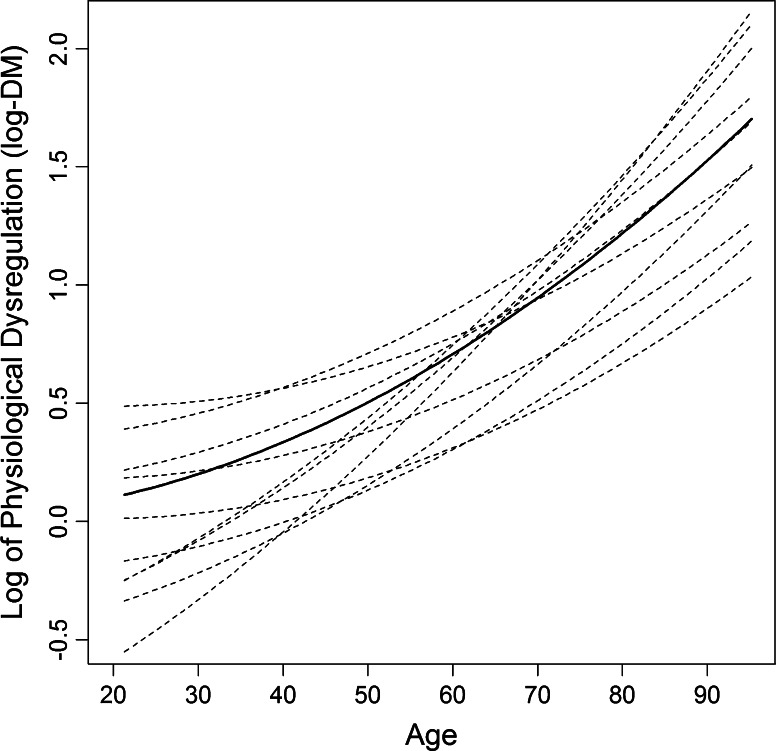
There have long been suggestions that aging is tightly linked to the complex dynamics of the physiological systems that maintain homeostasis, and in particular to dysregulation of regulatory networks of molecules. This review synthesizes recent work that is starting to provide evidence for the importance of such complex systems dynamics in aging. There is now clear evidence that physiological dysregulation--the gradual breakdown in the capacity of complex regulatory networks to maintain homeostasis--is an emergent property of these regulatory networks, and that it plays an important role in aging. It can be measured simply using small numbers of biomarkers. Additionally, there are indications of the importance during aging of emergent physiological processes, functional processes that cannot be easily understood through clear metabolic pathways, but can nonetheless be precisely quantified and studied. The overall role of such complex systems dynamics in aging remains an important open question, and to understand it future studies will need to distinguish and integrate related aspects of aging research, including multi-factorial theories of aging, systems biology, bioinformatics, network approaches, robustness, and loss of complexity.

Keywords: Aging; Emergent property; Physiological dysregulation; Principal components analysis; Statistical distance; Systems biology.


Figures

Fig. 1
Fig. 1
Linear and logistic relationships among molecules can produce vastly different functional dynamics in the system. Results are based on a simple simulation of three molecules, A, B, and C, in which A up-regulates B, B up-regulates C, and C down-regulates A. Over 1000 time steps, linear dynamics produce a highly unstable, fluctuating system, whereas logistic dynamics produce a more stable system. Accordingly, it is not necessarily possible to predict the dynamics of a complex system based solely on a map of what regulates what, without a detailed understanding of the functional forms of the regulatory dynamics
Fig. 2
Fig. 2
A simplified, partial schematic of a physiological regulatory network (PRN). Red arrows indicate top-down control, such as steroid hormone modulation of immune function. Purple arrows indicate feedback effects, such as antioxidant effects on glucocorticoids. Light-blue arrows indicate direct interactions among subnetworks, such as immune regulation by dietary antioxidants. Green arrows indicate direct effects of the environment on subnetworks, such as content of antioxidants in the diet. Yellow arrows indicate environmental regulation of integrators, usually via the central nervous system (CNS). System-level properties of the PRN exist at different levels, including state within individuals (e.g. dysregulation) and species-level structure (modularity). Likewise, phenotype can include individual- or species-level traits (e.g. health and evolvability, respectively). Modularity is determined by the proportion of potential light-blue arrows present; interconnectedness by the total number of arrows relative to molecules; and robustness by the density of purple arrows resulting in negative feedback effects. The particular structure of connections, as well as their strengths and interactions, will determine how the PRN responds at an individual level and evolves at the species level in response to a changing environment. Adapted from Cohen et al. (2012)
Fig. 3
Fig. 3
A general, 2-dimensional example of Mahalanobis distance (DM) based 30,000 + adults in the NHANES dataset. a gives the relationship between height and weight (an intuitive example), and b between total cholesterol and vitamin E (two biomarkers in our data sets). The correlations between these variables are r = 0.45 and 0.54, respectively. The concentric ellipses represent, from inside to outside, ellipses that should contain 0, 10, 50, 80, 95, and 99 % of the observations, based on the combination of the correlation, means, and standard deviations. DM here reflects how rare any height-weight or cholesterol-vitamin E combination is, and thus has an equal value for all points on the same ellipse, as indicated in red. Because DM incorporates the correlation into the calculation, it reflects the fact that certain combinations may be more unusual than expected based solely on how rare the values are separately. For example in a, the point in the upper left (height = 140 cm, weight = 133 kg) has a DM of 6.64, substantially higher than DM = 5.24 for the point on the 99 % ellipse in the upper right (height = 194 cm, weight = 133 kg) despite the fact that heights of 140 and 194 cm are equally rare in the population (99.6th percentile). Accordingly, DM correctly reflects the fact that it is much rarer to be short and heavy than tall and heavy. In practice, DM applies this principle to large numbers of variables simultaneously, though visualization is hard beyond two dimensions
Fig. 4
Fig. 4
Estimated trajectories of log-DM with age at the population (solid black line) and individual (dotted lines) levels for the InCHIANTI cohort based on quadratic Bayesian multi-level models. These models estimate an overall (population) quadratic function for change in DM with age, as well as individual deviations from this function. Each individual’s trajectory is estimated with substantial error, but overall estimates of the heterogeneity of trajectories are robust with the sample sizes available. Individual trajectories are shown for ten individuals selected randomly in the dataset as an example. Inference is based on statistical distance of 43 common clinical biomarkers (albumin, glucose, cholesterol, etc.) measured in 1022 individuals aged 21–96, with up to four visits per individual. While individual heterogeneity in level and rate of change in DM is significant, the general trend toward increasing and accelerating DM with age is also clear. More complete analyses and details are available in Milot et al. (2014b)

References

    1. Abdelouahab N, Langlois M-F, Lavoie L, Corbin F, Pasquier J-C, Takser L. Maternal and cord-blood thyroid hormone levels and exposure to polybrominated diphenyl ethers and polychlorinated biphenyls during early pregnancy. Am J Epidemiol. 2013 - PubMed
    1. Ahn AC, Tewari M, Poon C-S, Phillips RS. The limits of reductionism in medicine: could systems biology offer an alternative? PLoS Med. 2006;3:e208. doi: 10.1371/journal.pmed.0030208. - DOI - PMC - PubMed
    1. Arbeev KG, et al. Age trajectories of physiological indices in relation to healthy life course. Mech Ageing Dev. 2011;132:93–102. doi: 10.1016/j.mad.2011.01.001. - DOI - PMC - PubMed
    1. Barbaric I, Miller G, Dear TN. Appearances can be deceiving: phenotypes of knockout mice. Briefings in Functional Genomics & Proteomics. 2007;6:91–103. doi: 10.1093/bfgp/elm008. - DOI - PubMed
    1. Barja G. The mitochondrial free radical theory of aging. Prog Mol Biol Transl Sci. 2014;127:1–27. doi: 10.1016/B978-0-12-394625-6.00001-5. - DOI - PubMed

Publication types

LinkOut - more resources