. 2015 Jul 15;309(2):E191-203.
doi: 10.1152/ajpendo.00003.2015. Epub 2015 May 19.

Mass spectrometry-based microassay of (2)H and (13)C plasma glucose labeling to quantify liver metabolic fluxes in vivo

Affiliations

Mass spectrometry-based microassay of (2)H and (13)C plasma glucose labeling to quantify liver metabolic fluxes in vivo

Clinton M Hasenour et al. Am J Physiol Endocrinol Metab. .

Abstract

Mouse models designed to examine hepatic metabolism are critical to diabetes and obesity research. Thus, a microscale method to quantitatively assess hepatic glucose and intermediary metabolism in conscious, unrestrained mice was developed. [(13)C3]propionate, [(2)H2]water, and [6,6-(2)H2]glucose isotopes were delivered intravenously in short- (9 h) and long-term-fasted (19 h) C57BL/6J mice. GC-MS and mass isotopomer distribution (MID) analysis were performed on three 40-μl arterial plasma glucose samples obtained during the euglycemic isotopic steady state. Model-based regression of hepatic glucose and citric acid cycle (CAC)-related fluxes was performed using a comprehensive isotopomer model to track carbon and hydrogen atom transitions through the network and thereby simulate the MIDs of measured fragment ions. Glucose-6-phosphate production from glycogen diminished, and endogenous glucose production was exclusively gluconeogenic with prolonged fasting. Gluconeogenic flux from phosphoenolpyruvate (PEP) remained stable, whereas that from glycerol modestly increased from short- to long-term fasting. CAC flux [i.e., citrate synthase (VCS)] was reduced with long-term fasting. Interestingly, anaplerosis and cataplerosis increased with fast duration; accordingly, pyruvate carboxylation and the conversion of oxaloacetate to PEP were severalfold higher than VCS in long-term fasted mice. This method utilizes state-of-the-art in vivo methodology and comprehensive isotopomer modeling to quantify hepatic glucose and intermediary fluxes during physiological stress in mice. The small plasma requirements permit serial sampling without stress and the affirmation of steady-state glucose kinetics. Furthermore, the approach can accommodate a broad range of modeling assumptions, isotope tracers, and measurement inputs without the need to introduce ad hoc mathematical approximations.

Keywords: gluconeogenesis; isotopomer model; liver physiology; metabolic flux analysis; nutrient metabolism.


Figures

Fig. 1.
Fig. 1.
A: experimental time course for stable isotopic infusions and plasma sampling in vivo. The scheme specifies the standard [13C3]propionate infusion protocol; however, the one-half and one-fourth [13C3]propionate infusions were performed similarly, with minor modifications (as detailed in In Vivo Procedures in the Mouse). B: average blood glucose measurements during the experimental time course for long-term-fasted mice in the standard (△ and solid line; n = 7), one-half (○ and dashed line; n = 8), and one-fourth (□ and dotted line; n = 8) infusion groups. Blood glucose measurements were compared using an ANOVA and reported as means ± SE.
Fig. 2.
Fig. 2.
A: model of glucose-producing and citric acid cycle (CAC)-related fluxes during fasting. Lactate, amino acids, fatty acids, glycerol, and glycogen are modeled as substrates for intermediary metabolic exchange. 13C from [13C3]propionate enters the CAC as succinyl-CoA (SucCoA) at rate VPCC. 2H from [2H2]water incorporates at multiple sites in the flux model (Table A1). The rate of glucose production is estimated as VEndoRa. [6,6-2H2]glucose (Glc.inf) is delivered at rate VInf. Multiple substrates (e.g., lactate and amino acids) shuttle through Pyr to the CAC; thus, VLDH encompasses all non-PEP derived, unlabeled sources of anaplerotic flux to the CAC. See Glossary for a key to metabolite and reaction abbreviations in the model. B: derivatization and ionization of plasma glucose produces 6 overlapping ion fragments for analysis. Aldonitrile pentapropionate derivative: m/z 173, 259, 284 370; di-O-isopropylidene propionate derivative: m/z 301; methyloxime pentapropionate derivative: m/z 145.
Fig. 3.
Fig. 3.
Average relative abundance of m/z 301 isotopomers at baseline (−125 min) and isotopic steady state (90, 100, and 110 min) for long-term-fasted mice in the standard (n = 7; A), one-half (n = 8; B), and one-fourth (n = 8; C) [13C3]propionate infusion groups. The y-axes show the relative uncorrected abundance of each isotopomer detailed in the legend from M + 0 (unlabeled, m/z 301) to M + 4 (m/z 305).
Fig. 4.
Fig. 4.
Mean isotopic steady-state mass isotopomer distributions among long-term fasted mice in the standard (black bars; n = 7), one-half (striped bars; n = 8), and one-fourth (open bars; n = 8) [13C3]propionate infusion groups for 6 glucose fragments (Fig. 2B): m/z 145 (A), m/z 173 (B), m/z 259 (C), m/z 284 (D), m/z 301 (E), and m/z 370 (F). The y-axes show the relative uncorrected abundance of each isotopomer detailed on the x-axes, where M + n refers to the mass shift from the unlabeled state. Data are presented as means ± SE.
Fig. 5.
Fig. 5.
A: comparison of model-estimated fluxes from long-term-fasted mice in the standard (black bars; n = 7), one-half (striped bars; n = 8), and one-fourth (open bars; n = 8) [13C3]propionate infusion groups. Metabolic flux analysis (MFA) results for the 3 isotopic steady-state samples were averaged to obtain a representative set of values for each mouse. Data are presented as means ± SE. VGK and VEnol are reported in hexose units. One-way ANOVA indicated that at least 1 mean was different at VPYGL, VGK, VCS, VPCC, and VSDH. Tukey-Kramer was used for pairwise comparisons. Letters above the bars indicate statistically separated groups. Visualization of the 95% confidence interval around the estimates for VLDH obtained for a representative mouse in the standard (B), one-half (C), and one-fourth (D) [13C3]propionate infusion groups. Solid line depicts the lack of model fit to the data, measured by the sum of squared residuals (SSR), as a function of the VLDH flux value. The model-determined optimal point occurs where the SSR is minimized. VLDH flux was varied in each direction away from the optimal point while adjusting the remaining fluxes to obtain a new constrained minimum. The 95% confidence interval is determined by the points where the solid line intersects with the 95% confidence threshold (dotted line).
Fig. 6.
Fig. 6.
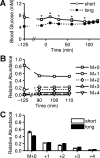
A: average blood glucose measurements taken over the experimental time course for short- (○ and solid line; n = 5) and long-term-fasted (● and dotted line; n = 7) mice. Data are presented as means ± SE and compared using a t-test with equal variance; *P < 0.05. B: average mass isotopomer distributions for fragment m/z 301 from baseline (−125 min) and isotopic steady-state (90, 100, and 110 min) samples from short-term-fasted mice (n = 5). C: comparison of the average relative abundance of m/z 301 isotopomers between the short- (n = 5) and long-term-fasted (n = 7) mice at isotopic steady state; data are presented as means ± SE. The standard [13C3]propionate infusion was administered to mice in both groups. At 90–110 min, mice in the short- and long-term groups were fasted ∼9 and 19 h, respectively. For B and C, the relative uncorrected abundance is shown for each mass isotopomer from m/z 301 (M + 0) to m/z 305 (M + 4).
Fig. 7.
Fig. 7.
Comparison of model-estimated fluxes for short- (open bars; n = 5) and long-term-fasted (black bars; n = 7) C57BL/6J mice in μmol/min (A), in μmol·kg−1·min−1 (B), and relative to VEndoRa (C). VGK and VEnol are reported in hexose units. The standard [13C3]propionate infusion was administered to mice in both groups. The MFA results for the 3 isotopic steady-state samples were averaged to obtain a representative set of values for each mouse. Data are presented as means ± SE and compared using a t-test with equal variance. *P < 0.05.
Fig. 8.
Fig. 8.
Comparison of model-estimated fluxes with CO2 recycling from long-term-fasted mice in the standard (black bars; n = 7), one-half (striped bars; n = 8), and one-fourth (open bars; n = 8) [13C3]propionate infusion groups (A) and from short- (open bars; n = 5) and long-term-fasted (black bars; n = 7) mice administered the standard [13C3]propionate infusion (B). MFA results within each group were averaged to obtain a representative set of values for each mouse. Data are presented as means ± SE. VGK and VEnol are reported in hexose units. Infusion groups were compared by 1-way ANOVA and Tukey-Kramer pairwise comparisons; letters above the bars indicate statistically separated groups. Fasting groups were compared using a t-test with equal variance. *P < 0.05.
Fig. A1.
Fig. A1.
The heat map depicts the fractional contribution of mass isotopomers from glucose fragment ions m/z 145, 173, 259, 284, 301, and 370 to the variance of flux estimates. The heat map was generated by simulating flux through the best-fit model determined from all mice in the standard [13C3]propionate infusion group (n = 12). The color spectra (right bar), ranging from dark blue to dark red, corresponds to the least and most important contributors to flux estimates, respectively. As shown, the majority of fluxes are informed by multiple mass isotopomers derived from plasma glucose.

References

    1. Antoniewicz MR, Kelleher JK, Stephanopoulos G. Determination of confidence intervals of metabolic fluxes estimated from stable isotope measurements. Metab Eng 8: 324–337, 2006. - PubMed
    1. Antoniewicz MR, Kelleher JK, Stephanopoulos G. Accurate assessment of amino acid mass isotopomer distributions for metabolic flux analysis. Anal Chem 79: 7554–7559, 2007. - PubMed
    1. Antoniewicz MR, Kelleher JK, Stephanopoulos G. Elementary metabolite units (EMU): a novel framework for modeling isotopic distributions. Metab Eng 9: 68–86, 2007. - PMC - PubMed
    1. Antoniewicz MR, Kelleher JK, Stephanopoulos G. Measuring deuterium enrichment of glucose hydrogen atoms by gas chromatography/mass spectrometry. Anal Chem 83: 3211–3216, 2011. - PMC - PubMed
    1. Ayala JE, Bracy DP, McGuinness OP, Wasserman DH. Considerations in the design of hyperinsulinemic-euglycemic clamps in the conscious mouse. Diabetes 55: 390–397, 2006. - PubMed

Publication types

LinkOut - more resources