. 2015 May 19;6(3):e00381-15.
doi: 10.1128/mBio.00381-15.

Gut microbial succession follows acute secretory diarrhea in humans

Affiliations

Gut microbial succession follows acute secretory diarrhea in humans

Lawrence A David et al. mBio. .

Abstract

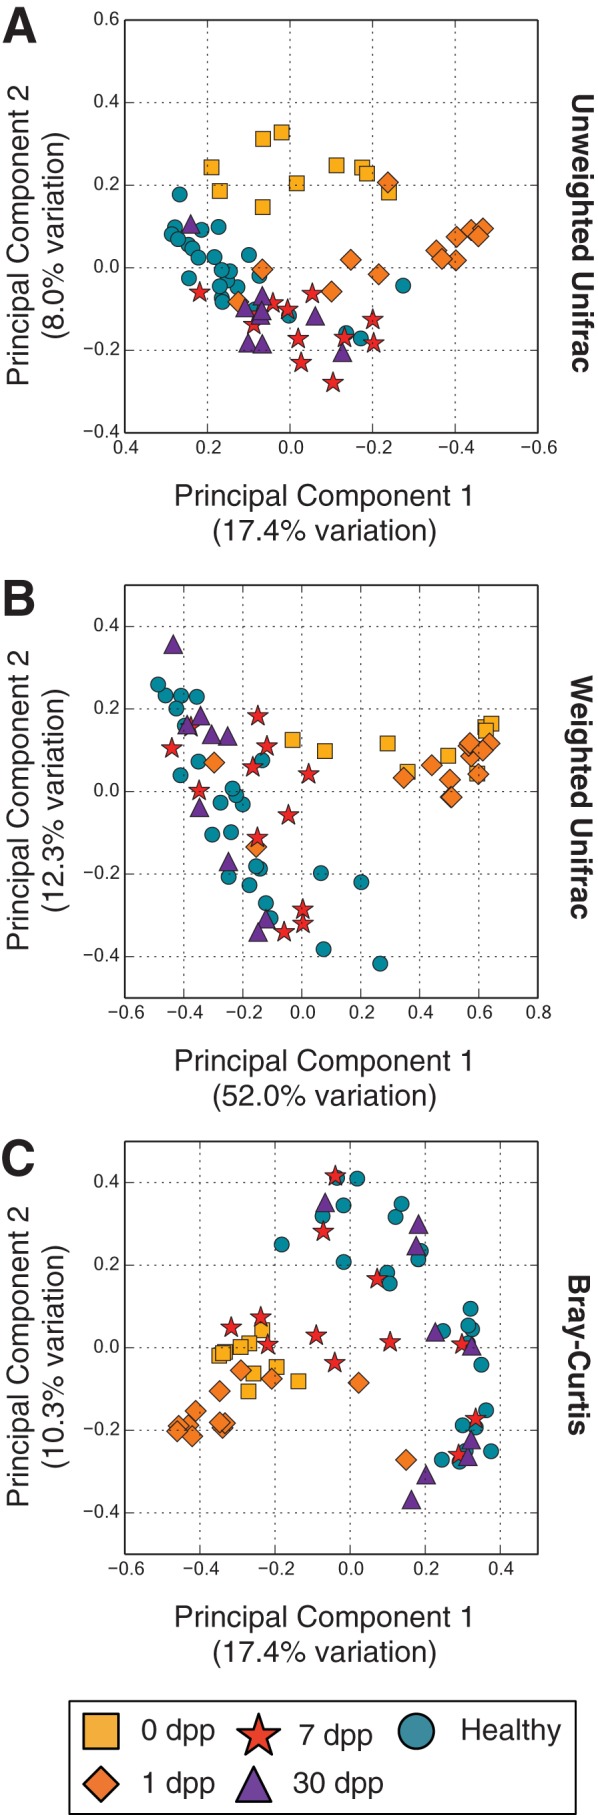
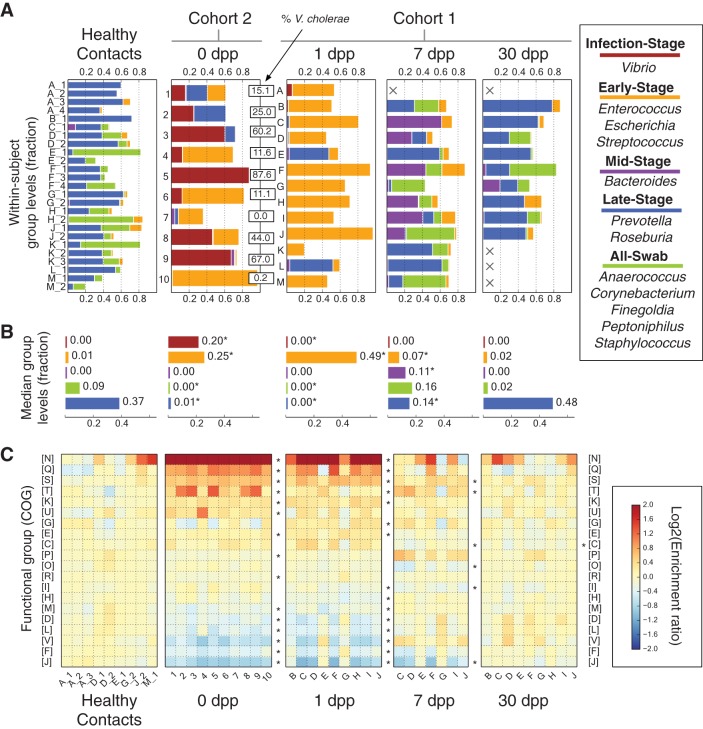
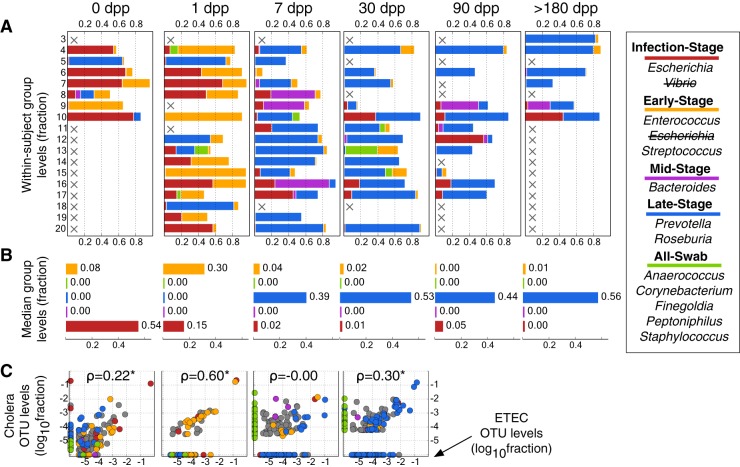
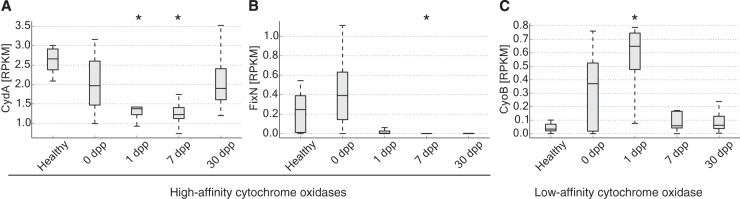
Disability after childhood diarrhea is an important burden on global productivity. Recent studies suggest that gut bacterial communities influence how humans recover from infectious diarrhea, but we still lack extensive data and mechanistic hypotheses for how these bacterial communities respond to diarrheal disease and its treatment. Here, we report that after Vibrio cholerae infection, the human gut microbiota undergoes an orderly and reproducible succession that features transient reversals in relative levels of enteric Bacteroides and Prevotella. Elements of this succession may be a common feature in microbiota recovery from acute secretory diarrhea, as we observed similar successional dynamics after enterotoxigenic Escherichia coli (ETEC) infection. Our metagenomic analyses suggest that multiple mechanisms drive microbial succession after cholera, including bacterial dispersal properties, changing enteric oxygen and carbohydrate levels, and phage dynamics. Thus, gut microbiota recovery after cholera may be predictable at the level of community structure but is driven by a complex set of temporally varying ecological processes. Our findings suggest opportunities for diagnostics and therapies targeting the gut microbiota in humans recovering from infectious diarrhea.

Importance: Disability after diarrhea is a major burden on public health in the developing world. Gut bacteria may affect this recovery, but it remains incompletely understood how resident microbes in the digestive tract respond to diarrheal illness. Here, we observed an orderly and reproducible succession of gut bacterial groups after cholera in humans. Genomic analyses associated the succession with bacterial dispersal in food, an altered microbial environment, and changing phage levels. Our findings suggest that it may one day be feasible to manage resident bacterial populations in the gut after infectious diarrhea.


Figures

FIG 1
FIG 1
Principal coordinates analyses of gut microbiota similarities. The similarities of gut microbiota samples from cholera patients and healthy household contacts over time were projected onto a two-dimensional space by using principal coordinates analysis (76). Shown are projections made using the unweighted Unifrac (A) and weighted Unifrac (B) distances, as well as the Bray-Curtis dissimilarity (C).
FIG 2
FIG 2
Gut microbial succession in the weeks following V. cholerae infection. (A) Abundance of gut bacteria from the two cohorts over time. To simplify analysis, bacterial OTUs were collapsed at the genus level. Highly correlated genera were further grouped and named according to their dynamics. Cholera patients are shown at 0 dpp (cohort 2; labeled by subject ID) or from 1 dpp onwards (cohort 1; labeled by household ID). Microbiota from healthy household contacts in cohort 1 are shown in the healthy contacts group and distinguished by numbers following their household IDs; these samples were collected at the same time as patient 1-dpp samples. Absent samples are labeled with an X. The percentages of 16S rRNA reads associated with V. cholerae among subjects at 0 dpp are shown in boxes (median, 25%). (B) Median group abundances across subjects. Abundance values are also shown next to the bars. Significant differences relative to controls are labeled with an asterisk (P < 0.05; two-sided Mann-Whitney U test). (C) Microbial gene abundances, grouped using the COG hierarchy of functions (82). Gene levels are shown relative to median values in healthy subjects and are organized by subject (columns) and COG category (rows). Red boxes indicate gene functions enriched in subjects, relative to healthy controls, while blue boxes denote gene functions that are rarer. Categories labeled with asterisks to the right of a given recovery stage have significantly different abundances at that stage compared to controls (q < 0.05, Mann-Whitney U test). Rare COG categories (median fractional abundance, <0.0001 in healthy controls) are not shown here but are provided in Table S4 in the supplemental material, along with median COG abundances and full COG category names.
FIG 3
FIG 3
Gut microbial succession after ETEC infection. (A) To test the generalizability of the clustering model used for cholera infection (Fig. 2), a similar model was applied to longitudinal gut microbiota surveys from subjects infected with ETEC. The original Fig. 2 model was slightly modified to reflect Escherichia coli as the causal pathogen. Absent samples are labeled with an X. (B) Median group abundance levels across subjects. (C) Individual OTU abundances at each sampling date (x axis), compared to their abundances in cholera patients at corresponding times. OTUs are colored by group, with taxa that were not assigned to groups shown in gray. Spearman correlations (ρ) are shown and labeled with asterisks if P was <0.05. A pseudocount of 1e−6 has been added so that OTUs with 0 abundance can be seen.
FIG 4
FIG 4
Cytochrome oxidases with low or high affinities for oxygen show diverging dynamics after infection. (A) CydA, the catalytic subunit of the high-affinity, bd-type cytochrome oxidase, exhibits decreasing abundance after infection. (B) FixN, the catalytic subunit for high-affinity cbb3-type cytochrome oxidases, is also lower in abundance during recovery compared to healthy controls. (C) CyoB, a catalytic subunit for low-affinity bo3-type terminal oxidases, increases immediately after infections but returns to control levels 7 dpp. Values significantly different from healthy ones are indicated with an asterisk (P < 0.01, two-sided Mann-Whitney U test), and all genes exhibit differential abundance over time (P < 0.05, Kruskal-Wallis test). Abundances are shown normalized to reads per kilobase per million mapped (RPKM). Box inner bands indicate median RPKM levels, tops and bottoms span the first and third quartiles, and whiskers denote 1.5 times the interquartile range.
FIG 5
FIG 5
Carbohydrate-associated enzymes are enriched at 7 dpp. Shown are enzymes with significant differences in abundance between healthy and 7-dpp samples (q < 0.1, two-sided Mann-Whitney U test). Labeled enzymes belong to the three enzyme sub-subclasses that were most enriched at 7 dpp: glycosidases (EC 3.2.1.-, red EC number), phosphotransferases with an alcohol group as acceptor (EC:2.7.1-, orange), and oxidoreductases with CH−OH donors and NAD+ or NADP+ as acceptors (EC:1.1.1.-, green). Enzymes labeled on the left have significantly lower abundances in 7-dpp microbiomes relative to healthy ones, whereas enzymes labeled on the right have significantly higher abundances. Names in black are enzymes associated with carbohydrate metabolism, while those in gray are not associated with carbohydrates. To improve legibility, some enzyme names have been listed with more compact alternative names. Abundances are shown with log-transformed RPKM values (reads per kilobase per million mapped).
FIG 6
FIG 6
Phage succession following cholera recovery. (A) Box plots showing distributions of metagenomic reads mapping solely to viral genomes at each stage of infection. Viral levels are elevated by nearly 2 orders of magnitude in acute cholera infection (0 dpp), relative to healthy samples (***, P < 0.001, two-sided Mann-Whitney U test). Viral DNA levels remain significantly elevated at 1 dpp (**, P < 0.01) but return to normal levels 7 dpp after infection (P > 0.05). Box inner bands indicate median enzyme abundances, tops and bottoms span the first and third quartiles, and whiskers denote 1.5 times the interquartile range. (B) Specific phage levels. Three phage taxa showed significant temporal variation (q < 0.1, Kruskal-Wallis test): Vibrio phage ICP1 (Vp ICP1), Vibrio phage ICP2 (Vp ICP2), and Streptococcus thermophilus temperate bacteriophage O1205 (St O1205). The vibriophage peaked in abundance at 0 dpp, while the streptococcus phage peaked a day later. Box plots show medians and upper/lower quartile reads normalized to reads per kilobase per million mapped (RPKM). Time points where phage abundances were significantly different from healthy controls are denoted by asterisks (two-sided Mann-Whitney U test): *, P < 0.05; **, P < 0.01; ***, P < 0.001.
FIG 7
FIG 7
A model of gut microbial succession after cholera. Our analyses suggest three groups of bacteria colonize the gut after cholera: an Early-Stage, a Mid-Stage, and a Late-Stage group. Initially, diarrheal infection and antibiotic treatment clear bacteria from the gut, allowing host-secreted oxygen and carbohydrates to accumulate (boxes around variables indicate elevated levels) (step 1). Early-Stage facultative anaerobes tolerate the elevated oxygen levels and are the first bacteria to recolonize; these bacteria are also likely to be introduced by ingested foods (step 2). Aerobic respiration by the Early-Stage microbes lowers oxygen tensions to the point where Mid- and Late-Stage obligate anaerobes can begin recolonizing the gut and better exploit built-up levels of carbohydrates. Phages targeting Early-Stage bacteria may hasten decreases in these bacteria (step 3). After several weeks, resource competition between Mid- and Late-Stage microbes for resources returns carbohydrates to normal levels and leads to the decline of the Mid-Stage group (step 4).

References

    1. Kosek M, Bern C, Guerrant RL. 2003. The global burden of diarrhoeal disease, as estimated from studies published between 1992 and 2000. Bull World Health Organ 81:197–204. doi: 10.1590/S0042-96862003000300010. - DOI - PMC - PubMed
    1. Bryce J, Boschi-Pinto C, Shibuya K, Black RE, WHO Child Health Epidemiology Group . 2005. WHO estimates of the causes of death in children. Lancet 365:1147–1152. doi: 10.1016/S0140-6736(05)71877-8. - DOI - PubMed
    1. Lorntz B, Soares AM, Moore SR, Pinkerton R, Gansneder B, Bovbjerg VE, Guyatt H, Lima AM, Guerrant RL. 2006. Early childhood diarrhea predicts impaired school performance. Pediatr Infect Dis J 25:513–520. doi: 10.1097/01.inf.0000219524.64448.90. - DOI - PubMed
    1. Moore SR, Lima AA, Conaway MR, Schorling JB, Soares AM, Guerrant RL. 2001. Early childhood diarrhoea and helminthiases associate with long-term linear growth faltering. Int J Epidemiol 30:1457–1464. doi: 10.1093/ije/30.6.1457. - DOI - PubMed
    1. Niehaus MD, Moore SR, Patrick PD, Derr LL, Lorntz B, Lima AA, Guerrant RL. 2002. Early childhood diarrhea is associated with diminished cognitive function 4 to 7-years later in children in a northeast Brazilian shantytown. Am J Trop Med Hyg 66:590–593. - PubMed

Publication types

MeSH terms