. 2015 Jul 3;290(27):16929-42.
doi: 10.1074/jbc.M115.654343. Epub 2015 May 19.

ATP-dependent Conformational Changes Trigger Substrate Capture and Release by an ECF-type Biotin Transporter

Affiliations

ATP-dependent Conformational Changes Trigger Substrate Capture and Release by an ECF-type Biotin Transporter

Friedrich Finkenwirth et al. J Biol Chem. .

Abstract

Energy-coupling factor (ECF) transporters for vitamins and metal ions in prokaryotes consist of two ATP-binding cassette-type ATPases, a substrate-specific transmembrane protein (S component) and a transmembrane protein (T component) that physically interacts with the ATPases and the S component. The mechanism of ECF transporters was analyzed upon reconstitution of a bacterial biotin transporter into phospholipid bilayer nanodiscs. ATPase activity was not stimulated by biotin and was only moderately reduced by vanadate. A non-hydrolyzable ATP analog was a competitive inhibitor. As evidenced by cross-linking of monocysteine variants and by site-specific spin labeling of the Q-helix followed by EPR-based interspin distance analyses, closure and reopening of the ATPase dimer (BioM2) was a consequence of ATP binding and hydrolysis, respectively. A previously suggested role of a stretch of small hydrophobic amino acid residues within the first transmembrane segment of the S units for S unit/T unit interactions was structurally and functionally confirmed for the biotin transporter. Cross-linking of this segment in BioY (S) using homobifunctional thiol-reactive reagents to a coupling helix of BioN (T) indicated a reorientation rather than a disruption of the BioY/BioN interface during catalysis. Fluorescence emission of BioY labeled with an environmentally sensitive fluorophore was compatible with an ATP-induced reorientation and consistent with a hypothesized toppling mechanism. As demonstrated by [(3)H]biotin capture assays, ATP binding stimulated substrate capture by the transporter, and subsequent ATP hydrolysis led to substrate release. Our study represents the first experimental insight into the individual steps during the catalytic cycle of an ECF transporter in a lipid environment.

Keywords: ABC transporter; ATP; ECF transporter; biotin; cross-linking; electron paramagnetic resonance (EPR); fluorescence; lipid bilayer nanodiscs; vitamin uptake.


Figures

FIGURE 1.
FIGURE 1.
General features of ECF transporters. The ECF consists of a membrane-bound T component and two cytoplasmic ABC ATPases (A1 and A2). T components contain 4–5 transmembrane helices in most cases plus three cytoplasmic coupling helices (CHs). Characteristic xRx signatures (where x represents a small residue like Ala, Gly, Ser, or Leu) are located at the C-terminal end of CH2 and CH3. The Arg residues dock into an acidic groove of the ATPases. The red rectangle in T-CH2 indicates a potential contact site with an AXXXA or related signature in TMH1 of the S components (also illustrated as a red rectangle). In crystallized ECF transporters, the brown rectangle in T-CH3 was located in proximity to the corresponding brown segments in TMH1, -2, and -6 of the S components. The orange loop connecting TMH1 and -2 in the S components is predicted to play a central role in locking and opening of the substrate-binding pocket. Hypothetically, S components rotate within the membrane during the transport cycle. The beige-colored cylinders in A1 and A2 represent the Q-helices of the ATPases. Q-helices are a typical feature of the ATPases of ECF transporters and contain a Gln residue in a conserved signature of six amino acid residues (14). The Q-helices are predicted to approach each other (indicated by convergent arrows) after ATP binding and closure of the nucleotide-binding sites.
FIGURE 2.
FIGURE 2.
ATPase activity of nanodisc-embedded BioMNY. A, SDS-PAGE analysis of purified BioMNY-containing nanodiscs. 1.5 μg of protein was separated on a 16% Tricine gel. B, C, and E, response of ATPase activity to the presence of biotin (B), orthovanadate (C), and AMP-PNP (E). The samples were preincubated with the effectors for 5 min prior to the addition of ATP (2 mm) plus MgCl2 (3 mm). All activities were determined within the linear range over 4 min by triplicate or quadruplicate independent measurements. Bars, mean velocities; error bars, S.E. of the mean velocities. D, kinetics of ATPase activity in response to the concentration of ATP. The concentration of MgCl2 (3 mm) was kept constant. Data were analyzed with the help of GRAFIT.
FIGURE 3.
FIGURE 3.
Structure model of the R. capsulatus BioMNY biotin transporter. The model assumes a BioM/BioN/BioY stoichiometry of 2:1:1. It was generated with SWISS-MODEL using the two ATPases (Protein Data Bank code 4HUQ, chain A and chain B) and the T component (Protein Data Bank code 4HUQ, chain T) of the L. brevis folate transporter and BioY from L. lactis (Protein Data Bank code 4DVE) as templates. The individual models of the two BioM copies and BioN were assembled with UCSF CHIMERA. BioY was docked to BioN using the ZDOCK server, and the total model was drawn with UCSF CHIMERA. Loop 1 of BioY connecting TMH1 and TMH2 is depicted in orange, the AXXXA motif (represented by A12A13XXV16A17) within TMH1 of BioY in green, the proposed interaction site of this signature in CH2 of BioN in magenta, and the Q-helix in the two BioM copies in red.
FIGURE 4.
FIGURE 4.
Growth of a biotin-auxotrophic and intrinsically biotin uptake-deficient E. coli strain producing BioMNY variants in vitamin-free mineral salts medium. A, growth of the strain containing R. capsulatus BioMNY (solid) or the derived solitary BioY (hatched). Growth on 1 nm biotin depended on the tripartite system. B, growth of recombinants producing BioMNY variants containing single or double replacements or lacking Cys residues on 1 nm biotin. The values represent the means of double or triple determinations ± S.D. (error bars). D86C, H87C, Q88C, and E161Q are variants of BioM; V143C and V147C are mutants of BioN, and A12W, A12V, A13W, A13V, V16W, A17W, L26C, K137C, and A152C are mutants of BioY.
FIGURE 5.
FIGURE 5.
Cross-link of the two BioM copies in BioMNY variants with BioMD86C or BioMQ88C replacements. DTT-reduced samples in nanodiscs were split, and one half was treated with 2 mm ATP. Cross-linking was initiated by the addition of 4 mm EBS (5 Å) or HBS (10 Å) and stopped by adding 5 mm NEM after 20 min. The samples were subjected to SDS-PAGE, and the gels were stained with Coomassie Blue. The model on the right illustrates the positions of the Asp-86, His-87, and Gln-88 residues (red) as well as the Walker A (dark blue) and ABC signature (purple) motifs in the two BioM copies. The crossed helices (turquoise) in the top part of the model represent coupling helices 2 and 3 of BioN.
FIGURE 6.
FIGURE 6.
DEER traces and interspin distance distributions of positions 87/87′ for three different states of the ATP hydrolysis cycle. Nanodisc-embedded BioMH87CNY was analyzed after spin labeling. The location of position 87 in the structure model is depicted in Fig. 5. A, DEER traces V(t); B, baseline-corrected data F(t) for the apo-state (gray), the nucleoside triphosphate-bound state (ATP plus EDTA, red; magnesium plus AMP-PNP, orange), and the post-hydrolysis state (magnesium plus ATP, blue; magnesium plus ADP, light blue). The noiseless lines (black) in the F(t) plot (B) show the best fits of Gaussian distance distributions. Tick separation on the vertical axes is 0.1 for V(t) and F(t). C, Gaussian distance distributions yielding best fits to the experimental DEER traces (shown in A) were calculated using DEERAnalysis2011 (33).
FIGURE 7.
FIGURE 7.
Cross-link of BioMNY variants with mono-Cys BioN plus mono-Cys BioY. DTT-reduced samples at a concentration of 500 μg/ml in detergent solution were split, and one half was treated with 5 mm ATP. Cross-linking was initiated by the addition of 4 mm EBS (5 Å), HBS (10 Å), or PBS (25 Å) and stopped by adding 5 mm NEM after 20 min. The samples were subjected to SDS-PAGE, and the gels were stained with Coomassie Blue. The samples of each combination with or without ATP were prepared simultaneously and run on the same gel. The nature of the BioN2 and BioNY cross-link products was verified by parallel Western blotting with antibodies directed against the c-Myc tag on BioN and the FLAG tag on BioY (not shown). At the bottom right are shown the relevant segments in the modeled BioMNY structure.
FIGURE 8.
FIGURE 8.
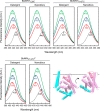
Fluorescence emission spectra of MIANS-labeled BioY variants. Purified solitary BioY (dashed lines) or BioMNY complexes containing the variant BioY (solid lines) (2 μm each) were labeled with 20 μm MIANS in detergent solution for 2 h. Upon removal of excess label by gel filtration, fluorescence emission spectra were recorded at an excitation wavelength of 340 nm. Emission maxima were calculated upon Gaussian deconvolution using PEAKFIT and are indicated. The dotted lines represent DTT-reacted MIANS used as a control in each experiment. A.U., normalized arbitrary units.
FIGURE 9.
FIGURE 9.
Response of fluorescence emission of MIANS-labeled BioMNY complexes to ATP and ATP plus biotin. Purified BioMNY (2 μm) in detergent solution or the equivalent amount of nanodisc-incorporated protein was labeled with 20 μm MIANS for 2 h. Upon removal of excess label by gel filtration and the addition of supplements (none (green), 2 mm ATP (blue), or 2 mm ATP plus 20 mm biotin (red)), fluorescence emission spectra were recorded at an excitation wavelength of 340 nm. Emission maxima were calculated upon Gaussian deconvolution using PEAKFIT. The dotted lines represent DTT-reacted MIANS in detergent solution or in nanodisc buffer. A.U., normalized arbitrary units. The model at the bottom right indicates a potential ATP-induced turn resulting in repositioning of BioYL26 and BioYK137 to a more surface-exposed and of BioNV147 to a more apolar environment. Purple, BioY segments; turquoise, BioN segments.
FIGURE 10.
FIGURE 10.
[3H]biotin capture of nanodisc-incorporated BioMNY in response to ATP binding and hydrolysis. Protein-containing nanodiscs (wild-type BioMNY (solid), Cys-less BioMNY (open), and BioME161QNY (hatched)) were incubated with [3H]biotin, [3H]biotin plus ATP/EDTA, and [3H]biotin plus Mg2+-ATP. The amount of biotin bound to the protein complexes was quantified by liquid scintillation counting. In the absence of ATP (left bar group), 0.09–0.14, 0.30–0.34, and 0.22–0.32 mol of biotin/mol of BioMNY was identified for the wild-type, Cys-less, and BioME161QNY complexes, respectively. The averaged values are defined as 1-fold. Bars with error bars, mean changes of the biotin content (mol of biotin/mol of BioMNY) ± S.D. relative to the ATP-free values in response to treatment with ATP/EDTA and Mg2+-ATP. The values represent the means of double or triple determinations ± S.D. The observed differences are statistically significant (p < 0.05 in paired two-tailed t tests).
FIGURE 11.
FIGURE 11.
Model for BioMNY-catalyzed biotin transport. Binding of ATP (1) to the transporter in its resting state leads to an uplift of BioY without interrupting the physical contact to BioN. Access of biotin to the substrate-binding site in BioY (2) occurs in the ATP-bound state. ATP hydrolysis (3) leads to release of biotin into the cytoplasm; the nucleotide-free system returns into the resting state.

References

    1. Henderson G. B., Zevely E. M., Huennekens F. M. (1979) Mechanism of folate transport in Lactobacillus casei: evidence for a component shared with the thiamine and biotin transport systems. J. Bacteriol. 137, 1308–1314 - PMC - PubMed
    1. Rodionov D. A., Hebbeln P., Gelfand M. S., Eitinger T. (2006) Comparative and functional genomic analysis of prokaryotic nickel and cobalt uptake transporters: evidence for a novel group of ATP-binding cassette transporters. J. Bacteriol. 188, 317–327 - PMC - PubMed
    1. Rodionov D. A., Hebbeln P., Eudes A., ter Beek J., Rodionova I. A., Erkens G. B., Slotboom D. J., Gelfand M. S., Osterman A. L., Hanson A. D., Eitinger T. (2009) A novel class of modular transporters for vitamins in prokaryotes. J. Bacteriol. 191, 42–51 - PMC - PubMed
    1. Eitinger T., Rodionov D. A., Grote M., Schneider E. (2011) Canonical and ECF-type ATP-binding cassette importers in prokaryotes: diversity in modular organization and cellular functions. FEMS Microbiol. Rev. 35, 3–67 - PubMed
    1. Neubauer O., Alfandega A., Schoknecht J., Sternberg U., Pohlmann A., Eitinger T. (2009) Two essential arginine residues in the T components of energy-coupling factor transporters. J. Bacteriol. 191, 6482–6488 - PMC - PubMed

Publication types

MeSH terms