. 2015 Jul;168(3):1076-90.
doi: 10.1104/pp.15.00298. Epub 2015 May 19.

The Rice High-Affinity Potassium Transporter1;1 Is Involved in Salt Tolerance and Regulated by an MYB-Type Transcription Factor

Affiliations

The Rice High-Affinity Potassium Transporter1;1 Is Involved in Salt Tolerance and Regulated by an MYB-Type Transcription Factor

Rong Wang et al. Plant Physiol. 2015 Jul.

Abstract

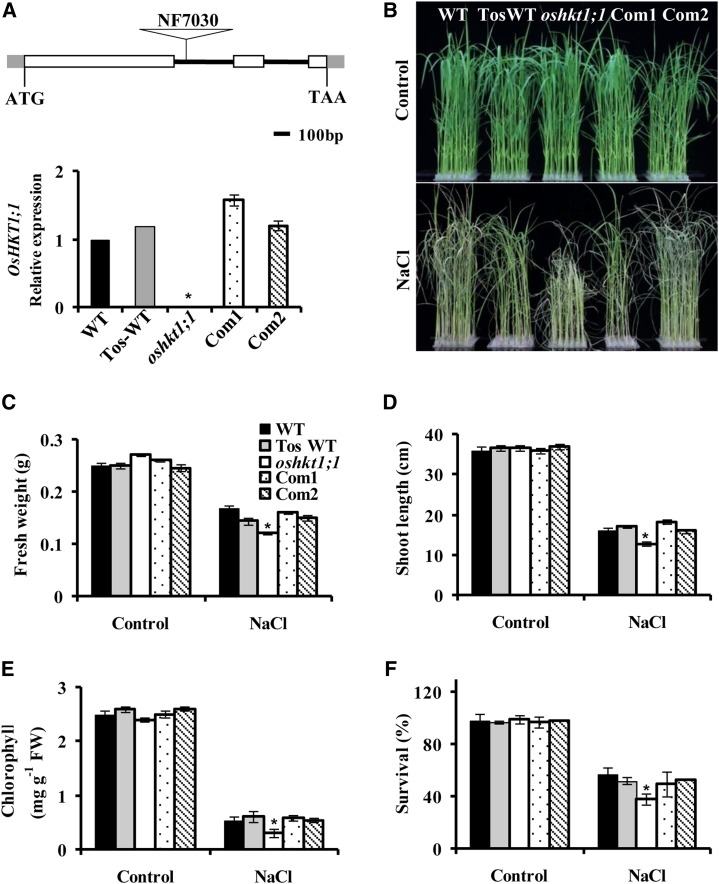
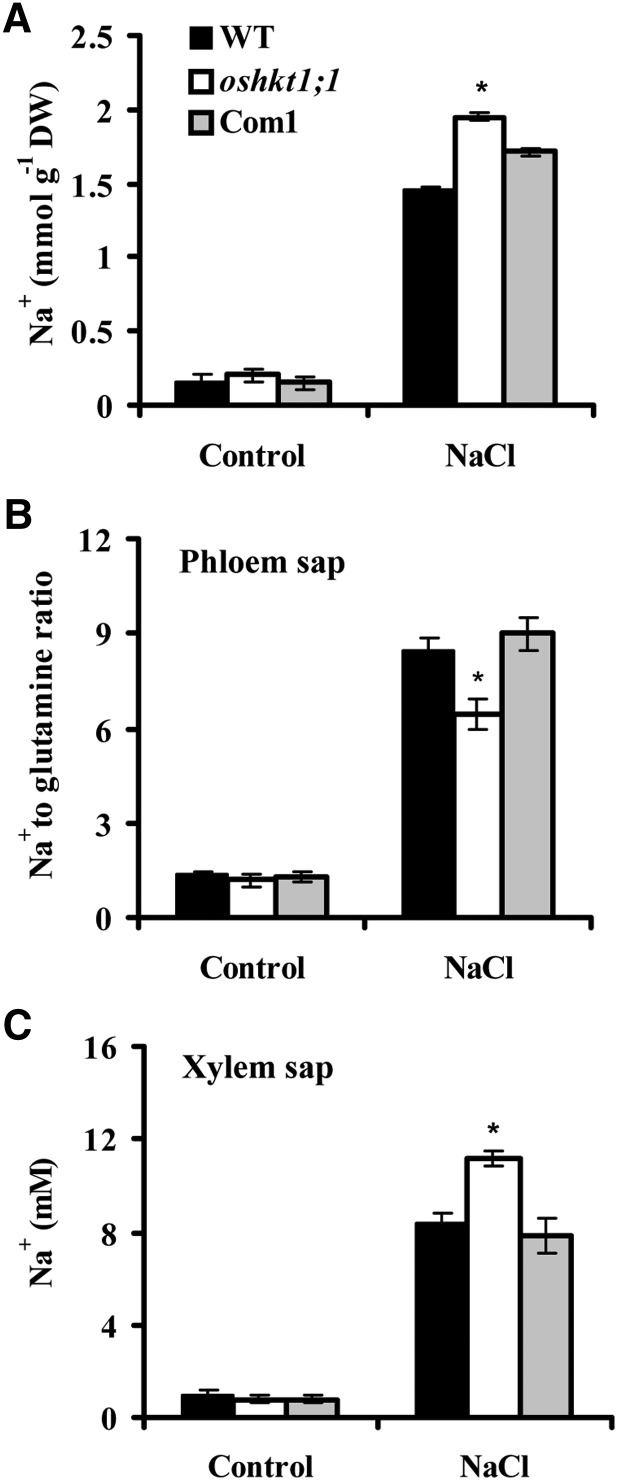
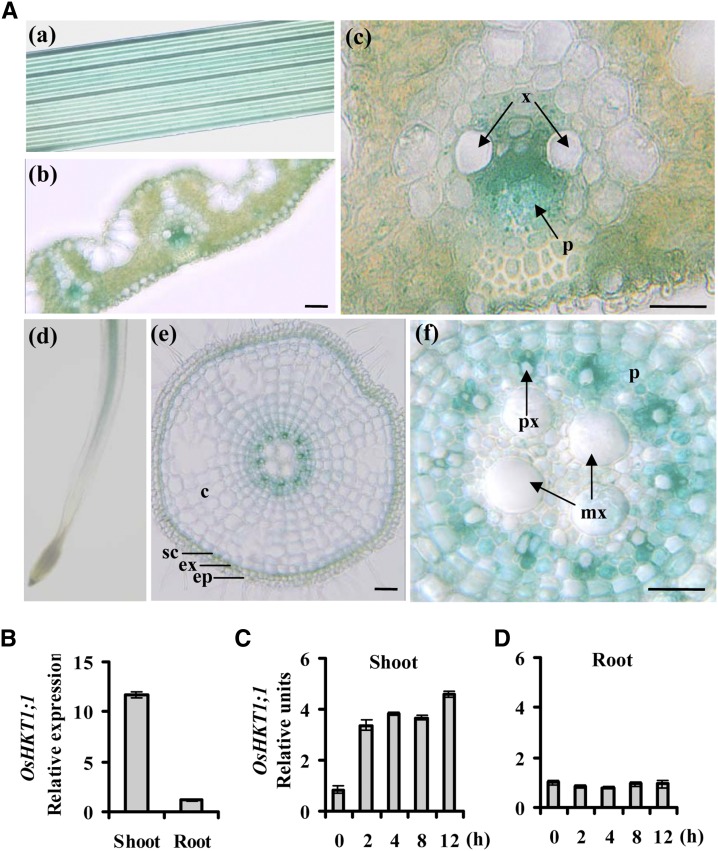
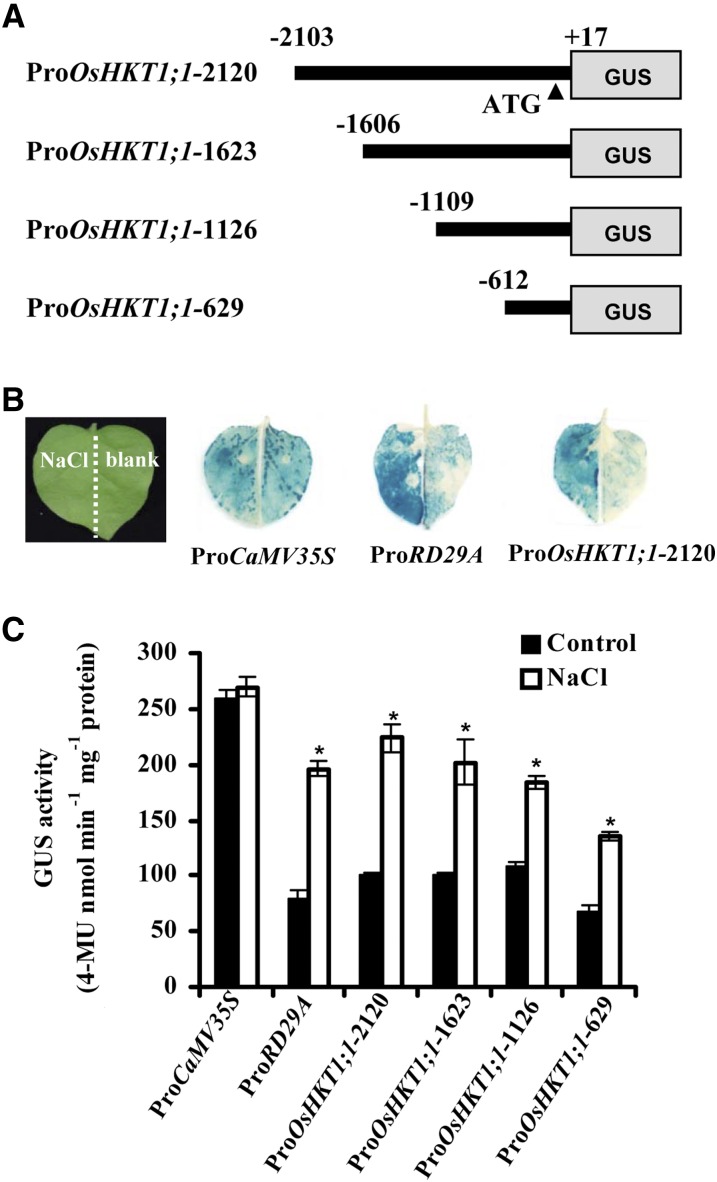
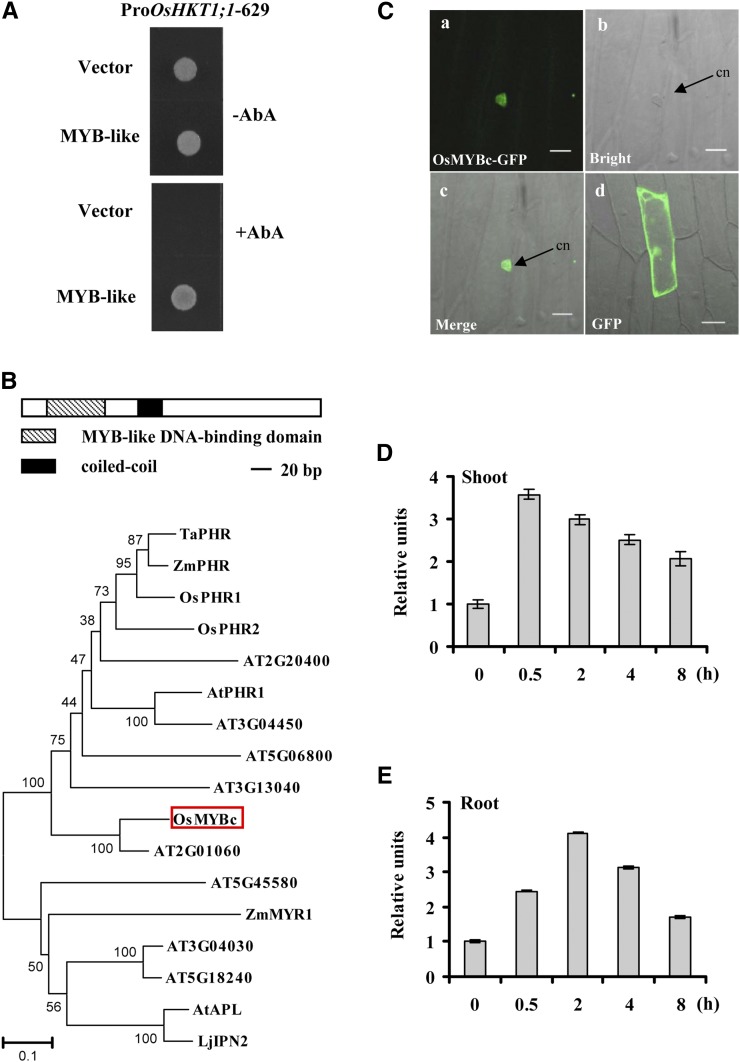
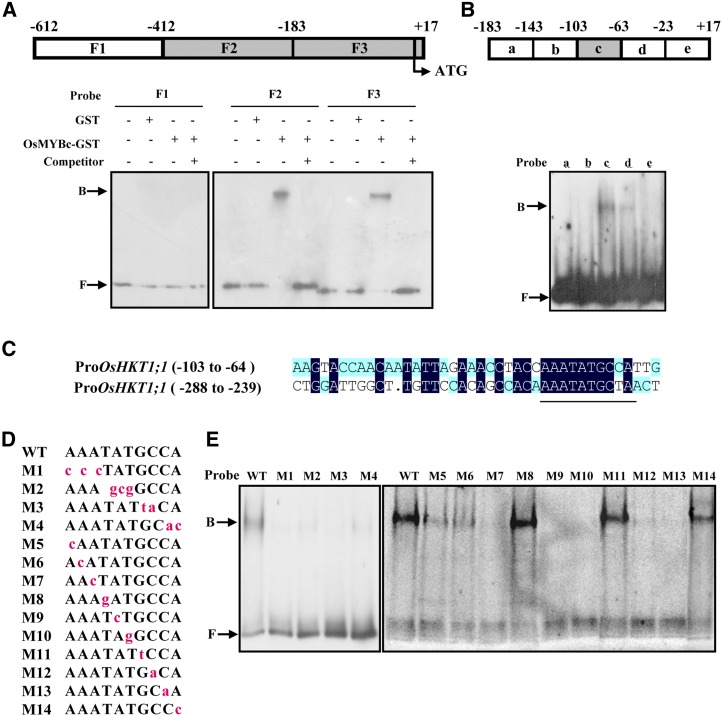
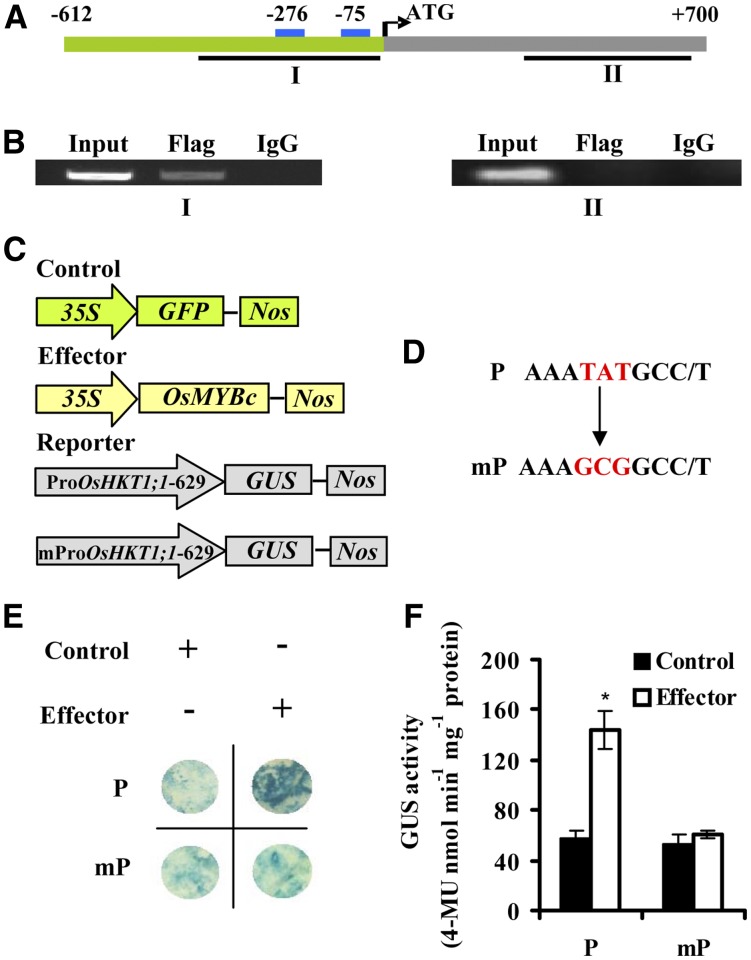
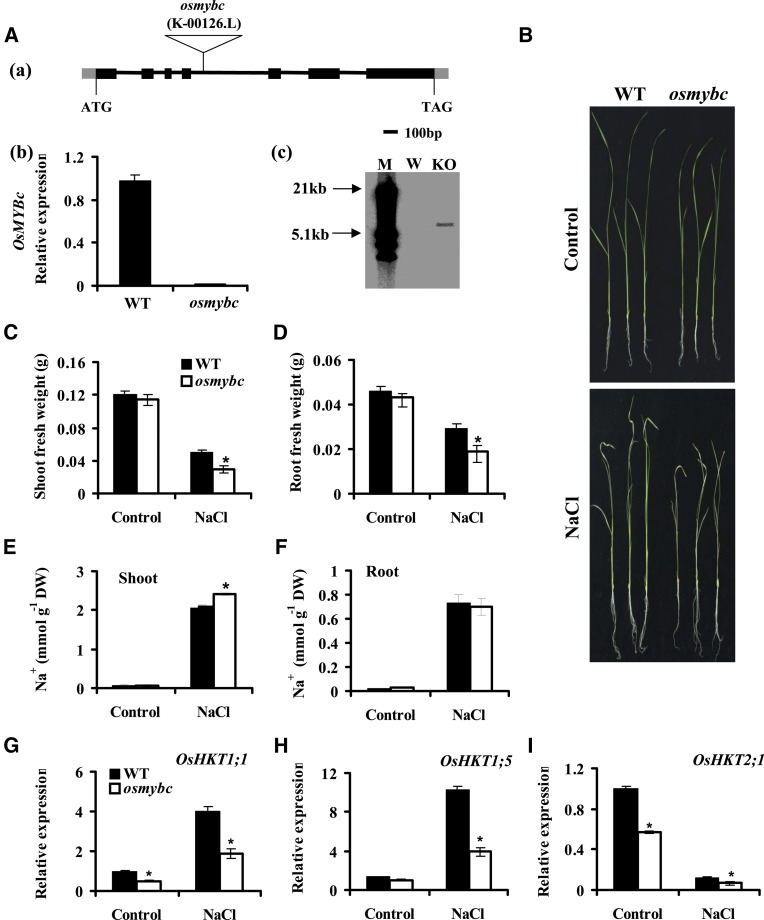
Sodium transporters play key roles in plant tolerance to salt stress. Here, we report that a member of the High-Affinity K(+) Transporter (HKT) family, OsHKT1;1, in rice (Oryza sativa 'Nipponbare') plays an important role in reducing Na(+) accumulation in shoots to cope with salt stress. The oshkt1;1 mutant plants displayed hypersensitivity to salt stress. They contained less Na(+) in the phloem sap and accumulated more Na(+) in the shoots compared with the wild type. OsHKT1;1 was expressed mainly in the phloem of leaf blades and up-regulated in response to salt stress. Using a yeast one-hybrid approach, a novel MYB coiled-coil type transcription factor, OsMYBc, was found to bind to the OsHKT1;1 promoter. In vivo chromatin immunoprecipitation and in vitro electrophoresis mobility shift assays demonstrated that OsMYBc binds to AAANATNC(C/T) fragments within the OsHKT1;1 promoter. Mutation of the OsMYBc-binding nucleotides resulted in a decrease in promoter activity of OsHKT1;1. Knockout of OsMYBc resulted in a reduction in NaCl-induced expression of OsHKT1;1 and salt sensitivity. Taken together, these results suggest that OsHKT1;1 has a role in controlling Na(+) concentration and preventing sodium toxicity in leaf blades and is regulated by the OsMYBc transcription factor.


Figures

Figure 1.
Figure 1.
Knockout of OsHKT1;1 results in salt sensitivity. A, Isolation of homozygous Tos17 insertion mutants of the OsHKT1;1 gene. Top, schematic diagram of the oshkt1;1 mutant. The white boxes stand for exons, the lines stand for introns, and the triangle indicates the Tos17 insertion. Bottom, qRT-PCR analysis of OsHKT1;1 expression in wild-type (WT), TosWT, oshkt1;1 mutant, and OsHKT1;1-COM (Com1 and Com2) plants. Total RNA was extracted from the whole plant. The genes OsUbiquitin5 (OsUBQ5) and 18S Ribosomal RNA (18S rRNA) were used as internal controls. B to E, Phenotypes of wild-type, TosWT, oshkt1;1 mutant, and OsHKT1;1-COM plants under salt stress. Twenty-one-day-old hydroponically grown seedlings were treated with 100 mm NaCl for 7 d. B, Representative photographs of plants. C to E, Fresh weight (C), shoot length (D), and total chlorophyll content (E). The data represent means ± se (n = 40–50 for each line from three replicates). FW, Fresh weight. F, Survival rate of seedlings. Plants were grown under 100 mm NaCl for 7 d and recovered in culture solution without NaCl for an additional 7 d. The data represent means ± se from three biological repeats, each consisting of 50 seedlings of each line. Asterisks indicate statistically significant differences compared with the wild type: *, P < 0.05.
Figure 2.
Figure 2.
Na+ content in rice plants. A, Na+ content in shoots. Hydroponically grown seedlings were treated with 100 mm NaCl for 7 d, and the shoots were harvested for Na+ content assay. Error bars represent se (n = 5). DW, Dry weight. B, The oshkt1;1 mutant plants show a decreased Na+ content in the phloem sap. Seedlings were hydroponically grown in culture solution for 21 d, then for 2 d in culture solution supplemented with 25 mm NaCl, before phloem sap was collected. One sample contained phloem sap from four seedlings. Gln content was used as an internal standard. Error bars represent se (n = 4). C, The oshkt1;1 mutant plants display an increased Na+ concentration in the xylem sap. Seedlings were grown as in B. One sample contained xylem sap from 35 seedlings. Error bars represent se (n = 4). Asterisks indicate statistically significant differences compared with the wild type (WT): *, P < 0.05.
Figure 3.
Figure 3.
Expression pattern of OsHKT1;1 in tissues. A, Expression pattern of OsHKT1;1 promoter-GUS in transgenic plants. a, Leaves. b and c, Cross sections of leaves. GUS activity was detected mainly in vascular tissues of leaves (b). The positions of the phloem (p) and xylem (x) region are indicated by arrows (c). d, Expression of OsHKT1;1 in roots. e and f, Cross sections of roots. GUS activity was detected mainly in stele of root, including phloem and xylem parenchyma cells. c, Cortex; ep, epidermis; ex, exodermis; mx, metaxylem; p, phloem; px, protoxylem; sc, sclerenchyma; x, xylem. Bars = 50 µm. B, Expression pattern of OsHKT1;1 analyzed by qRT-PCR. Error bars represent se (n = 3). C and D, Time-course expression analysis of OsHKT1;1 in response to NaCl (100 mm) treatment. OsHKT1;1 expression in plants without NaCl was used as a reference of the basal expression level. The genes UBQ5 and 18S rRNA were used as internal controls. Error bars represent se (n = 3).
Figure 4.
Figure 4.
Salt stress induces OsHKT1;1 promoter activity. A, The schematic diagram shows the constructs of 5′ terminal deletion mutants of the OsHKT1;1 promoter that are linked with the reporter gene GUS. B, GUS image of N. benthamiana leaves. The N. benthamiana leaves were infiltrated with agrobacterial stains containing constructs with different promoters indicated under the images at right. These leaves were separated into left and right parts as indicated in the image at left. The left part of each leaf was treated with 100 mm NaCl, and the right part was immersed in blank solution for 2 h. The treated leaves were stained with 5-bromo-4-chloro-3-indolyl-β-glucuronic acid and cleared with ethanol. Representative images are shown. C, GUS activity assay of the N. benthamiana leaves indicated in B. Asterisks indicate that the mean value is significantly different from that of the control: *, P < 0.05. Error bars represent se (n = 3). 4-MU, 4-Methylumbelliferone.
Figure 5.
Figure 5.
Characterization of MYBc-like protein. A, MYB-like protein binds the OsHKT1;1 promoter in yeast cells. The OsHKT1;1-629 promoter was linked to the Aureobasidin 1-C reporter gene that confers AbA resistance in yeast cells. The MYB-like gene isolated from the rice cDNA library was cloned and linked to the pGADT7AD vector as effector. After incubating plates on synthetic dropout-Leu plates with or without 250 ng mL−1 AbA for 3 d at 30°C, colonies were visualized. B, Description of OsMYBc. Top, schematic structures of OsMYBc. Bottom, the phylogenetic tree constructed using MEGA4.0 software. Sequences were found on the Phytozome (http://www.phytozome.net/‎), The Arabidopsis Information Resource (http://www.arabidopsis.org/), and the Rice Genomic Annotation Project (http://rice.plantbiology.msu.edu/‎) databases. OsMYBc is boxed. At, Arabidopsis; Lj, Lotus japonicus; Os, rice; Ta, wheat; Zm, maize. C, Localization of OsMYBc protein in onion epidermal cells. Individual images show OsMYBc-GFP (a), bright field (b), merge (c), and GFP alone (d). Bars = 50 µm. cn, Cell nucleus. D and E, Salt stress regulates the expression of OsMYBc. Twenty-one-day-old plants were treated with 100 mm NaCl for 0, 0.5, 2, 4, and 8 h. qRT-PCR was performed by using the cDNA derived from shoots and roots separately. Plants cultured without NaCl were used as a reference of basal expression. The genes UBQ5 and 18S rRNA were used as internal controls. Error bars indicate se (n = 3).
Figure 6.
Figure 6.
EMSA shows OsMYBc binding to specific OsHKT1;1 promoter DNA fragments. A, Top, schematic diagram of the OsHKT1;1 promoter fragment from −612 to +17 bp (translation start is +1) used in EMSA. F1 to F3 regions were prepared by PCR and labeled with digoxigenin. The region that did not bind to OsMYBc is shown as the white box, and those binding to OsMYBc are shown as gray boxes. Bottom, EMSA results. Glutathione S-transferase (GST)-OsMYBc fusion protein was expressed in E. coli. The labeled probes were also competed by excess unlabeled probes (lanes 4, 8, and 12). Arrows show OsMYBc-bound or free probe (B or F, respectively). B, Top, schematic diagram of five segments of the F3 fragment. Bottom, segment c shows binding activity with OsMYBc (lane 3). C, Alignment of the DNA sequence between segment c and a specific region from the F2 fragment. The highly related sequence is underlined. D and E, Identification of the OsMYBc-binding region in the OsHKT1;1 promoter by base mutation analysis. Mutations (M1–M14) in segment c are shown with lowercase letters in red (D). E shows EMSA results. The mutations M1 to M4, M7, M9, M10, M12, and M13 lost the function of binding with OsMYBc; mutations M5 and M6 had reduced binding; and mutations M8, M11, and M14 were not affected in binding. WT, The wild type.
Figure 7.
Figure 7.
OsMYBc binds to the OsHKT1;1 promoter in vivo. A, Structure of the OsHKT1;1 gene. The green bar represents sequence upstream of the start codon, and the gray bar stands for coding regions of OsHKT1;1. The blue boxes indicate the positions of the two OsMYBc-binding elements. The lines below the binding elements and coding region indicate the fragments for ChIP-PCR in B. B, ChIP assay indicates that OsMYBc binds the OsHKT1;1 promoter in vivo. Fragmented chromatin DNA of rice protoplasts expressing the OsMYBc-Flag fusion protein was immunoprecipitated using anti-Flag antibody. Fragment I (−422 to +13) containing two cis-elements was amplified by PCR. Fragment II (+226 to +665) was used as a negative control. Input, Total input chromatin DNA; Flag, DNA precipitated using Flag antibody; IgG, DNA precipitated using mouse IgG. Each assay was repeated more than three times with independent biological materials. C and D, Schematic diagram of the effector and reporter used for transactivation studies. The plasmid 35S:OsMYBc was used as the effector, the plasmid ProOsHKT1;1-629:GUS (P) and its mutant version mProOsHKT1;1-629:GUS (mP) were used as the reporter, and 35S:GFP was used as an internal control. The sequences containing mutated nucleotides are shown in D. E, Transactivation activity was detected by GUS staining after reporter and effector plasmids were coinfiltrated into N. benthamiana. F, Quantitative analysis of the GUS activity indicated in E. Asterisks indicate that the mean value is significantly different from that of the control: *, P < 0.05. Error bars represent se (n = 3). 4-MU, 4-Methylumbelliferone.
Figure 8.
Figure 8.
The osmybc mutant shows sensitivity to salt stress. A, Isolation of the T-DNA insertion osmybc mutant. a, Schematic diagram of the osmybc mutant. The boxes stand for exons, the lines stand for introns, and the triangle indicates the T-DNA insertion position. b, qRT-PCR analysis of OsMYBc expression in the wild type (WT) and osmybc. The cDNA was derived from whole plants. Error bars represent se (n = 3). c, Southern-blot analysis of the T-DNA copy number in osmybc and wild-type plants. Genomic DNA was digested with restriction enzyme HindIII, and the Hygromycin gene was used as a probe. M, Marker; W, the wild type; KO, osmybc knockout mutant. B to D, Phenotypes under salt stress. Hydroponically grown seedlings were treated with 100 mm NaCl for 7 d, and osmybc showed more sensitivity to the salt stress than the wild type (cv Kitaake). B, Representative photographs of seedlings. C, Shoot fresh weight. D, Root fresh weight. The data represent means ± se from three biological repeats, each consisting of 30 seedlings of each line. E and F, Na+ content in shoots (E) and roots (F). Error bars represent se (n = 5). DW, Dry weight. G to I, Expression of OsHKTs. Plants were treated with or without 100 mm NaCl for 24 h. The genes UBQ5 and 18S rRNA were used as internal controls. Error bars represent se (n = 3). Asterisks indicate that the mean value is significantly different from that of the wild type: *, P < 0.05.

Similar articles

Cited by

References

    1. Ali Z, Park HC, Ali A, Oh DH, Aman R, Kropornicka A, Hong H, Choi W, Chung WS, Kim WY, et al. (2012) TsHKT1;2, a HKT1 homolog from the extremophile Arabidopsis relative Thellungiella salsuginea, shows K+ specificity in the presence of NaCl. Plant Physiol 158: 1463–1474 - PMC - PubMed
    1. Apse MP, Aharon GS, Snedden WA, Blumwald E (1999) Salt tolerance conferred by overexpression of a vacuolar Na+/H+ antiport in Arabidopsis. Science 285: 1256–1258 - PubMed
    1. Apse MP, Blumwald E (2007) Na+ transport in plants. FEBS Lett 581: 2247–2254 - PubMed
    1. Baek D, Jiang J, Chung JS, Wang B, Chen J, Xin Z, Shi H (2011) Regulated AtHKT1 gene expression by a distal enhancer element and DNA methylation in the promoter plays an important role in salt tolerance. Plant Cell Physiol 52: 149–161 - PubMed
    1. Bartley LE, Peck ML, Kim SR, Ebert B, Manisseri C, Chiniquy DM, Sykes R, Gao L, Rautengarten C, Vega-Sánchez ME, et al. (2013) Overexpression of a BAHD acyltransferase, OsAt10, alters rice cell wall hydroxycinnamic acid content and saccharification. Plant Physiol 161: 1615–1633 - PMC - PubMed

Publication types

MeSH terms

LinkOut - more resources