. 2015 Jul;200(3):781-94.
doi: 10.1534/genetics.115.178020. Epub 2015 May 18.

Parasexual Ploidy Reduction Drives Population Heterogeneity Through Random and Transient Aneuploidy in Candida albicans

Affiliations

Parasexual Ploidy Reduction Drives Population Heterogeneity Through Random and Transient Aneuploidy in Candida albicans

Meleah A Hickman et al. Genetics. 2015 Jul.

Abstract

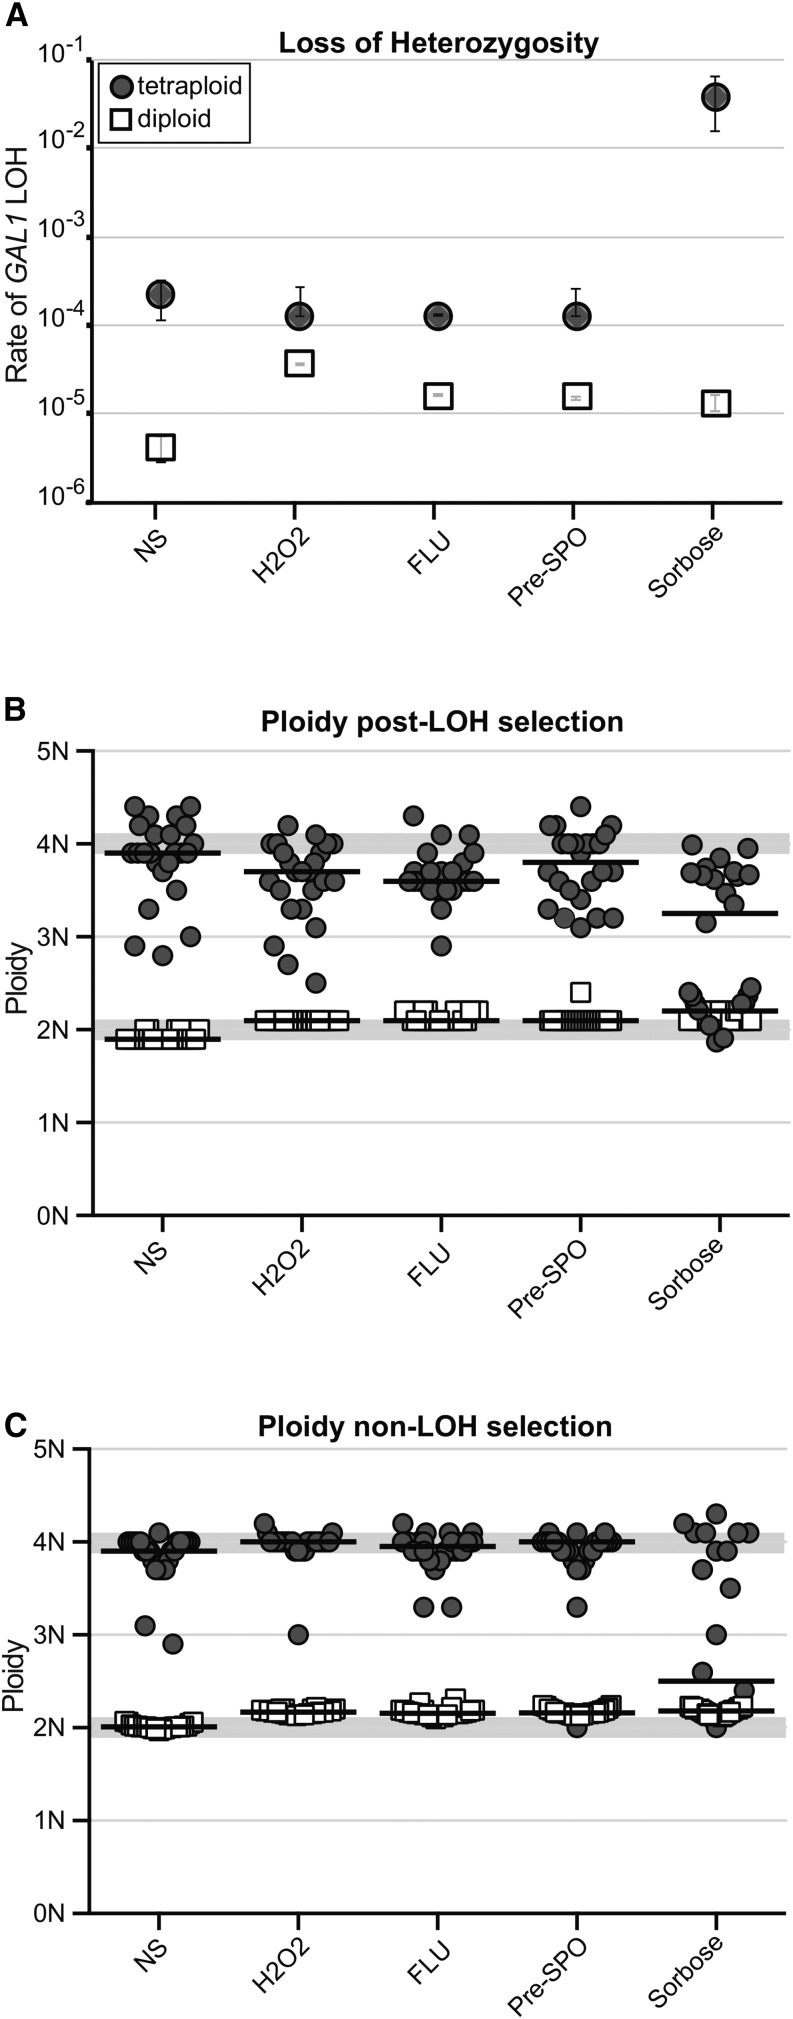
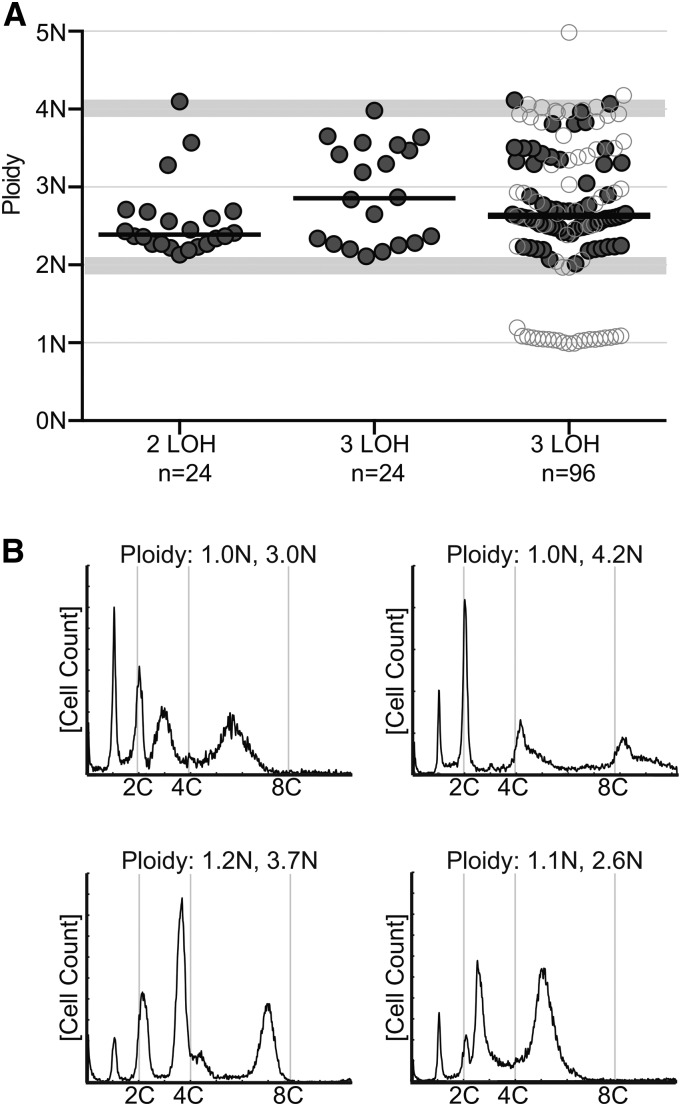
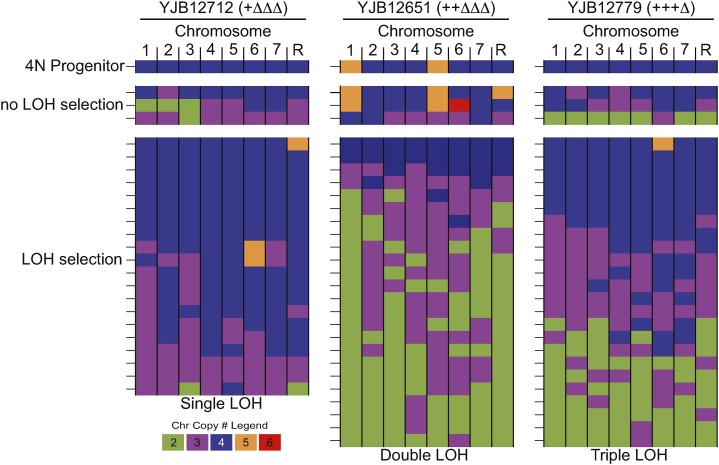
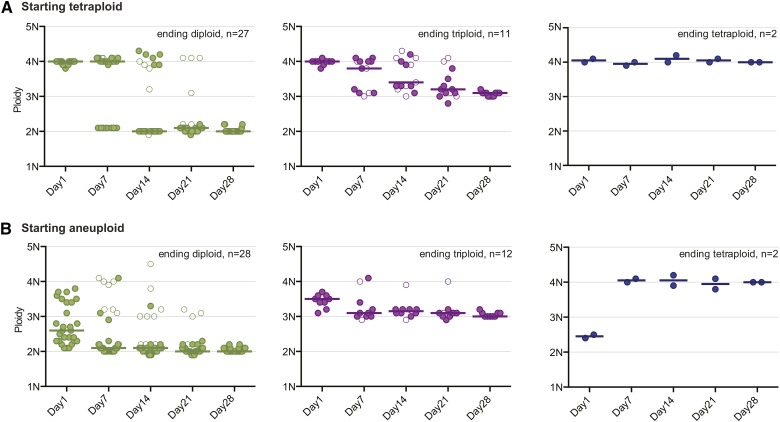
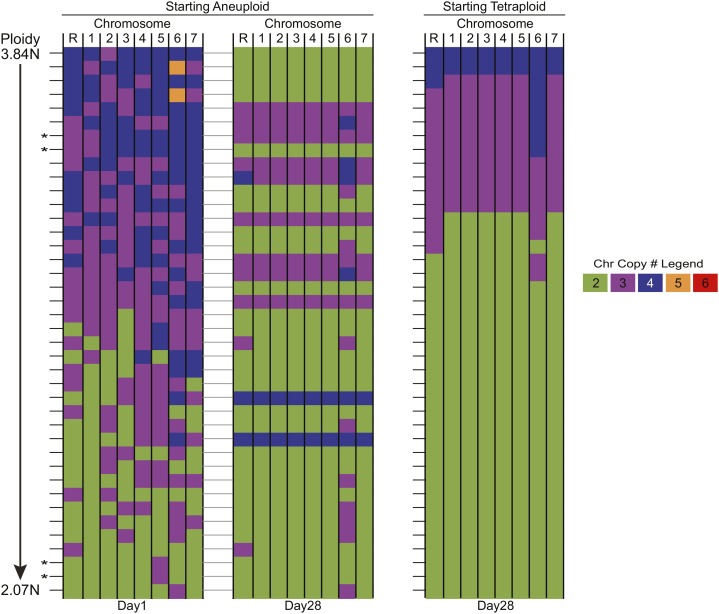
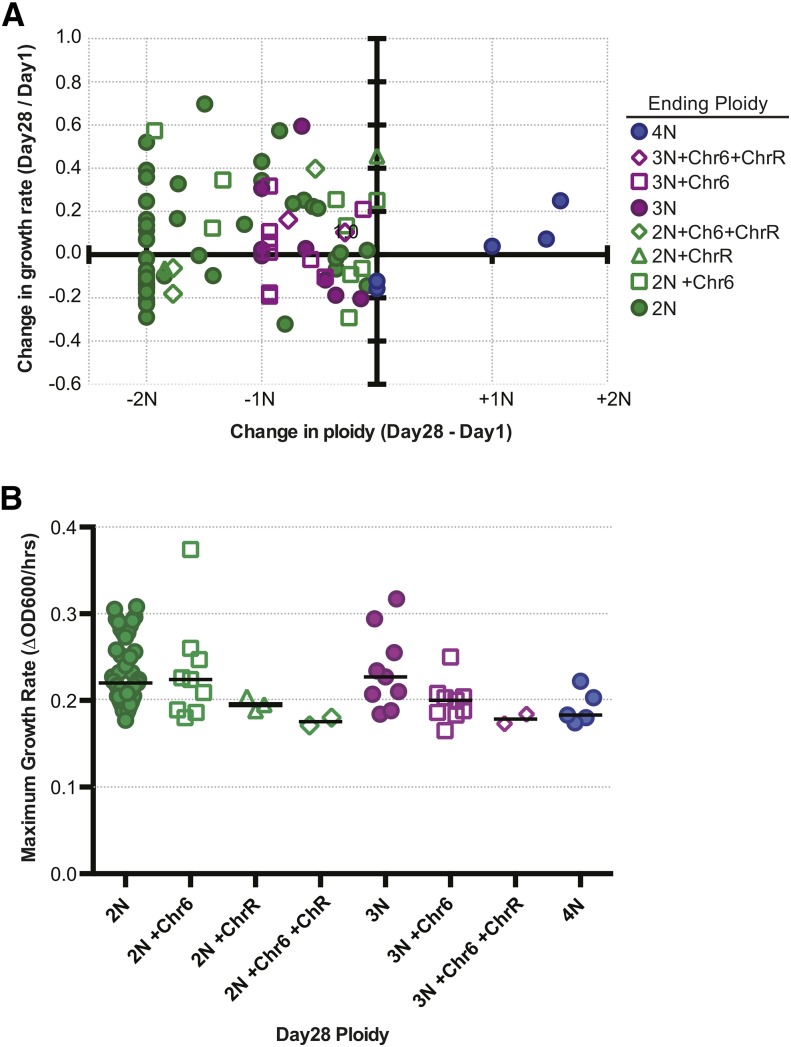
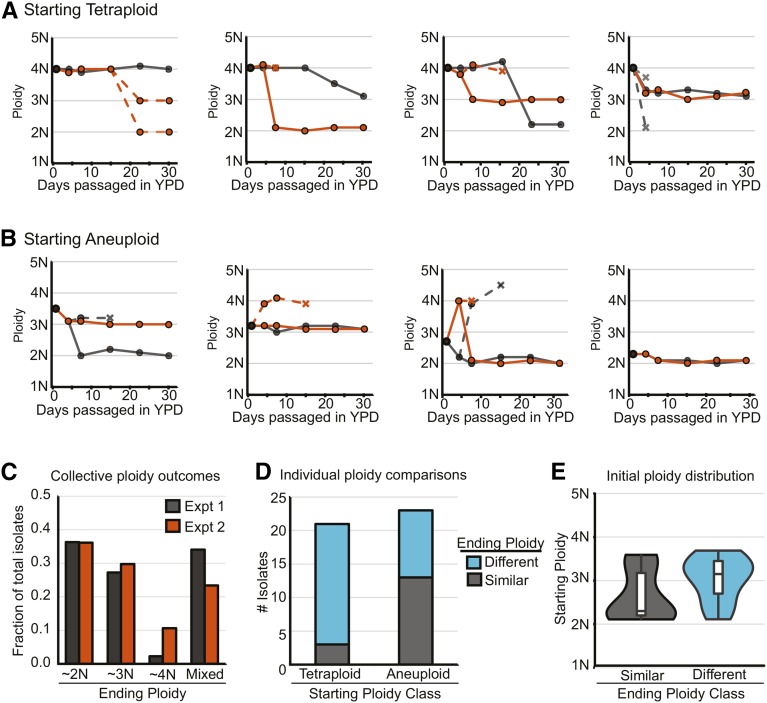
The opportunistic pathogen Candida albicans has a large repertoire of mechanisms to generate genetic and phenotypic diversity despite the lack of meiosis in its life cycle. Its parasexual cycle enables shifts in ploidy, which in turn facilitate recombination, aneuploidy, and homozygosis of whole chromosomes to fuel rapid adaptation. Here we show that the tetraploid state potentiates ploidy variation and drives population heterogeneity. In tetraploids, the rate of losing a single heterozygous marker [loss of heterozygosity (LOH)] is elevated ∼30-fold higher than the rate in diploid cells. Furthermore, isolates recovered after selection for LOH of one, two, or three markers were highly aneuploid, with a broad range of karyotypes including strains with a combination of di-, tri-, and tetrasomic chromosomes. We followed the ploidy trajectories for these tetraploid- and aneuploid-derived isolates, using a combination of flow cytometry and double-digestion restriction-site-associated DNA analyzed with next-generation sequencing. Isolates derived from either tetraploid or aneuploid isolates predominately resolved to a stable euploid state. The majority of isolates reduced to the conventional diploid state; however, stable triploid and tetraploid states were observed in ∼30% of the isolates. Notably, aneuploid isolates were more transient than tetraploid isolates, resolving to a euploid state within a few passages. Furthermore, the likelihood that a particular isolate will resolve to the same ploidy state in replicate evolution experiments is only ∼50%, supporting the idea that the chromosome loss process of the parasexual cycle is random and does not follow trajectories involving specific combinations of chromosomes. Together, our results indicate that tetraploid progenitors can produce populations of progeny cells with a high degree of genomic diversity, from altered ploidy to homozygosis, providing an excellent source of genetic variation upon which selection can act.

Keywords: parasex; ploidy; yeast.


Figures

Figure 1
Figure 1
Tetraploid cells are highly unstable. (A) Rate of GAL1 marker loss by fluctuation analysis for diploid (DSY919, open squares) and tetraploid (YJB12712, shaded circles) strains when grown overnight in YPD (“NS,” no stress), YPD + 5 mM H2O2 (“H2O2”), YPD + 1 μg/ml fluconazole (“FLU”), YPD with 20% glucose (“Pre-SPO,” initially described in Bennett and Johnson 2003), or media containing 2% L-sorbose (“Sorbose”) as the carbon source. At least two independent fluctuation analyses were performed per strain; error bars indicate the standard deviation. (B) Ploidy analysis of 24 single colonies following LOH selection (isolated from 2-DOG media) for the diploid and tetraploid strains in A. The ploidies for individual colonies isolated from each strain and condition are displayed as symbols and the median for each strain and condition is indicated with a solid bar. The regions with light shading indicate the ploidy range for diploid and tetraploid. (C) Ploidy analysis of 24 single colonies with no LOH selection (isolated from YPD media) for diploid and tetraploid strains. Data are displayed as in B.
Figure 2
Figure 2
Ploidy reduction in double and triple LOH isolates. (A) Ploidy analysis of 24 single colonies following double (2 LOH; n = 24, YJB12651) or triple LOH (3 LOH; n = 24, YJB12779) or 96 single colonies following triple LOH (3 LOH; n = 96, YJB12779) selection (isolated from 2-DOG media). Data are displayed as in Figure 1. Isolates with a single ploidy are displayed as shaded circles and isolates with multiple-ploidy subpopulations are displayed as open circles. The median for each strain and experiment is indicated with the solid bar. The regions with light shading indicate the ploidy range for diploid and tetraploid. (B) Selected representative flow cytometry profiles of isolates with haploid subpopulations from A (3 LOH, n = 96).
Figure 3
Figure 3
Karyotype analysis following LOH selection. Shown is a summary of ddRAD-seq analysis of chromosomal copy number for the progenitor tetraploid strains (left, YJB12712; center, YJB12651; right, YJB12779), non-LOH isolates (n = 3 for every strain background), and the complete collection of LOH isolates (left, YJB12712, n = 20; center, YJB12651, n = 24; right, YJB12712, n = 24) from each of these strains. Every line indicates a unique derived isolate where the eight Candida chromosomes are aligned horizontally and copy number is colored as indicated in the legend.
Figure 4
Figure 4
Long-term ploidy dynamics of tetraploid and aneuploid isolates. Isolates that were initially (A) tetraploid or (B) aneuploid were serially transferred daily in liquid YPD for 28 days. Flow cytometry for DNA content was performed for each isolate on days 7, 14, 21, and 28. Ploidy values for day 1 are the same data presented in Figure 1 and Figure 2 (now organized as either starting tetraploid or aneuploid). Ploidy plots are divided into three classes: ending diploid (green), ending triploid (purple), or ending tetraploid (blue). As in Figure 2, isolates with a single ploidy are displayed as colored solid circles and isolates with multiple-ploidy subpopulations are displayed as colored open circles. The median for each class at every time point is indicated with a bar.
Figure 5
Figure 5
Karyotype analysis after long-term passaging. Shown is a summary of ddRAD-seq chromosome copy number analysis for (left and center) individual isolates starting aneuploid (n = 37) on day 1 (left, same as in Figure 3, now ordered by decreasing ploidy) and those same isolates on day 28 (center, connected by dashed line) and for (right) isolates starting tetraploid on day 28 (n = 37) of passaging in YPD. Tetraploid isolates on day 1 are not represented here since they were all euploid and similar in chromosomal copy number. Data are presented as in Figure 3.
Figure 6
Figure 6
Fitness consequences of ploidy reduction and aneuploidy for growth in YPD. (A) XY scatterplot of the change in ploidy (x-axis, calculated by subtracting day 28 from day 1) and the corresponding change in growth rate (y-axis, day 28 divided by day 1). The color and shape of the symbols indicate the final ploidy state on day 28 as described in the key. (B) Growth rates of day 28 isolates grouped by final karyotype. Each symbol represents a single isolate and the bar indicates the median value.
Figure 7
Figure 7
Ploidy potential of tetraploid and aneuploid cells. (A and B) Examples of individual ploidy trajectories for (A) tetraploid and (B) aneuploid isolates that were repassaged for 28 days (black, “experiment 1”; orange, “experiment 2”). Dashed lines indicate time points with multiple ploidy subpopulations and X’s represent ploidy subpopulations that became extinct (were not observed in subsequent passages of the same individual culture). (C) The percentage of total isolates (including both the starting tetraploid and aneuploid collections) that on day 28 are near diploid, triploid, or tetraploid or have multiple-ploidy subpopulations (“Mixed”). (D) The number of isolates that when compared individually between experiments 1 and 2 either have the same ploidy resolution (gray, “Similar”) or do not (blue, “Different”) for the tetraploid and aneuploid collections. (E) Violin and box plots of the initial ploidy for aneuploid isolates that had similar (gray) or different (teal) ending ploidy resolutions in experiments 1 and 2. The median ploidy for each class is displayed as a black bar.

References

    1. Abbey D., Hickman M., Gresham D., Berman J., 2011. A high resolution hapmap based on SNP/CGH combined microarrays reveal that loss of heterozygosity as well as aneuploidy accumulate in C. albicans laboratory strains. G3 1: 523–530. - PMC - PubMed
    1. Abbey D. A., Funt J., Lurie-Weinberger M. N., Thompson D. A., Regev A., et al. , 2014. YMAP: a pipeline for visualization of copy number variation and loss of heterozygosity in eukaryotic pathogens. Genome Med. 6: 100. - PMC - PubMed
    1. Ahmad A., Kravets A., Rustchenko E., 2012. Transcriptional regulatory circuitries in the human pathogen Candida albicans involving sense–antisense interactions. Genetics 190: 537–547. - PMC - PubMed
    1. Alabrudzinska M., Skoneczny M., Skoneczna A., 2011. Diploid-specific genome stability genes of S. cerevisiae: genomic screen reveals haploidization as an escape from persisting DNA rearrangement stress. PLoS ONE 6: e21124. - PMC - PubMed
    1. Alby K., Bennett R. J., 2009. Stress-induced phenotypic switching in Candida albicans. Mol. Biol. Cell 20: 3178–3191. - PMC - PubMed

Publication types