

The role of wall shear stress in the assessment of right ventricle hydraulic workload
- PMID: 25992274
- PMCID: PMC4405718
- DOI: 10.1086/679703
The role of wall shear stress in the assessment of right ventricle hydraulic workload
Abstract
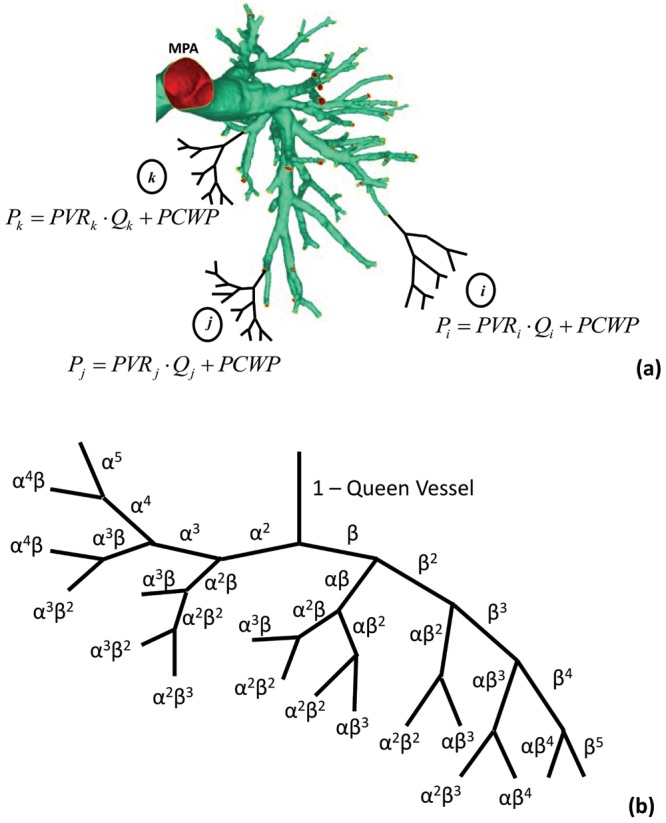
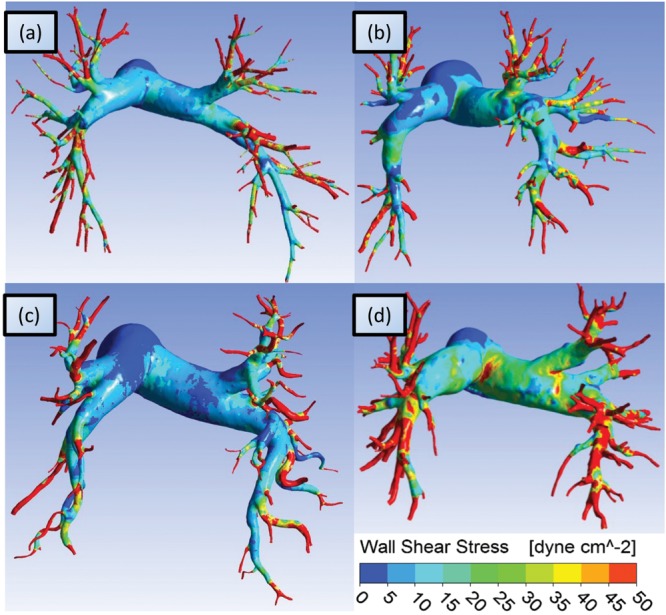
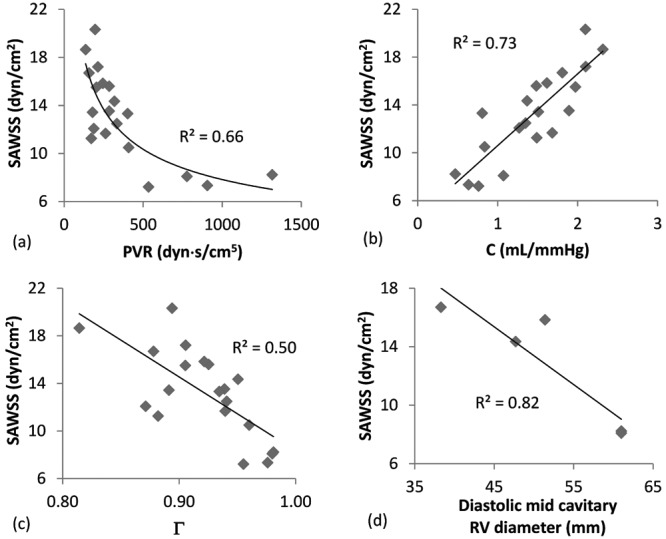
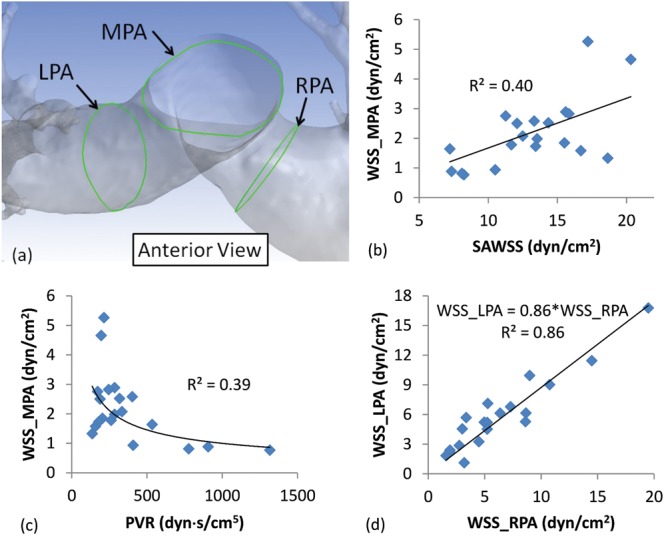
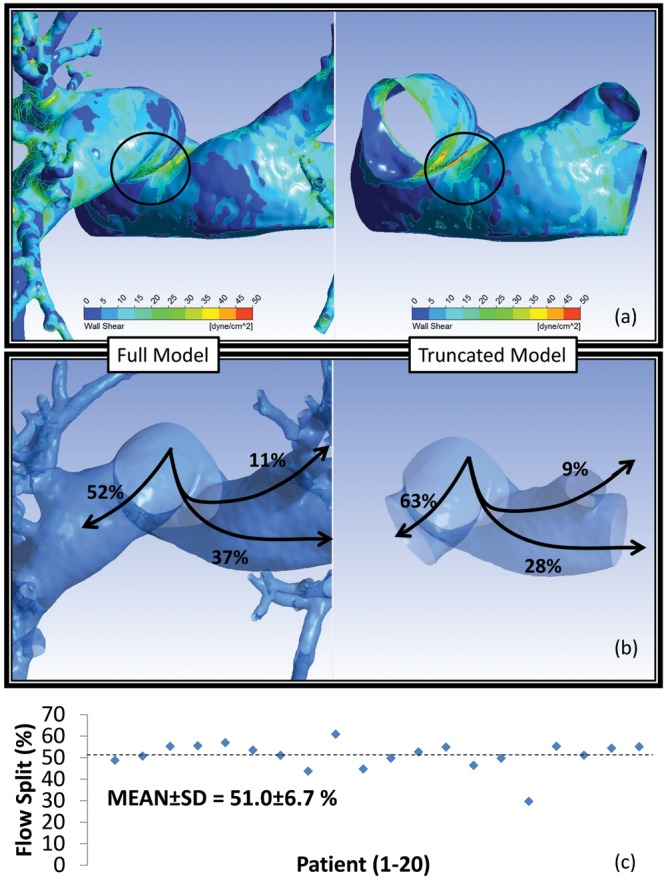
Pulmonary hypertension (PH) is a devastating disease affecting approximately 15-50 people per million, with a higher incidence in women. PH mortality is mostly attributed to right ventricle (RV) failure, which results from RV hypotrophy due to an overburdened hydraulic workload. The objective of this study is to correlate wall shear stress (WSS) with hemodynamic metrics that are generally accepted as clinical indicators of RV workload and are well correlated with disease outcome. Retrospective right heart catheterization data for 20 PH patients were analyzed to derive pulmonary vascular resistance (PVR), arterial compliance (C), and an index of wave reflections (Γ). Patient-specific contrast-enhanced computed tomography chest images were used to reconstruct the individual pulmonary arterial trees up to the seventh generation. Computational fluid dynamics analyses simulating blood flow at peak systole were conducted for each vascular model to calculate WSS distributions on the endothelial surface of the pulmonary arteries. WSS was found to be decreased proportionally with elevated PVR and reduced C. Spatially averaged WSS (SAWSS) was positively correlated with PVR (R (2) = 0.66), C (R (2) = 0.73), and Γ (R (2) = 0.5) and also showed promising preliminary correlations with RV geometric characteristics. Evaluating WSS at random cross sections in the proximal vasculature (main, right, and left pulmonary arteries), the type of data that can be acquired from phase-contrast magnetic resonance imaging, did not reveal the same correlations. In conclusion, we found that WSS has the potential to be a viable and clinically useful noninvasive metric of PH disease progression and RV health. Future work should be focused on evaluating whether SAWSS has prognostic value in the management of PH and whether it can be used as a rapid reactivity assessment tool, which would aid in selection of appropriate therapies.
Keywords: computational fluid dynamics; pulmonary hypertension; pulmonary vascular resistance; right ventricle; wall shear stress.
Figures
References
-
- Badesch DB, Raskob GE, Elliott CG, Krichman AM, Farber HW, Frost AE, Barst RJ, et al. Pulmonary arterial hypertension: baseline characteristics from the REVEAL registry. Chest 2010;137(2):376–387. - PubMed
-
- van de Veerdonk MC, Kind T, Marcus JT, Mauritz G-J, Heymans MW, Bogaard H-J, Boonstra A, Marques KMJ, Westerhof N, Vonk-Noordegraaf A. Progressive right ventricular dysfunction in patients with pulmonary arterial hypertension responding to therapy. J Am Coll Cardiol 2011;58(24):2511–2519. - PubMed
-
- Galiè N, Hoeper MM, Humbert M, Torbicki A, Vachiéry J-L, Barbera JA, Beghetti M, et al. Guidelines for the diagnosis and treatment of pulmonary hypertension: the Task Force for the Diagnosis and Treatment of Pulmonary Hypertension of the European Society of Cardiology (ESC) and the European Respiratory Society (ERS), endorsed by the International Society of Heart and Lung Transplantation (ISHLT). Eur Heart J 2009;30(20):2493–2537. - PubMed
-
- Benza RL, Gomberg-Maitland M, Miller DP, Frost A, Frantz RP, Foreman AJ, Badesch DB, McGoon MD. The REVEAL registry risk score calculator in patients newly diagnosed with pulmonary arterial hypertension. Chest 2012;141(2):354–362. - PubMed
-
- Benza RL, Miller DP, Barst RJ, Badesch DB, Frost AE, McGoon MD. An evaluation of long-term survival from time of diagnosis in pulmonary arterial hypertension from the REVEAL registry. Chest 2012;142(2):448–456. - PubMed
LinkOut - more resources
Full Text Sources
Other Literature Sources
Research Materials
