. 2015 May 19:3:18.
doi: 10.1186/s40425-015-0063-3. eCollection 2015.

NK cells and CD8+ T cells cooperate to improve therapeutic responses in melanoma treated with interleukin-2 (IL-2) and CTLA-4 blockade

Affiliations

NK cells and CD8+ T cells cooperate to improve therapeutic responses in melanoma treated with interleukin-2 (IL-2) and CTLA-4 blockade

Frederick J Kohlhapp et al. J Immunother Cancer. .

Abstract

Background: Melanoma is one of the few types of cancer with an increasing annual incidence. While a number of immunotherapies for melanoma have been associated with significant clinical benefit, including high-dose IL-2 and cytotoxic T lymphocyte antigen 4 (CTLA-4) blockade, clinical response to either of these single agents has been limited to 11-20% of treated patients. Therefore, in this study, we sought to test the hypothesis that the combination of IL-2 and CTLA-4 blockade could mediate a more profound therapeutic response.

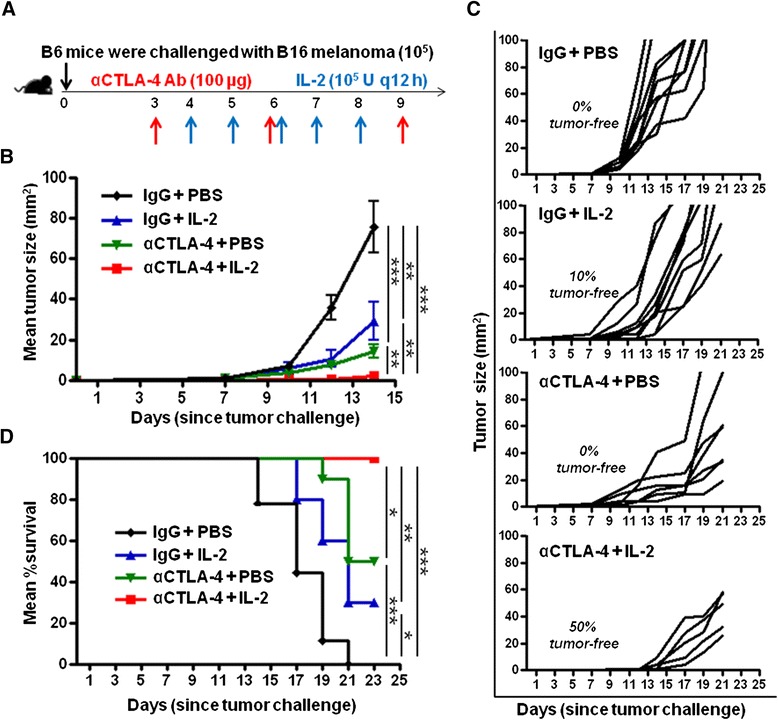
Methods: Here, B6 mice were challenged with poorly immunogenic B16 melanoma on day 0, and treated with CTLA-4 blocking antibody (100 μg/mouse) on days 3, 6, and 9, and IL-2 (100,000 units) twice daily on days 4-8, or both.

Results: A highly significant synergistic effect that delayed tumor growth and prolonged survival was demonstrated with the combination immunotherapy compared to either monotherapy alone. The therapeutic effect of combination immunotherapy was dependent on both CD8+ T and NK cells and co-depletion of these subsets (but not either one alone) abrogated the therapeutic effect. CTLA-4 blockade increased immune cell infiltration (including CD8+ T cells and NK cells) in the tumor and IL-2 reduced the proportion of highly differentiated/exhausted tumor-infiltrating NK cells.

Conclusions: These results have implications for the design of clinical trials in patients with metastatic melanoma and provide new insights into how the immune system may be mediating anti-tumor activity with combination IL-2 and CTLA-4 blockade in melanoma.

Keywords: CD8+ T cells; CTLA-4; Immunotherapy; Interleukin-2; NK cells.


Figures

Figure 1
Figure 1
Combination IL-2 and CTLA-4 blockade immunotherapy results in reduced tumor growth and prolonged survival. (A) Schematic of the experimental design. (B) Cumulative graph of mean tumor size (mm2) per group from experiment described in (A). (C) Tumor size (mm2) of individual mice in each group from experiment described in (A). (D) Cumulative graph of mean percent (%) survival per group from experiment described in (A). Seven to ten mice were included in each group. Graphs represent one experiment of six conducted with similar results. *P < 0.05, **P < 0.001, ***P < 0.001, ns = not significant.
Figure 2
Figure 2
Combination IL-2 and CTLA-4 blockade immunotherapy increases tumor immune infiltration. (A) Flow cytometry plots of tumors dissected at day 14 and analyzed by flow cytometry for CD45 expression from the experiment described in Figure 1A. Only tumor-infiltrating lymphocytes were analyzed (as determined by comparison of intravenous CD45 staining compared to in vitro CD45 staining). (B) Cumulative graph showing mean percent CD45+ T cell infiltration (of live cells) in the tumor from three independent experiments described in (A). (C) Representative immunofluorescence microscopy images of CD45 (red) and DAPI (4′,6-diamidino-2-phenylindole; blue) staining of tumors from experiment in (A). Scale bars = 20 microns. Three to five mice were included in each group per experiment. *P < 0.05, ***P < 0.001, ns = not significant.
Figure 3
Figure 3
Combination IL-2 and CTLA-4 blockade immunotherapy increases the proportion of tumor-infiltrating CD8+ T cells. (A) Flow cytometry plots of tumors dissected at day 14 and analyzed for CD3 + CD8+ T cells (of CD45+ cells within the tumor) by flow cytometry from the experiment described in Figure 1A. (B) Cumulative graph showing the mean percent of CD3 + CD8+ T cells from experiment in (A). (C) Cumulative graph showing the mean percent of CD3 + CD8+ T cells in the tumor-draining lymph nodes from experiment in (A). (D) Representative histograms showing expression of cell markers from CD3 + CD8+ T cells in the tumor and from a representative tumor-draining lymph node (LN). Numbers represent mean fluorescence intensity (MFI). (E) Cumulative graph of mean percent of CD3 + CD8+ T cells expressing PD-1 from experiment in (A). Cumulative figures are from at least three independent experiments (with 3–5 mice per group in each experiment). *P < 0.05, ** P < 0.01, ns = not significant.
Figure 4
Figure 4
Combination IL-2 and CTLA-4 blockade immunotherapy increases the proportion of tumor-infiltrating Tregs. (A) Flow cytometry plots of tumors dissected at day 14 and analyzed for regulatory CD4 + Foxp3+ T cells (Tregs; of CD45 + CD3+ cells within the tumor) by flow cytometry from the experiment described in Figure 1A. (B) Cumulative graph showing mean percent of Tregs from experiment in (A). (C) Ratio of CD8+ T cells to Tregs in the tumor from experiment in (A). (D) Cumulative graph showing mean percent of Tregs from the tumor-draining lymph nodes from experiment in (A). (E) Ratio of CD8+ T cells to Tregs in the tumor-draining lymph node from experiment in (A). Cumulative figures are from at least three independent experiments (with 3–5 mice per group in each experiment). *P < 0.05, **P < 0.01, ns = not significant.
Figure 5
Figure 5
Combination IL-2 and CTLA-4 blockade immunotherapy increases the proportion and changes the differentiation of tumor-infiltrating NK cells. (A) Flow cytometry plots of tumors dissected at day 14 and analyzed for the proportion of NK cells (of CD45 + CD3- cells within the tumor) by flow cytometry from the experiment described in Figure 1A. (B) Cumulative graph showing mean percent of NK cells from experiment in (A). (C) Cumulative graph showing mean percent of NK cells from the tumor-draining lymph nodes from experiment in (A). (D) Representative histograms showing expression of cell markers by NK cells in the tumor and from a representative tumor-draining lymph node (LN). Numbers represent mean fluorescence intensity (MFI). (E) Flow cytometry plots showing expression of CD27 and CD11b on tumor-infiltrating NK cells from experiment in (A). Cumulative figures are from at least three independent experiments (with 3–5 mice per group in each experiment). *P < 0.05, **P < 0.01, ns = not significant.
Figure 6
Figure 6
NK and CD8+ T cells are necessary for combination IL-2 and CTLA-4 blockade immunotherapy-mediated effects. (A) Schematic of the experimental design. (B) Cumulative graph of the mean tumor size (mm2) per group after CD8 or NK cell depletion (left panel) and B cell or CD4+ cell depletion (right panel) from the experiment described in (A). (C) Cumulative graph of the mean tumor size (mm2) per group after combination CD8 and NK cell depletion from the experiment described in (A). (D) Tumor size (mm2) of individual mice in each group from experiment described in (C). Four to ten mice were included in each group. Graphs represent one experiment of three conducted with similar results. *P < 0.05, **P < 0.001, ***P < 0.001, ns = not significant.

References

    1. Mrazek AA, Chao C. Surviving cutaneous melanoma: a clinical review of follow-up practices, surveillance, and management of recurrence. Surg Clin North Am. 2014;94(5):989–1002. doi: 10.1016/j.suc.2014.07.003. - DOI - PMC - PubMed
    1. Antonia SJ, Larkin J, Ascierto PA. Immuno-oncology Combinations: A Review of Clinical Experience and Future Prospects. Clini Cancer Res. 2014. doi:10.1158/1078-0432.CCR-14-1457. - PubMed
    1. Das Thakur M, Stuart DD. Molecular pathways: response and resistance to BRAF and MEK inhibitors in BRAF(V600E) tumors. Clin Cancer Res. 2014;20(5):1074–80. doi: 10.1158/1078-0432.CCR-13-0103. - DOI - PubMed
    1. Chapman PB, Hauschild A, Robert C, Haanen JB, Ascierto P, Larkin J, et al. Improved survival with vemurafenib in melanoma with BRAF V600E mutation. N Engl J Med. 2011;364(26):2507–16. doi: 10.1056/NEJMoa1103782. - DOI - PMC - PubMed
    1. Robert C, Karaszewska B, Schachter J, Rutkowski P, Mackiewicz A, Stroiakovski D et al. Improved Overall Survival in Melanoma with Combined Dabrafenib and Trametinib. N Engl J Med. 2014. doi:10.1056/NEJMoa1412690. - PubMed

LinkOut - more resources