Meta-Analysis
. 2015 May 20:5:10035.
doi: 10.1038/srep10035.

Atlas of tissue renin-angiotensin-aldosterone system in human: A transcriptomic meta-analysis

Affiliations
Meta-Analysis

Atlas of tissue renin-angiotensin-aldosterone system in human: A transcriptomic meta-analysis

Ali Nehme et al. Sci Rep. .

Abstract

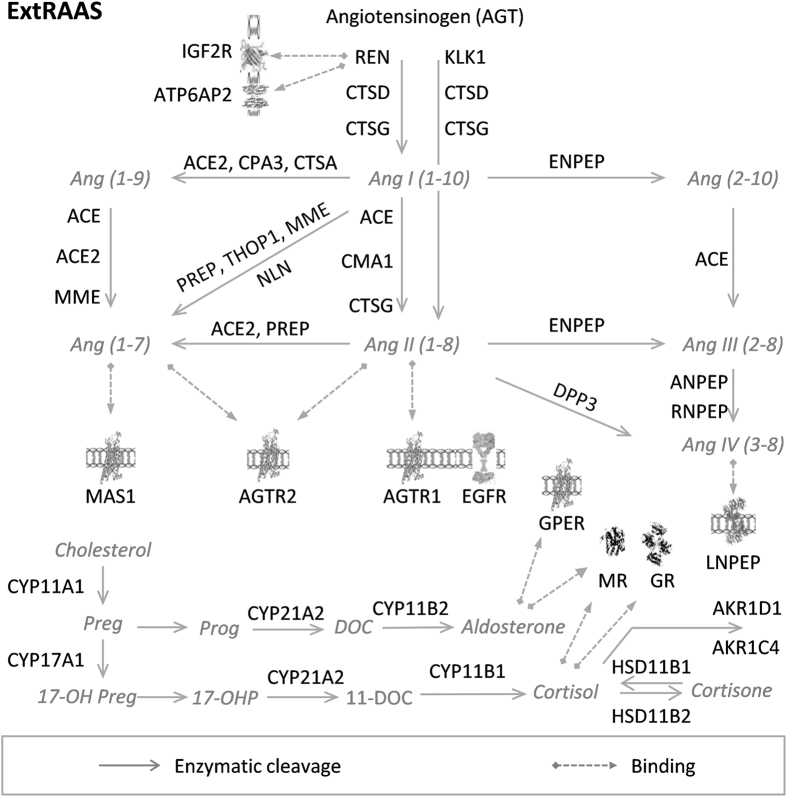
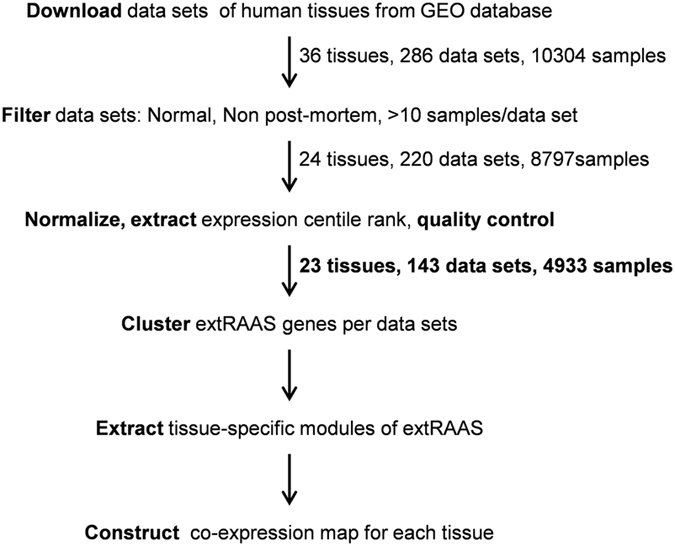
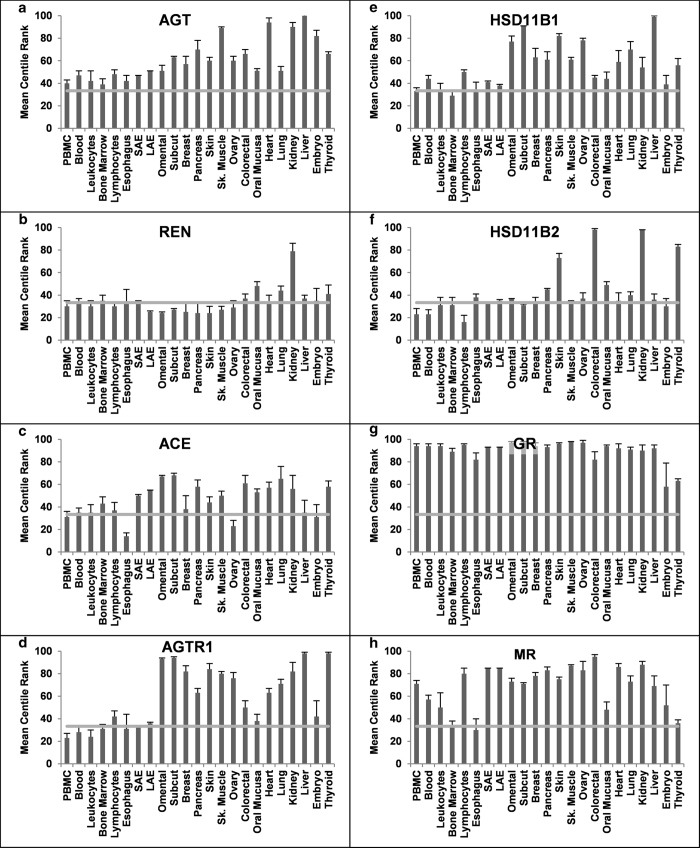
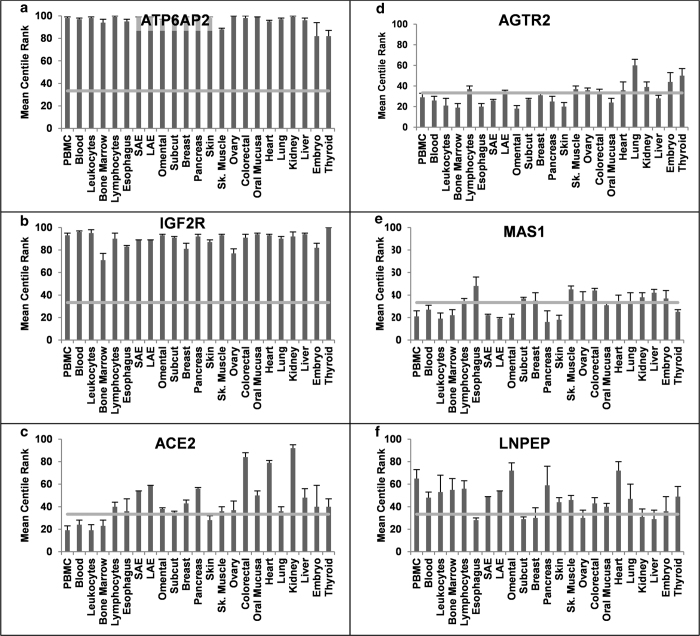
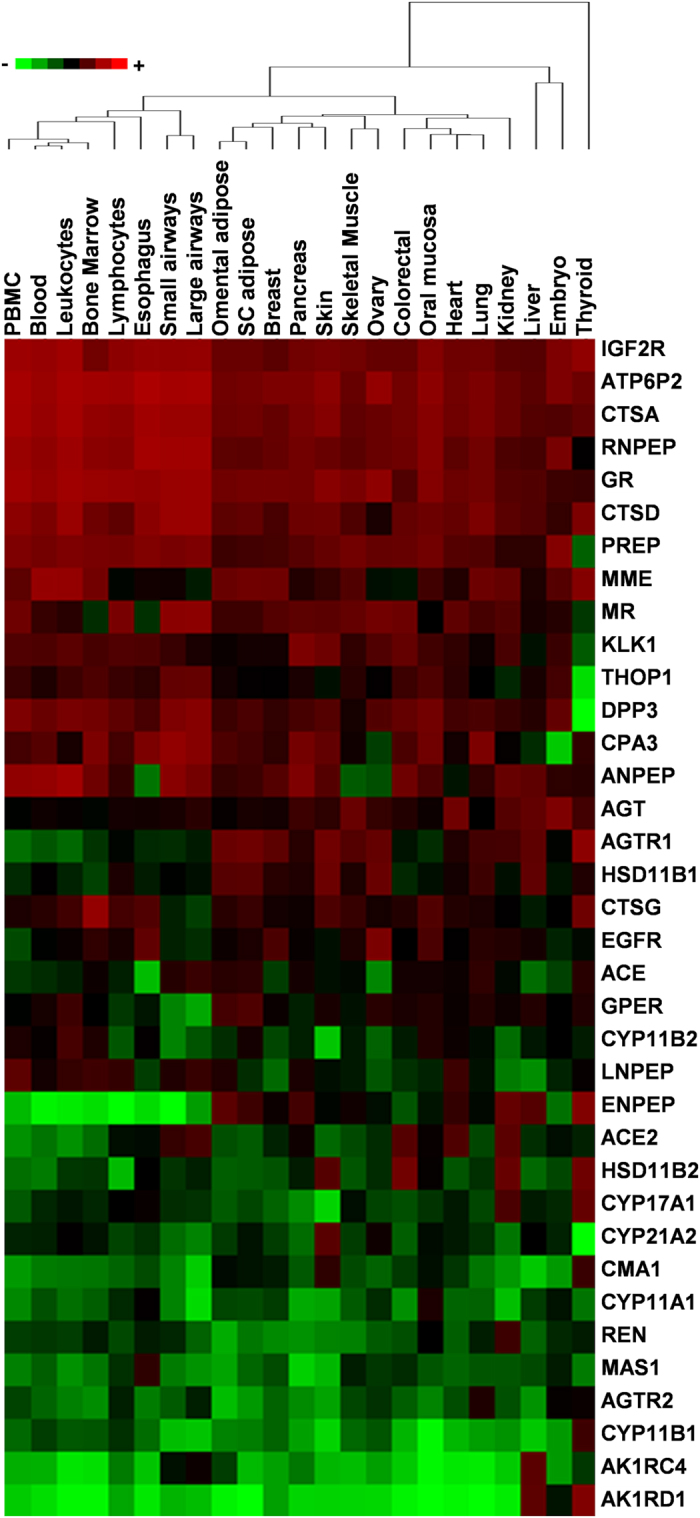
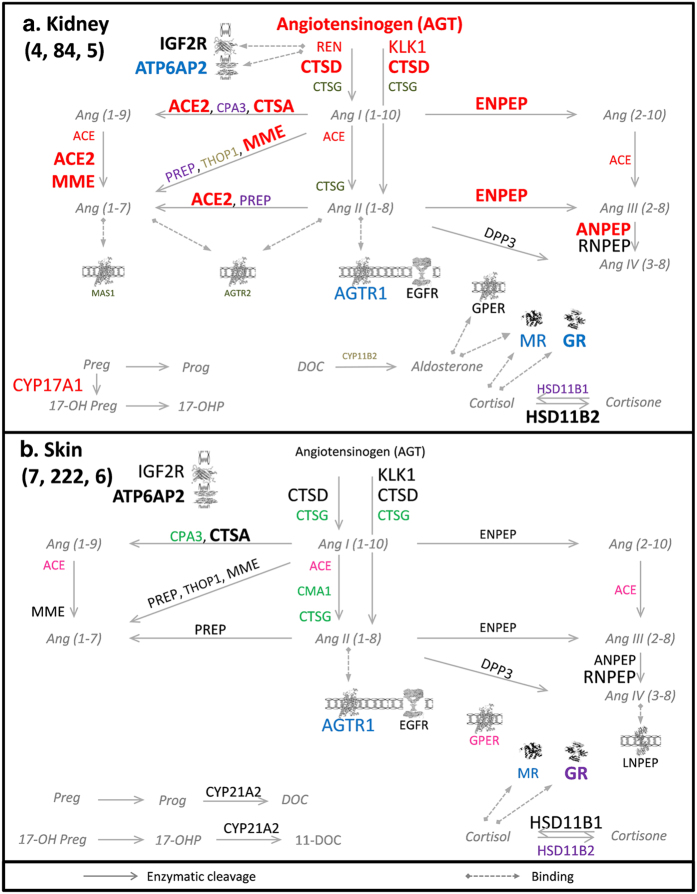
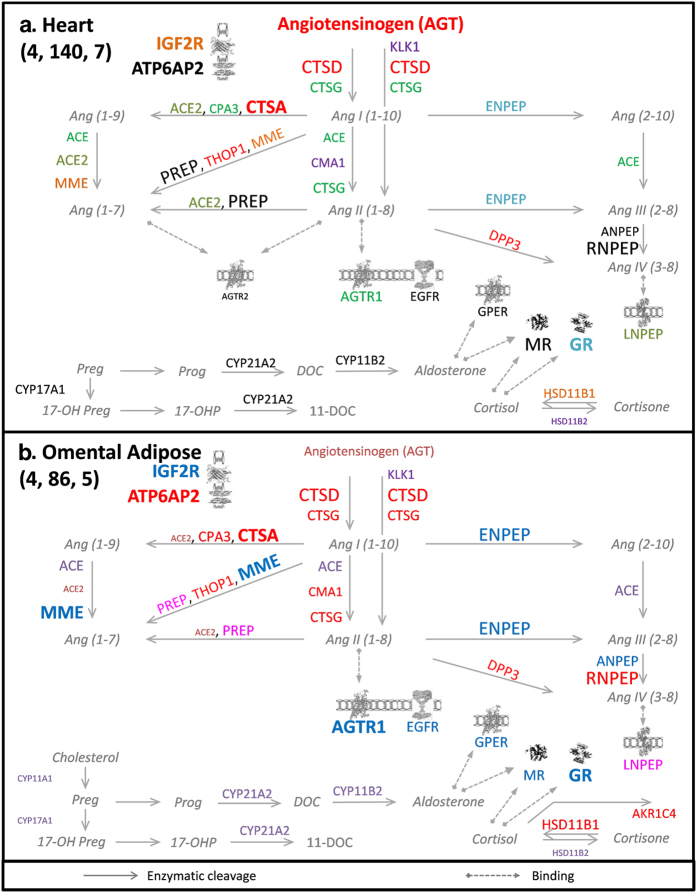
Tissue renin-angiotensin-aldosterone system (RAAS) has attracted much attention because of its physiological and pharmacological implications; however, a clear definition of tissue RAAS is still missing. We aimed to establish a preliminary atlas for the organization of RAAS across 23 different normal human tissues. A set of 37 genes encoding classical and novel RAAS participants including gluco- and mineralo-corticoids were defined as extended RAAS (extRAAS) system. Microarray data sets containing more than 10 normal tissues were downloaded from the GEO database. R software was used to extract expression levels and construct dendrograms of extRAAS genes within each data set. Tissue co-expression modules were then extracted from reproducible gene clusters across data sets. An atlas of the maps of tissue-specific organization of extRAAS was constructed from gene expression and coordination data. Our analysis included 143 data sets containing 4933 samples representing 23 different tissues. Expression data provided an insight on the favored pathways in a given tissue. Gene coordination indicated the existence of tissue-specific modules organized or not around conserved core groups of transcripts. The atlas of tissue-specific organization of extRAAS will help better understand tissue-specific effects of RAAS. This will provide a frame for developing more effective and selective pharmaceuticals targeting extRAAS.


Figures

Figure 1
Figure 1. Extended Renin Angiotensin Aldosterone System (ExtRAAS).
The metabolic cascades of angiotensin peptides, and cortico-and gluco-corticoid pathways have been represented using symbols of genes coding for the substrate, the enzymes and the receptors involved in the pathway. Angiotensin peptides and steroid hormones are represented in grey using their usual abbreviation. Ang, Angiotensin; Preg, Pregnanolone; Prog, Progesterone; DOC, deoxycortisol; 17-OHP, 17-OH Progesterone; ACE, angiotensin I converting enzyme; ACE2, angiotensin I converting enzyme type 2; AGTR1, angiotensin II type 1 receptor; AGTR2, angiotensin II type 2 receptor; AKRIC4, aldo-keto reductase family 1, member C4; AKRID1, aldo-keto reductase family 1, member D1; ANPEP, alanyl-aminopeptidase; ATP6AP2, prorenin/renin receptor; CMA1, chymase 1; CPA3, carboxypeptidase A3; CTSA, cathepsin A; CTSD, cathepsin D; CTSG, cathepsin G; CYP11A1, cytochrome P450, family 11, subfamily A, polypeptide 1; CYP11B1, cortisol synthase; CYP11B2, aldosterone synthase; CYP17A1, cytochrome P450, family 17, subfamily A, polypeptide 1; CYP21A2, cytochrome P450 enzyme, family 21, subfamily A, polypeptide 2; DPP3, dipeptidyl-peptidase 3; ENPEP, glutamyl aminopeptidase (aminopeptidase A); GR, glucocorticoid receptor; HSD11B1, hydroxysteroid (11-beta) dehydrogenase 1; HSD11B2, hydroxysteroid (11-beta) dehydrogenase 2; IGF2R , insulin-like growth factor 2 receptor; KLK1, tissue kallikrein; LNPEP, leucyl/cystinylaminopeptidase; MAS1, MAS1 proto-oncogene; MME, membrane metallo-endopeptidase; MR, mineralocorticoid receptor; NLN, neurolysin (metallopeptidase M3 family); PREP, prolylendopeptidase; REN, renin; RNPEP, arginyl aminopeptidase (aminopeptidase B); THOP1, thimetoligopeptidase 1. Images of IGF2R, ATP6AP2, MR, GR, G-protein coupled receptors (AGTR1, AGTR2, GPER and MAS1) and LNPEP were obtained from the Protein Data Bank in Europe (PDBe) with respective PDBe IDs: 2YDO, 3LBS, 1P93, 4P8Q, 2AA2. Image of EGFR was obtained from Protein Data Bank DOI:10.2210/rcsb_pdb/mom_2010_6.
Figure 2
Figure 2. Experimental workflow
. Microarray data sets obtained from tissue samples were downloaded from the Gene Expression Omnibus (GEO) database; then filtered for normal samples based on exclusion criteria. The data sets passing quality control were selected and their expression data were normalized by centile rank transformation. Each of the data sets was then submitted for extRAAS hierarchical clustering and expression profiling. The resulting dendrograms were then used to assess the level of reproducibility of the different clusters across different data sets obtained from the same tissue. Genes that were most often clustered together in different data sets of the same tissue were annotated as tissue-specific modules. For each tissue, a co-expression map was elaborated using both expression level and tissue-specific module belonging of each extRAAS gene.
Figure 3
Figure 3. mRNA expression profile of classical RAAS and Corticosteroid system (COS) across tissues.
The relative abundance of gene transcripts in each tissue is expressed as the mean expression centile rank (MCR) across data sets (Mean ± SEM). Classical RAAS genes (a-d): AGT, angiotensinogen; REN, renin; ACE, angiotensin converting enzyme; AGTR1, angiotensin II type 1 receptor. COS genes (e-h): HSD11B1, 11beta hydroxysteroid dehydrogenase type 1; HSD11B2, 11beta hydroxysteroid dehydrogenase type 2; GR, glucorticoid receptor; MR, mineralocorticoid receptor; PBMC, peripheral blood mononuclear cells; SAE, small airways epithelium; LAE, large airways epithelium; Omental, Omental adipose tissue; Subcut, sub-cutaneous adipose tissue; Sk. Muscle, Skeletal muscle.
Figure 4
Figure 4. mRNA expression profile of key components of extRAAS across tissues.
The relative abundance of gene transcripts in each tissue is expressed as the mean expression centile rank (MCR) across data sets (Mean ± SEM). (a-b). Renin receptors: ATP6AP2, ATPase, H + transporting, lysosomal accessory protein 2; IGF2R, insulin-like growth factor 2 receptor. c. ACE2, angiotensin converting enzyme type 2. (d-e). Angiotensin peptides receptors: AGTR2, angiotensin II type 2 receptor; MAS1, Ang (1–7) receptor; LNPEP, angiotensin IV receptor. PBMC, peripheral blood mononuclear cells; SAE, small airways epithelium; LAE, large airways epithelium; Omental, Omental adipose tissue; Subcut, sub-cutaneous adipose tissue; Sk. Muscle, Skeletal muscle. Expression profiles for the other investigated tissues are provided in supplemental data.
Figure 5
Figure 5. ExtRAAS-based tissue clustering.
The tissue dendrogram was drawn based on the average linkage method (cluster 3.0 software) using the logged and normalized mean centile expression rank of extRAAS genes. Colors of the heatmap correspond to the relative log (MCR) in each tissue. PBMC, peripheral blood mononuclear cells.
Figure 6
Figure 6. ExtRAAS maps in the kidney (a) and the skin (b).
The number of data sets, samples and modules are represented between brackets (data sets, samples, modules) below tissue name in the upper left corner of the figure. Gene transcripts are represented by the corresponding official symbols. Genes are represented based on their coordination (same color = same module) and mean centile expression rank (MCR, different font size). Non-clustered genes are represented in black color. Gene transcripts below the first tertile (MCR < 33.3) in each tissue were excluded for simplicity. Angiotensin peptides and corticosteroid metabolites are represented in gray italics. Images of IGF2R, ATP6AP2, MR, GR, G-protein coupled receptors (AGTR1, AGTR2, GPER and MAS1) and LNPEP were obtained from the Protein Data Bank in Europe (PDBe) with respective PDBe IDs: 2YDO, 3LBS, 1P93, 4P8Q, 2AA2. Image of EGFR was obtained from Protein Data Bank DOI:10.2210/ rcsb_pdb/mom_2010_6. Maps for the other investigated tissues are provided in supplemental data.
Figure 7
Figure 7. ExtRAAS maps in the heart (a) and the omental adipose tissue (b).
The number of data sets, samples and modules are represented between brackets (data sets, samples, modules) below tissue name in the upper left corner of the figure. Gene transcripts are represented by the corresponding official symbols. The genes are represented based on their coordination (same color = same module) and mean centile expression rank (MCR, different font size). Non-clustered genes are represented in black color. Gene transcripts below the first tertile (MCR < 33.3) in each tissue were excluded for simplicity. Angiotensin peptides and corticosteroid metabolites are represented in gray italics. Images of IGF2R, ATP6AP2, MR, GR, G-protein coupled receptors (AGTR1, GTR2, GPER and MAS1) and LNPEP were obtained from the Protein Data Bank in Europe (PDBe) with respective PDBe IDs: 2YDO, 3LBS, 1P93, 4P8Q, 2AA2. Image of EGFR was obtained from Protein Data Bank DOI:10.2210/rcsb_pdb/mom_2010_6. Maps for the other investigated tissues are provided in the supplemental data.

References

    1. Robertson J. I. S., Nichools M. G. & August P. The renin-angiotensin system . Mosby1993).
    1. Michel J.-B. Médecine cardiovasculaire du système rénine angiotensine. (Ed. Pradel, 1992).
    1. Paul M., Mehr A. P. & Kreutz R. Physiology of Local Renin-Angiotensin Systems. Physiol. Rev. 86, 747–803 (2006). - PubMed
    1. Ahmad S. et al. Chymase-dependent generation of angiotensin II from angiotensin-(1–12) in human atrial tissue. PloS One , 6, e28501 (2011). - PMC - PubMed
    1. Uehara Y., Miura S., Yahiro E. & Saku K. Non-ACE pathway-induced angiotensin II production. Curr. Pharm. Des. 19, 3054–3059 (2013). - PubMed

Publication types

LinkOut - more resources