. 2015 May 20;10(5):e0126423.
doi: 10.1371/journal.pone.0126423. eCollection 2015.

MicroRNA Profiling of CSF Reveals Potential Biomarkers to Detect Alzheimer`s Disease

Affiliations

MicroRNA Profiling of CSF Reveals Potential Biomarkers to Detect Alzheimer`s Disease

Johannes Denk et al. PLoS One. .

Abstract

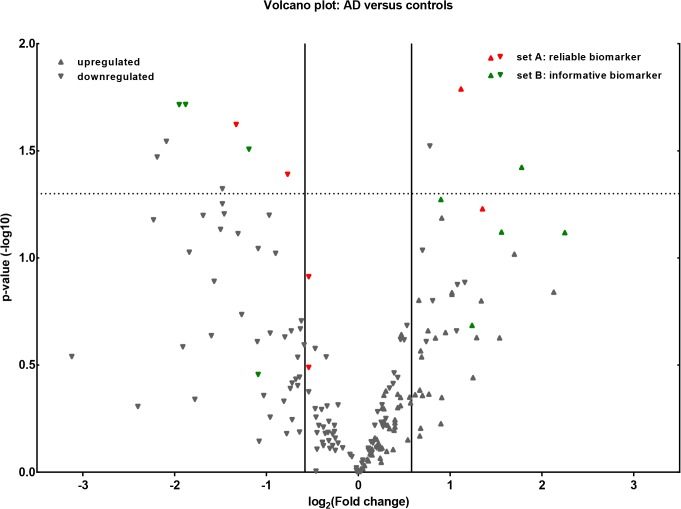
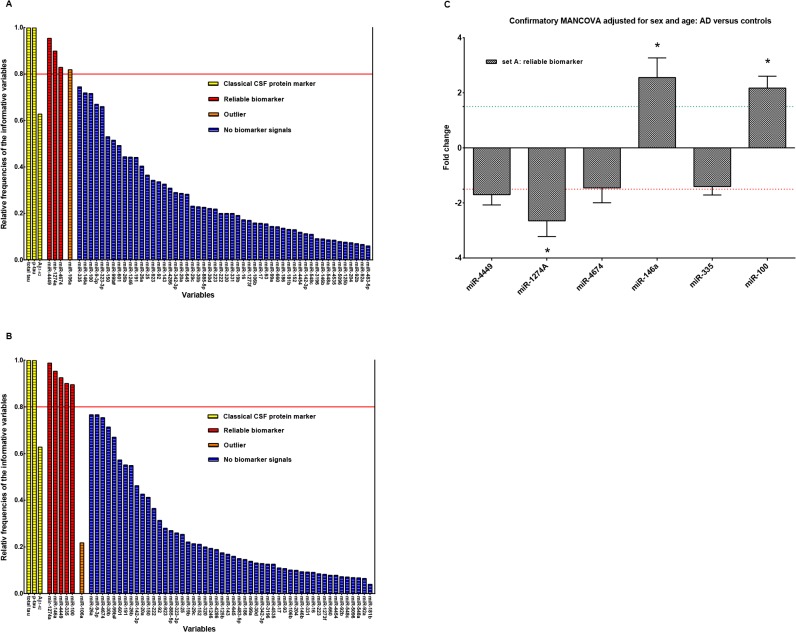
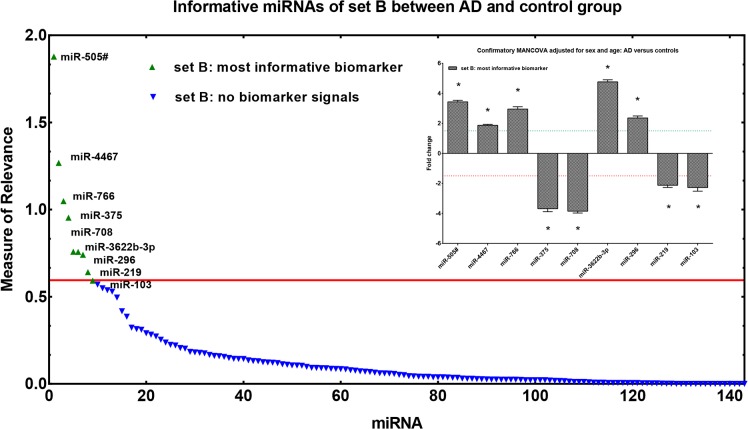
The miRBase-21 database currently lists 1881 microRNA (miRNA) precursors and 2585 unique mature human miRNAs. Since their discovery, miRNAs have proved to present a new level of epigenetic post-transcriptional control of protein synthesis. Initial results point to a possible involvement of miRNA in Alzheimer's disease (AD). We applied OpenArray technology to profile the expression of 1178 unique miRNAs in cerebrospinal fluid (CSF) samples of AD patients (n = 22) and controls (n = 28). Using a Cq of 34 as cut-off, we identified positive signals for 441 miRNAs, while 729 miRNAs could not be detected, indicating that at least 37% of miRNAs are present in the brain. We found 74 miRNAs being down- and 74 miRNAs being up-regulated in AD using a 1.5 fold change threshold. By applying the new explorative "Measure of relevance" method, 6 reliable and 9 informative biomarkers were identified. Confirmatory MANCOVA revealed reliable miR-100, miR-146a and miR-1274a as differentially expressed in AD reaching Bonferroni corrected significance. MANCOVA also confirmed differential expression of informative miR-103, miR-375, miR-505#, miR-708, miR-4467, miR-219, miR-296, miR-766 and miR-3622b-3p. Discrimination analysis using a combination of miR-100, miR-103 and miR-375 was able to detect AD in CSF by positively classifying controls and AD cases with 96.4% and 95.5% accuracy, respectively. Referring to the Ingenuity database we could identify a set of AD associated genes that are targeted by these miRNAs. Highly predicted targets included genes involved in the regulation of tau and amyloid pathways in AD like MAPT, BACE1 and mTOR.


Conflict of interest statement

Competing Interests: The authors have declared that no competing interests exist.

Figures

Fig 1
Fig 1. Volcano plot of group comparisons.
Comparisons of 199 miRNAs assessed in OpenArray analysis of smallRNA isolated from CSF of patients with AD (n = 22) and controls (n = 28). The volcano plot displays the relationship between fold change and significance between the two groups, applying a student’s t-test. The y-axis depicts the negative log10 of p-values of the t-tests (the horizontal slider at 1.3 corresponds to a p-value of 0.05, a higher value indicates greater significance) and the x-axis is the difference in expression between the two experimental groups as log2 fold changes (vertical sliders indicate miRNAs as either up- or down regulated above a fold change of 1.5). Highlighted in green are the most reliable (6 abundant miRNAs from set A with RF≥0.8) and in red the most informative (9 less abundant miRNAs from set B above the critical MoR value d = 0.57) biomarkers according to the MoR-method (see Figs 2 and 3).
Fig 2
Fig 2. Reliability investigation.
Plot of relative frequencies denoting for a miRNA how often among 800 MoR repeats with random subsamples of the original groups it has been crystallized as informative (original groups: controls n = 28, AD n = 22 subjects). (A) Relative frequencies of set A miRNAs with reliable biomarker candidates over the solid red line (RF = 0.8); (B) Relative frequencies of set A miRNAs with reliable biomarker candidates over the solid red line (RF = 0.8) after substitution by corresponding group means; (C) Bar diagram of the reliable biomarker signals of set A. Stars (*) over the bars point to significant p-values (MANCOVA, p < α*, where α* is Bonferroni corrected α = 0.05) and therewith to significant biomarkers.
Fig 3
Fig 3. Measure of Relevance for miRNA expression data in CSF.
Application of the MoR approach to miRNAs of set B for identifying relevant expression differences between controls and AD cases. In the control group n = 28 and in the AD group n = 22 subjects were examined. MoR-values over the red line are to be declared as informative (critical MoR-value for the informative designation d = 0.57). Bar diagram of the most informative biomarker signals of set B. Stars (*) over the bars point to significant p-values in MANCOVA (MANCOVA, p < α*, where α* is Bonferroni corrected α = 0.05).
Fig 4
Fig 4. Scatter plot: Correlation of CSF miR-146a expression and levels of total tau, p-tau and Aβ1–42.
Correlation significances were proven by Pearson correlation coefficients. Data were analysed applying Cq 32 as cut-off for miR-146a expression levels. Expression levels of miR-146a (2^-dCt log2) are inversely correlated with concentrations of total tau and Aβ1–42 in the AD group: (A) miR-146a expression levels vs. tau, AD cases: r = -0.5142, 98% CI -0.8065 to -0.01993, p = 0.0171; (B) miR-146a expression levels vs. Aβ1–42, AD cases: r = -0.5364, 98% CI -0.8121 to -0.06519, p = 0.0101. (C) No significant correlations were observed for concentrations of p-tau and miR-146a expression levels in the AD- and control group. Aβ1–42 = b-amyloid 42; CI = confidence interval; p-tau = phosphorylated tau.

References

    1. Blennow K, de Leon MJ, Zetterberg H. Alzheimer's disease. Lancet. 2006;368(9533):387–403. - PubMed
    1. Selkoe DJ. Alzheimer's disease: genes, proteins, and therapy. Physiological reviews. 2001;81(2):741–66. - PubMed
    1. Hulstaert F, Blennow K, Ivanoiu A, Schoonderwaldt HC, Riemenschneider M, De Deyn PP, et al. Improved discrimination of AD patients using beta-amyloid((1–42)) and tau levels in CSF. Neurology. 1999;52(8):1555–62. - PubMed
    1. Mulder C, Verwey NA, van der Flier WM, Bouwman FH, Kok A, van Elk EJ, et al. Amyloid-beta(1–42), total tau, and phosphorylated tau as cerebrospinal fluid biomarkers for the diagnosis of Alzheimer disease. Clin Chem. 2010;56(2):248–53. 10.1373/clinchem.2009.130518 - DOI - PubMed
    1. Zawia NH, Lahiri DK, Cardozo-Pelaez F. Epigenetics, oxidative stress, and Alzheimer disease. Free radical biology & medicine. 2009;46(9):1241–9. - PMC - PubMed

MeSH terms