. 2015 May 19;42(5):864-76.
doi: 10.1016/j.immuni.2015.04.013.

Actin depletion initiates events leading to granule secretion at the immunological synapse

Affiliations

Actin depletion initiates events leading to granule secretion at the immunological synapse

Alex T Ritter et al. Immunity. .

Abstract

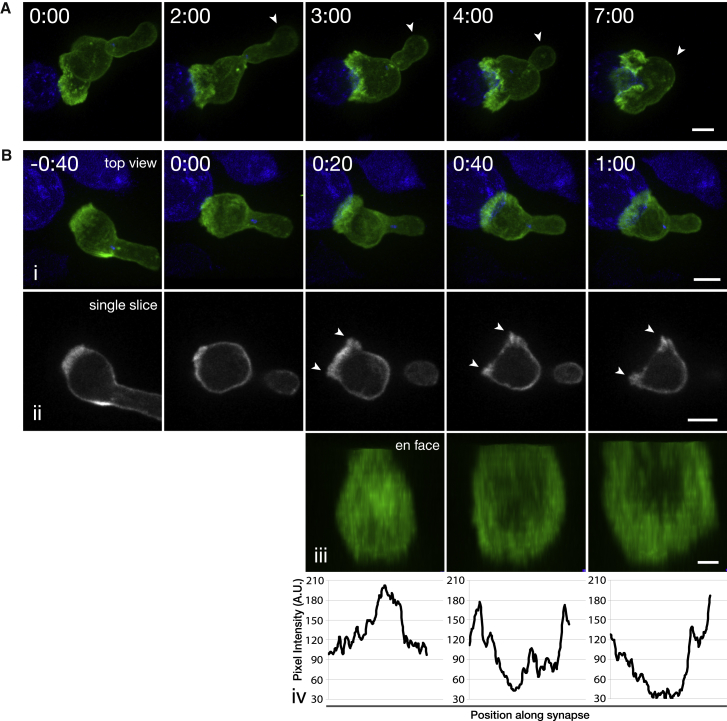
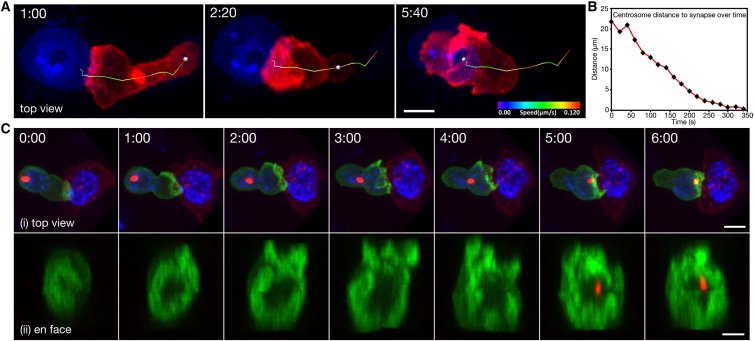
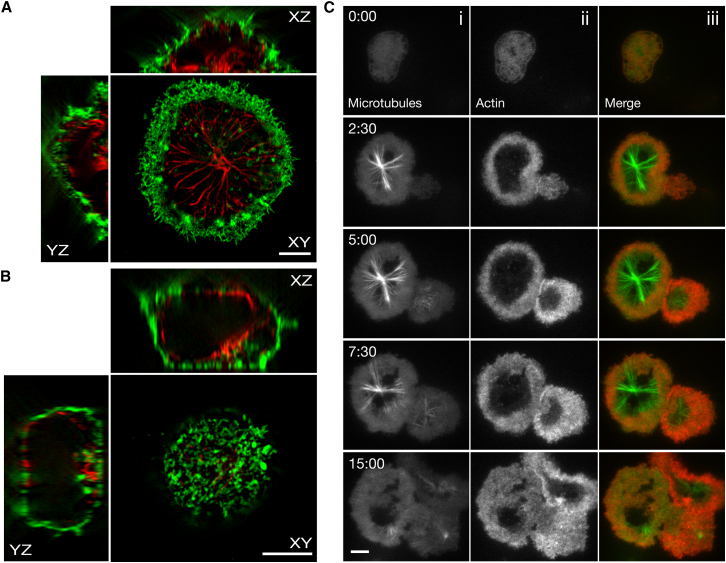
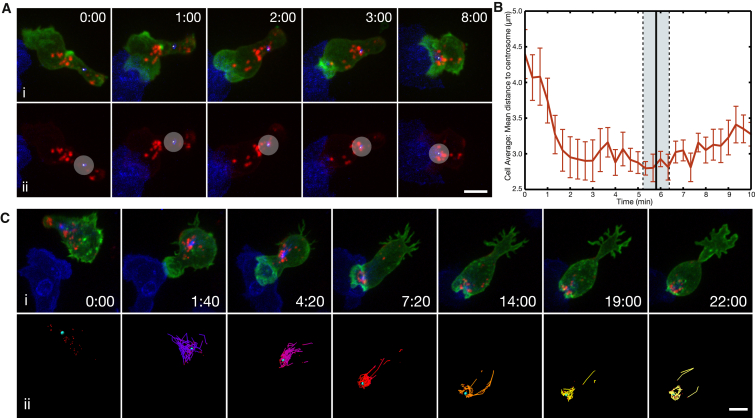
Cytotoxic T lymphocytes (CTLs) use polarized secretion to rapidly destroy virally infected and tumor cells. To understand the temporal relationships between key events leading to secretion, we used high-resolution 4D imaging. CTLs approached targets with actin-rich projections at the leading edge, creating an initially actin-enriched contact with rearward-flowing actin. Within 1 min, cortical actin reduced across the synapse, T cell receptors (TCRs) clustered centrally to form the central supramolecular activation cluster (cSMAC), and centrosome polarization began. Granules clustered around the moving centrosome within 2.5 min and reached the synapse after 6 min. TCR-bearing intracellular vesicles were delivered to the cSMAC as the centrosome docked. We found that the centrosome and granules were delivered to an area of membrane with reduced cortical actin density and phospholipid PIP2. These data resolve the temporal order of events during synapse maturation in 4D and reveal a critical role for actin depletion in regulating secretion.


Figures

None
Graphical abstract
Figure 1
Figure 1
Actin Initially Accumulates at the Synapse and Quickly Clears to Form an F-Actin-Depleted Region Surrounded by an Actin-Rich Lamella (A) Maximum intensity projection (MIP) of a Lifeact-mApple-expressing CTL (green) interacting with a target (blue). Arrows point out the uropod as it retracts into the cell body over the course of target interaction (n = 15 cells, 8 independent experiments, i.e., from different mice). Scale bar represents 5 μm. (B) Time lapse of (i) MIP of confocal sections, (ii) a single confocal slice corresponding to the center of the synapse from the 488-nm channel, and (iii) en face view of a Lifeact-EGFP-expressing CTL interacting with an EL4 target cell expressing a farnesylated TagBFP2 (blue) (n = 15 cells, 3 independent experiments). Time 0:00 indicates the point of first contact with the target. (iv) Fluorescence-intensity plots quantify actin density along the synapse between the arrowheads shown in (ii). Scale bars represent 5 μm (i and ii) and 2 μm (iii). Time is shown as min:s. See also Movie S1.
Figure 2
Figure 2
Lattice Light-Sheet Microscopy Reveals Actin Dynamics in Conjugating T Cells (A) Time-lapse MIP of coherent structured light-sheet images of (i) top views and (ii) side views of a migrating CTL expressing Lifeact-mEmerald. Green and magenta arrows highlight ruffles that translate up the dorsal surface of the cell (n = 9 cells, 3 independent experiments). (B) Time-lapse MIP of (i) lattice light-sheet images, (ii) a single slice corresponding to the center of the synapse from the 488-nm channel, and (iii) en face view of a Lifeact-mEmerald-expressing CTL (orange) interacting with an EL4-red target (cyan) (n = 10 cells, 3 independent experiments). (C) (i) MIP of a Lifeact-mEmerald-expressing CTL (orange) interacting with a target cell (cyan). (ii) Particles corresponding to visible actin structures were tracked in three dimensions over time. Dragon tails showing particle positions over the previous five frames are color coded to show particle velocity. (D) Mean velocity for each track was determined and collated into a histogram with a line of fit (red) (n = 123 tracks over 8 cells from 3 independent experiments). Scale bars represent 5 μm. Time is shown as min:s. See also Movie S2.
Figure 3
Figure 3
Centrosome Migrates from the Uropod to the Center of the Actin-Deficient Zone (A) Time-lapse MIP images of a CTL expressing Lifeact-mApple and PACT-TagBFP (marked with a sphere) as it encountered an EL4-blue target cell. The track the centrosome took to the target is represented by a line pseudocolored to indicate particle velocity (n = 16 cells, 9 independent experiments). Scale bar represents 5 μm. (B) Graph of centrosome distance to synapse versus time for the dataset in (A). (C) Time lapse of (i) MIP images or (ii) en face view of a CTL expressing Lifeact-EGFP and PACT-mRFP as it encountered a target cell (red). The nuclei of both cells are labeled with Hoescht (blue). Scale bars represent 5 μm (i) and 3 μm (ii). Time is shown as min:s. See also Movie S3.
Figure 4
Figure 4
Cortical Actin Is Reduced at the Synapse when the Centrosome Is Docked (A and B) 3D structured-illumination images of a CTL that was fixed while interacting with glass coated with an antibody against CD3ε (A: n = 21 cells, 3 independent experiments) or CD25 (B: n = 24 cells, 3 independent experiments) and stained with phalloidin-Alexa 488 (green) and an antibody against α-tubulin (red). The “XY” panels are MIP images of the bottom 0.22 μm of the cell. The “XZ” and “YZ” panels are 0.3-μm-thick slices through the center of the cell in each respective dimension. Scale bars represent 5 μm. (C) TIRF images of (i) a CTL expressing MAP Tau-EGFP (n = 17 cells, 5 independent experiments) and (ii) a CTL expressing Lifeact-mApple as they interacted with glass coated with an antibody against CD3ε. Images of merged channels are shown in (iii). Scale bar represents 3 μm. See also Movie S4.
Figure 5
Figure 5
cSMAC Formation Occurs in Two Stages, before and after Centrosome Polarization (A) MIP (i–iv) and single confocal slice (v–viii) of a migratory CTL expressing CD3ζ-EGFP (i and v), Lifeact-mApple (ii and vi), or PACT-TagBFP (iii and vii). Images of merged channels are also shown (iv and vii). Scale bars represent 5 μm. (B) Time-lapse MIP images (i) and reconstructed en face view (ii–iv) of confocal sections taken as a CTL expressing PACT-TagBFP (i), CD3ζ-EGFP (ii), or Lifeact-mApple (iii) encountered a target cell (blue). A merged en face view is shown in (iv). A white sphere marks the location of the PACT-TagBFP signal in (i). (v) Fluorescence-intensity plots of a line scan across the synapse of a single z slice at the center of the synapse show EGFP and mApple signal in green and red, respectively. Scale bars represent 5 μm (i) and 3 μm (ii–iv). (C) Time-lapse MIP images of a CTL expressing CD3ζ-EGFP and PACT-mRFP as it encountered a target cell (blue). Magenta arrows highlight EGFP signal disappearing from the distal part of the cell, and orange arrows indicate EGFP signal accumulating at the cell-cell interface. Scale bar represents 5 μm. Time is shown as min:s. (n = 32 cells, 15 independent experiments). See also Movie S5.
Figure 6
Figure 6
Granules Cluster at the Centrosome before It Arrives at the Synapse (A) Time-lapse MIP images of a CTL expressing Lifeact-EGFP, CD63-mCherry, and PACT-TagBFP as it interacted with a target cell (blue). All channels are shown in (i). The EGFP signal has been removed in (ii), and a circle with a radius of 2 μm has been overlaid onto the centrosome as a reference. (B) Graph of the average distance between granules and the centrosome over time. The black vertical line indicates the average time it took the centrosome to reach the synapse in sample cells, and the gray box indicates the SE. Error bars represent the SE at each time point (n = 9 cells, 3 independent experiments). (C) (i) Time-lapse MIP images of a CTL expressing Lifeact-EGFP, CD63-mCherry, and MAPTau-TagBFP2 as it interacted with a target cell (blue) (n = 9 cells, 3 independent experiments). (ii) Particles localized to the mCherry signal from (i) are shown. A cyan sphere marks the location of the centrosome over time. Particles corresponding to granules are tracked, and tracks corresponding to the location of the particle for the previous four frames (dragon tails) are shown. Tracks are color coded according to time. Time is shown as min:s. Scale bars represent 5 μm. See also Movies S6 and S8 and Figure S1.
Figure 7
Figure 7
Lytic Granule Secretion Occurs after Cortical Actin Reduction (A)Time-lapse TIRF images of a CTL expressing Lifeact-mApple (top) or Lamp1-EGFP (middle) as it interacted with glass coated with an antibody against CD3ε (n = 14 cells, 5 independent experiments). Images of merged channels are shown in the bottom frames. Scale bar represents 5 μm. (B) Kymograph of the movie shown in (A). Fluorescence intensity under a 5-pixel-thick line is measured over time. The position of the line (dashed white line) is shown in the lower right panel of (A). Signal corresponding to Lifeact-mApple is shown on top, signal corresponding to Lamp1-EGFP is shown in the middle, and merged signal is shown on the bottom. Scale bar represents 2 min. (C) Single confocal slices of a CTL expressing Lifeact-mApple along with the lipid binding domain of (i) Tubby (n = 190 cells, 4 independent experiments), (ii) AKT (n = 57 cells, 2 independent experiments), or (iii) a farnesylation sequence fused to EGFP (n = 150 cells, 3 independent experiments) as it interacted with an EL4-blue target cell. Scale bars represents 5 μm. See also Movies S7 and S9.

Comment in

References

    1. Babich A., Burkhardt J.K. Lymphocyte signaling converges on microtubules. Immunity. 2011;34:825–827. - PubMed
    1. Babich A., Li S., O’Connor R.S., Milone M.C., Freedman B.D., Burkhardt J.K. F-actin polymerization and retrograde flow drive sustained PLCγ1 signaling during T cell activation. J. Cell Biol. 2012;197:775–787. - PMC - PubMed
    1. Balagopalan L., Sherman E., Barr V.A., Samelson L.E. Imaging techniques for assaying lymphocyte activation in action. Nat. Rev. Immunol. 2011;11:21–33. - PMC - PubMed
    1. Beal A.M., Anikeeva N., Varma R., Cameron T.O., Vasiliver-Shamis G., Norris P.J., Dustin M.L., Sykulev Y. Kinetics of early T cell receptor signaling regulate the pathway of lytic granule delivery to the secretory domain. Immunity. 2009;31:632–642. - PMC - PubMed
    1. Beemiller P., Jacobelli J., Krummel M.F. Integration of the movement of signaling microclusters with cellular motility in immunological synapses. Nat. Immunol. 2012;13:787–795. - PMC - PubMed

Publication types

MeSH terms