. 2015 May 19;42(5):877-89.
doi: 10.1016/j.immuni.2015.04.014.

Asymmetric Action of STAT Transcription Factors Drives Transcriptional Outputs and Cytokine Specificity

Affiliations

Asymmetric Action of STAT Transcription Factors Drives Transcriptional Outputs and Cytokine Specificity

Kiyoshi Hirahara et al. Immunity. .

Abstract

Interleukin-6 (IL-6) and IL-27 signal through a shared receptor subunit and employ the same downstream STAT transcription proteins, but yet are ascribed unique and overlapping functions. To evaluate the specificity and redundancy for these cytokines, we quantified their global transcriptomic changes and determined the relative contributions of STAT1 and STAT3 using genetic models and chromatin immunoprecipitation-sequencing (ChIP-seq) approaches. We found an extensive overlap of the transcriptomes induced by IL-6 and IL-27 and few examples in which the cytokines acted in opposition. Using STAT-deficient cells and T cells from patients with gain-of-function STAT1 mutations, we demonstrated that STAT3 is responsible for the overall transcriptional output driven by both cytokines, whereas STAT1 is the principal driver of specificity. STAT1 cannot compensate in the absence of STAT3 and, in fact, much of STAT1 binding to chromatin is STAT3 dependent. Thus, STAT1 shapes the specific cytokine signature superimposed upon STAT3's action.


Conflict of interest statement

Competing financial interests. The authors declare no competing financial interests.

Figures

Figure 1.
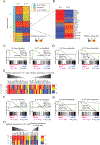
Figure 1.. Quantitation and analysis of IL-6 and IL-27 transcriptomic responses
Naïve CD4+ T cells were cultured for 3 days on anti-CD3 and anti-CD28 coated plates with or without IL-6 or IL-27. Gene expression was measured by RNA-seq as RPKM (reads per kilobase exon model per million reads). (A) Gene expression changes of >2 fold or <0.5 fold by IL-6 or IL-27 compared to cells cultured without exogenous cytokines (n=1193) are depicted by heat-map and clustered based on their selective regulation by IL-6 (IL-6 Unique), IL-27 (IL-27 Unique) or both cytokines (Common). The small subset of atypical genes, oppositely regulated by IL-6 and IL-27, are denoted by the asterisk and are highlighted in (B). (C, D) Gene Set Enrichment Analysis (GSEA) for IL-6- or IL-27-regulated genes are compared to genes expressed in Th1 and Th2 cells (data from GEO# GSE45975). IL-6 up-regulated, IL-27 up-regulated, IL-6 down-regulated, IL-27 down-regulated genes are plotted separately, and each analysis shows non-random distribution of IL-6- or IL-27-regulated genes versus Th1 or Th2 cell-associated genes (FDR; false discovery rate, NES; normalized enrichment score). (E) IL-6- and IL-27-dependency of representative Th1 and Th2 cell-associated genes identified by GSEA analysis in C and D are shown. (F, G) GSEA for IL-6 or IL-27 regulated-gene sets plotted against genes expressed in Th17 and iTreg cells (data from GEO# GSE45975). (H) IL-6 and IL-27 dependency of representative Th17- and iTreg cell-expressed genes. The RNA-seq data were acquired as biological duplicates, and the average of the two was used for all downstream analyses presented in Figures.1, 3, 4 and 5. See also Supplemental Figure 1.
Figure 2.
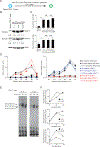
Figure 2.. The ability of IL-6 and IL-27 to access STAT1 and STAT3 dynamically changes with T cell activation.
Sorted naïve CD4+ T cells were stimulated with anti-CD3 and anti-CCD28 with or without the indicated cytokines for 3 days (A). With indicated stimulation and time points, STAT1 and STAT3 protein amounts were measured by immunoblotting (B, C), intracellular staining and flow cytometry (phospho-STATs) (D) and EMSA (E, F). (C) Pooled data from 4 independent experiments are provided (***P<0.001, **P<0.01, NS, not significant). (D) Time course of STAT1 and STAT3 phosphorylation following cytokine stimulation was evaluated for up to 72 hours. (E) The positions of STAT1-STAT1, STAT1-STAT3 and STAT3-STAT3 dimers are indicated. (F) The intensity of STAT3-STAT3, STAT3-STAT1 and STAT1-STAT1 dimer species in (E) was quantitated by densitometry. See also Supplemental Figure 2.
Figure 3.
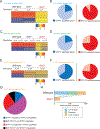
Figure 3.. STAT3 controls the magnitude of transcriptional output induced by both IL-6 and IL-27.
Naïve CD4+ T cells from wild type, Stat1−/− or Stat3−/− mice were cultured on anti-CD3/CD28 coated plates with or without IL-6 or IL-27 for 3 days. RNA was isolated and global gene expression was determined by RNA-Seq. (A, C, E), A group of cytokine responsive genes was selected similarly as in Figure 1A. Fold changes in expression of genes selectively regulated by IL-6 (A, n=503 genes) and IL-27 (E, n=311 genes) or both cytokines (C, n=379 genes) in wild type, STAT1- or STAT3-deficient CD4+ T cells are shown by heat-maps. (B, D, F) STAT dependency was evaluated based on the loss of gene regulation in Stat1−/− or Stat3−/− CD4+ T cells and is depicted by pie charts. (G) Contribution of STAT1, STAT3 or both in controlling genes selectively regulated by IL-27. (H) Consequence of absence of STAT3 in mouse CD4+ T cells on genes regulated by IL-6 (blue), IL-27 (orange) and both cytokines (green). See also Supplemental Figure 3.
Figure 4.
Figure 4.. STAT1 controls the diversity of cytokine responses mediated by IL-6 and IL-27.
Wild type and STAT1-deficient naïve CD4+ T cells were activated and cultured with cytokines. (A) A total of 1193 genes were depicted in wild type cells as regulated by IL-6 (blue) or IL-27 (orange) and their gene expression overlap was depicted for wild type and Stat1−/− cells (B) The number of genes regulated by IL-6 or IL-27 was increased in Stat1−/− cells. These genes were further classified into subgroups based on their overlapping or unique cytokine response. Many genes acquired cytokine response in Stat1−/− indicative of de novo gene regulation in Stat1−/− (green and dark orange). (C) Genes regulated by IL-6 (blue), IL-27 (orange), both (green) or neither (gray) are identified and color-coded. The scatter plots are drawn to evaluate the similarity of gene expression between IL-6 (X axis) and IL-27 (Y axis) and the correlation coefficient (r) was calculated. See also Supplemental Figure 4.
Figure 5.
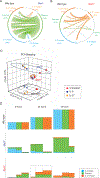
Figure 5.. Asymmetric contribution of STAT3 and STAT1 in driving magnitude and specificity of gp130 cytokine responses.
(A, B) Circos visualization to show the consequence of absence of STAT1 (A) or STAT3 (B) on cytokine regulated gene expression change. Cytokine response of genes was color coded as IL-6 unique (blue), common (green), or IL-27 unique (orange) subgroups. Genes in wild type cells were aligned on the left side of the plots and the genes in STAT-deficient cells were aligned on the right side of the plots with each connecting line link the same gene on left and right. The color of connecting line represented cytokine specificity of STAT-deficient cells. The genes that lost cytokine responsiveness in Stat1−/− or Stat3−/− were shown in gray lines on the right half of the circle without connecting lines. Many IL-6 unique or IL-27 unique genes in wild type switched to common genes in Stat1−/−. Notable fraction of IL-6 unique or common genes in wild type became IL-27 unique genes in Stat3−/−. (C) Principal component analysis of the global gene expression is shown as clusters are grouped by genotype (wild type, Stat1−/−, Stat3−/−). A total of 18 samples (9 conditions in duplicate) of RNA-seq data were plotted. The three main principal components in the model contribute to explain 30.7%, 14.5% and 9.13% of the variation, respectively, and are predictive. (D) The relative numbers of genes regulated by IL-6 (blue), IL-27 (orange) or both cytokines (green) are depicted as areas of the different rectangles in mosaic plots for the indicated time points.
Figure 6.
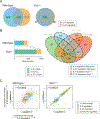
Figure 6.. STAT1 binding to chromatin is largely STAT3 dependent.
(A) STAT1 (right) and STAT3 (left) binding was assessed by ChIP-seq and clustered into 7 categories based on cytokine response to IL-6 and IL-27 as indicated. (B) Proportions of peaks segregating into the clusters shown in panel A were shown for STAT1 and STAT3. (C) Quantitation of STAT1 (blue) and STAT3 (red) peaks with or without a STAT-binding motif was shown for 7 categories. (D) STAT3 (red) and STAT1 (blue) read counts within 50 kb of TSS and TES of cytokine regulated genes in wild type and STAT-deficient cells. The number of genes in each group was shown in a parenthesis. See Methods (stat binding box plots) for details. (*P<0.05, NS, not significant). (E) The numbers of overlapping and unique peaks bound by STAT1 and STAT3 are shown in Venn diagrams. The potential distinct STAT dimer composition was determined by assessing the ratio of STAT3 and STAT1 signals and linked to the nearest gene. The STAT peaks were then sorted based on the cytokine response of the nearest genes. STAT1 and STAT3 ChIP-Seq experiments were done 2 times under similar conditions. See also Supplemental Figure 5 and Table 1.
Figure 7.
Figure 7.. STAT1 gain-of-function mutations in human CD4+ T cells exhibit enhanced transcriptomic output and diversity in response to IL-6 and IL-27.
Sorted naïve CD4+ T cells (CD4+CD45RA+) from age- and sex-matched healthy control (HC) and patients with STAT1 gain-of-function (STAT1 GOF) (Table S2) were stimulated with plate-coated anti-CD3 and anti-CD28 with or without (untreated) IL-6 (50 ng ml−1) or IL-27 (50 ng ml−1) for 3 days. RNA was isolated and analyzed by mRNA-Seq. (A) Genes whose expression was altered are clustered based on their selective regulation by IL-6 (blue), IL-27 (orange) or commonly (green) by both cytokines in healthy control (HC) subjects (n=4) and STAT1 GOF patients (STAT1 GOF) (n=5). See Methods (mosaic plots) for details. (B) The absolute number of cytokine regulated genes was quantitated (mean ± s.e.m., P value by unpaired student’s t test, NS, not significant). (C) Similarities in IL-6 and IL-27-regulated genes were quantitated (Pearson correlation coefficients, mean ± s.e.m., P value by unpaired student’s t test). See also Supplemental Table 2 and 3.

References

    1. Apetoh L, Quintana FJ, Pot C, Joller N, Xiao S, Kumar D, Burns EJ, Sherr DH, Weiner HL, and Kuchroo VK (2010). The aryl hydrocarbon receptor interacts with c-Maf to promote the differentiation of type 1 regulatory T cells induced by IL-27. Nat Immunol 11, 854–861. - PMC - PubMed
    1. Awasthi A, Carrier Y, Peron JP, Bettelli E, Kamanaka M, Flavell RA, Kuchroo VK, Oukka M, and Weiner HL (2007). A dominant function for interleukin 27 in generating interleukin 10-producing anti-inflammatory T cells. Nat Immunol 8, 1380–1389. - PubMed
    1. Barrett JC, Clayton DG, Concannon P, Akolkar B, Cooper JD, Erlich HA, Julier C, Morahan G, Nerup J, Nierras C, et al. (2009). Genome-wide association study and meta-analysis find that over 40 loci affect risk of type 1 diabetes. Nat Genet 41, 703–707. - PMC - PubMed
    1. Bettelli E, Carrier Y, Gao W, Korn T, Strom TB, Oukka M, Weiner HL, and Kuchroo VK (2006). Reciprocal developmental pathways for the generation of pathogenic effector TH17 and regulatory T cells. Nature 441, 235–238. - PubMed
    1. Bible PW, Kanno Y, Wei L, Brooks SR, O’Shea JJ, Morasso MI, Loganantharaj R, and Sun HW (2015). PAPST, a user friendly and powerful Java platform for ChIP-seq peak co-localization analysis and beyond. PLoS One in press. - PMC - PubMed

Publication types

MeSH terms

Associated data