. 2015 May 19;42(5):929-41.
doi: 10.1016/j.immuni.2015.05.001.

Clonal Deletion Prunes but Does Not Eliminate Self-Specific αβ CD8(+) T Lymphocytes

Affiliations

Clonal Deletion Prunes but Does Not Eliminate Self-Specific αβ CD8(+) T Lymphocytes

Wong Yu et al. Immunity. .

Abstract

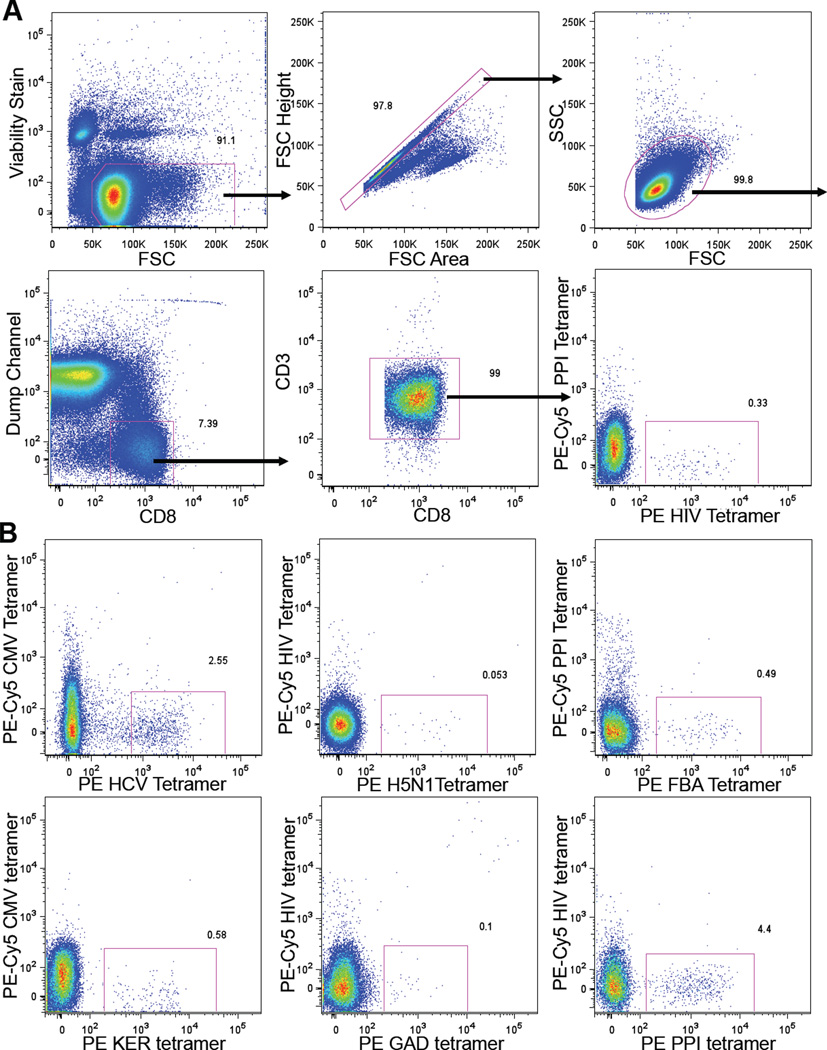
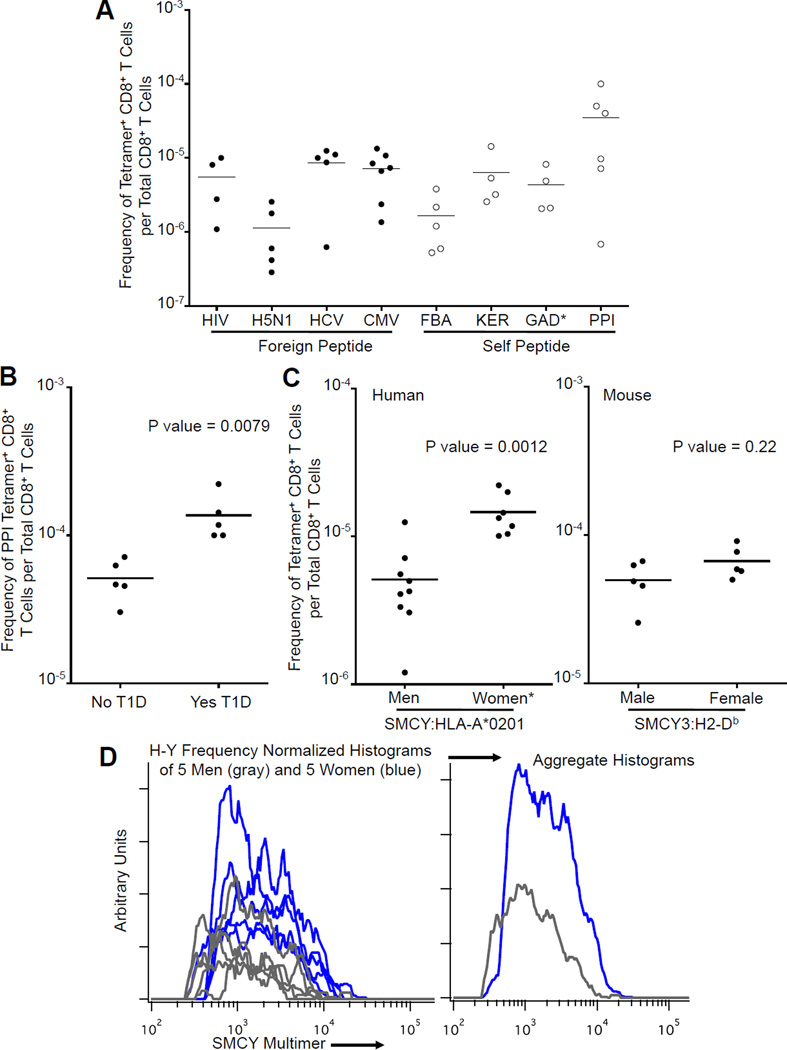
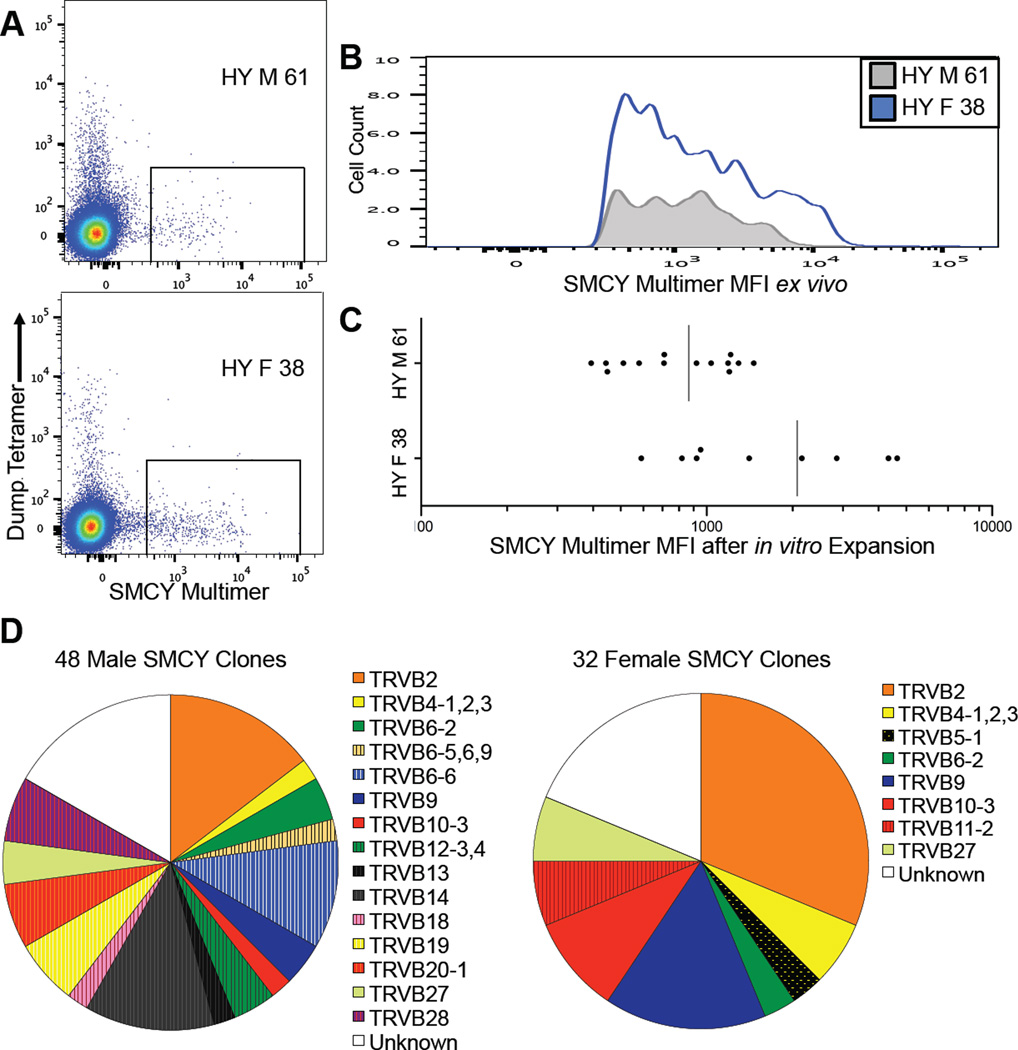
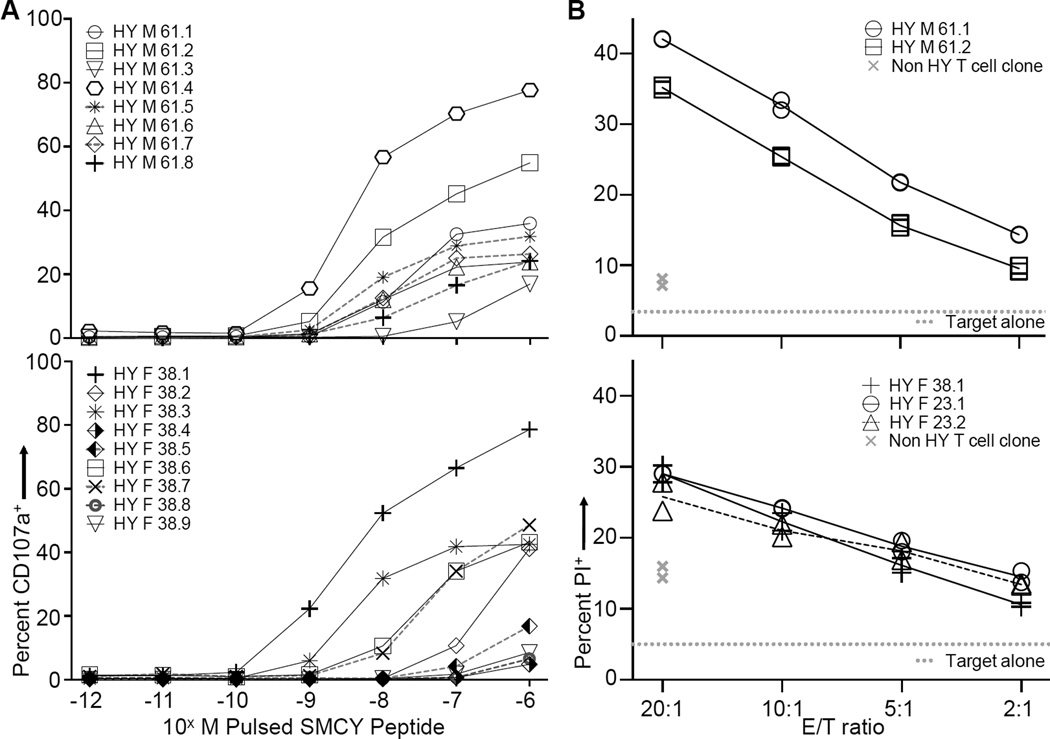
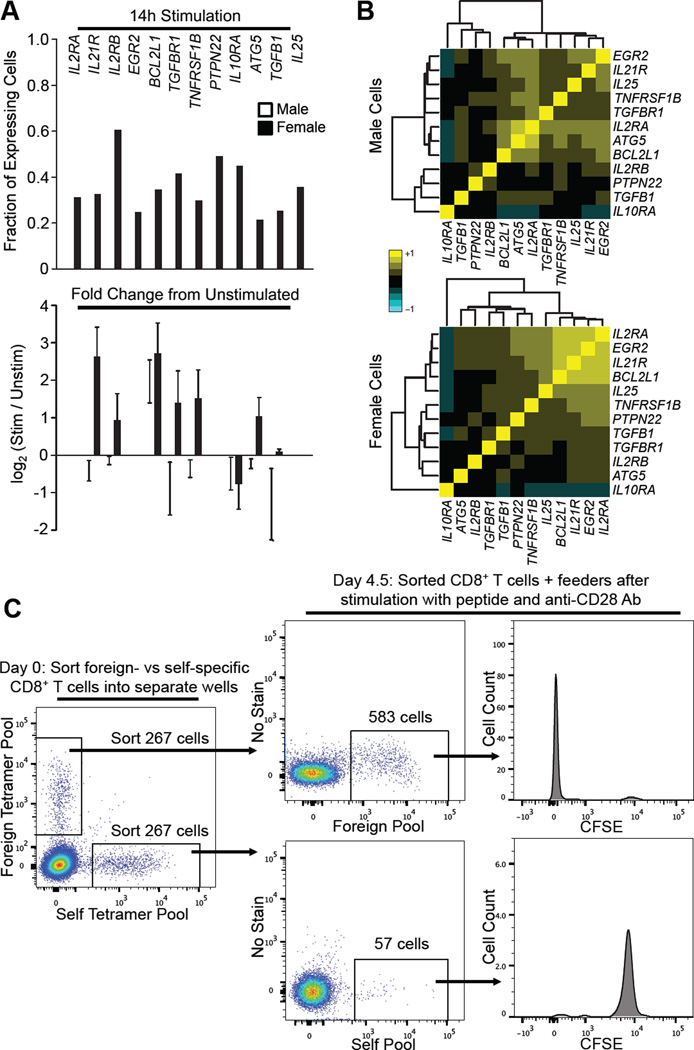
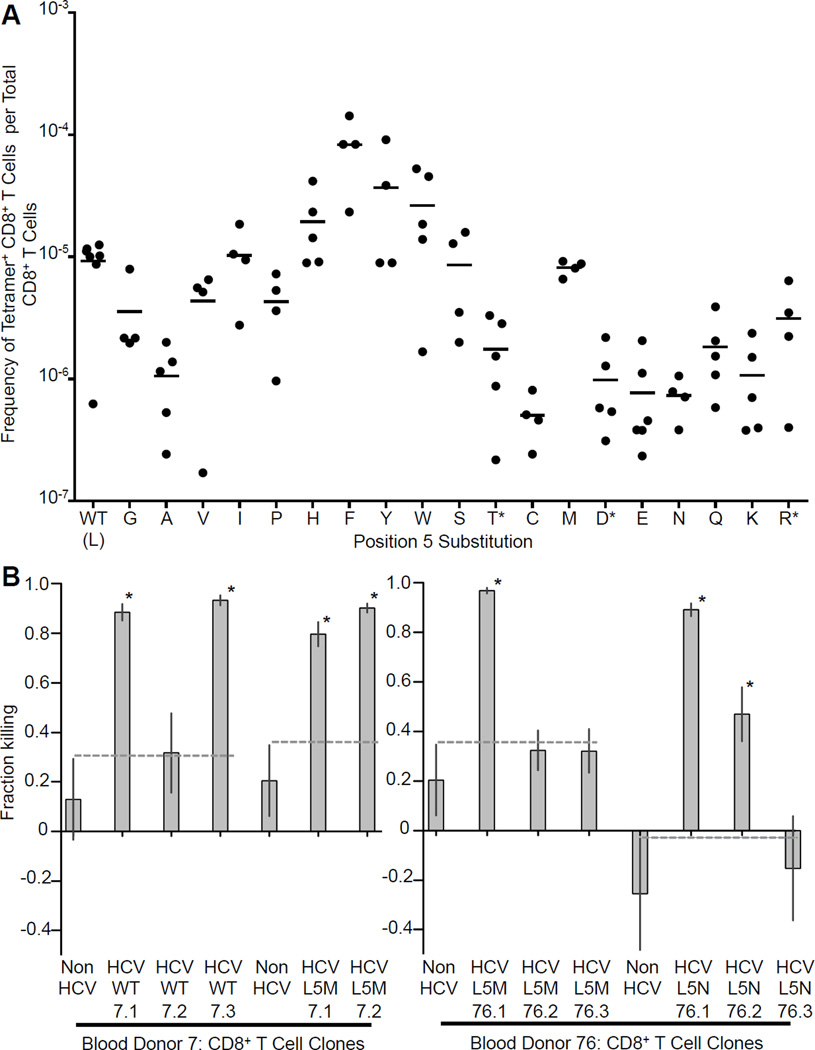
It has long been thought that clonal deletion efficiently removes almost all self-specific T cells from the peripheral repertoire. We found that self-peptide MHC-specific CD8(+) T cells in the blood of healthy humans were present in frequencies similar to those specific for non-self antigens. For the Y chromosome-encoded SMCY antigen, self-specific T cells exhibited only a 3-fold lower average frequency in males versus females and were anergic with respect to peptide activation, although this inhibition could be overcome by a stronger stimulus. We conclude that clonal deletion prunes but does not eliminate self-specific T cells and suggest that to do so would create holes in the repertoire that pathogens could readily exploit. In support of this hypothesis, we detected T cells specific for all 20 amino acid variants at the p5 position of a hepatitis C virus epitope in a random group of blood donors.


Figures

Figure 1
Figure 1. Flow Cytometry of Peptide HLA-A*0201 Tetramer Enriched CD8+ T Cells
(A) Flow cytometry gating scheme. PBMCs from a HLA-A*0201+ blood donor were concentrated for CD8+ T cells by depletion, followed by HIV:HLA-A*0201 tetramer enrichment over a magnetized column before flow cytometric analysis. Dump channel includes cells labeled with antibodies against CD4, CD14, CD16, CD19, and γδ TCR. In this case, the PE-Cy5 peptide HLA-A*0201 tetramer was only used as control for peptide MHC specific binding. (B) Representative flow cytometric plots of different peptide HLA-A*0201 tetramer enriched CD8+ T cells. Panels shown are gated on CD8+ T cells. See also Figure S1.
Figure 2
Figure 2. Frequency of Antigen Specific CD8+ T Cells
(A) Frequency of CD8+ T cells binding foreign versus self peptide HLA-A*0201 tetramers (human blood). The frequency of tetramer+ CD8+ T cells per total CD8+ T cells was determined using tetramer enrichment. Each point represents one sample from a separate individual. Bar indicates mean. (*GAD tetramer+ T cells not detected in two samples.) See also Table 1. (B) Frequency of PPI peptide specific CD8+ T cells in HLA-A*0201+ individuals with type 1 diabetes mellitus (T1D) versus controls. HLA-A*0201 tetramer enrichment was used to calculate the frequency of tetramer+ CD8+ T cells per total CD8+ T cells in whole blood. Each point represents one human blood sample. Bar indicates mean. P value calculated using Mann-Whitney test. See also Table S2. (C) Frequency of SMCY peptide specific CD8+ T cells in males versus females. Tetramer enrichment was used to calculate the frequency of tetramer+ CD8+ T cells per total CD8+ T cells. Each point represents one human blood sample or one mouse. Bar indicates mean. P value calculated using Mann-Whitney test. Left: Frequency of SMCY:HLA-A*0201 binding CD8+ T cells in men versus women. (*One blood sample from a female with a frequency of 1 in 3.5×10² was not included (see main text).) Right: Frequency of SMCY3:H2-Db binding CD8+ T cells in male mice versus female mice. (D) Histograms showing the intensity distribution of SMCY:HLA-A*0201 tetramer fluorescence on CD8+ T cells in men (gray) and women (blue). Histogram areas are normalized for the relative frequency of H-Y+ CD8+ T cells per total CD8+ T cells for each blood donor.
Figure 3
Figure 3. Single Cell FACS and in vitro Expansion of SMCY:HLA-A*0201 Specific CD8+ T Cells
(A) FACS plots gated for CD8+ T cells from one woman with no history of pregnancy (bottom, ID 38) and one man (top, ID 61) after tetramer enrichment. Gates shown for single cell FACS of SMCY:HLA-A*0201 binding CD8+ T cells used for in vitro expansion of T cells clones. (B) Plot of mean fluorescence intensity (MFI) of SMCY:HLA-A*0201 tetramer binding, primary CD8+ T cells from Figure 3A. (C) MFI of SMCY CD8+ T cell clones indicates that they are representative of the original population. Plot of MFI for SMCY:HLA-A*0201 multimer binding CD8+ T cell clones after in vitro expansion from one woman with no history of pregnancy (bottom, ID 38) and one man (top, ID 61). Each point represents one distinct T cell clone. Compare with relative fluorescence intensity of primary male or female derived CD8+ T cells in Figure 3A and 3B). (D) Pie chart showing TCR Vβ family expression of in vitro expanded SMCY:HLA-A*0201 binding CD8+ T cell clones from four men (IDs 61, 69, 74, 390) and four women (IDs 38, 67, 84, 86). Vβ antibody panel from Beckman Coulter. See also Table S3.
Figure 4
Figure 4. Broadly Overlapping Functional Avidity of SMCY:HLA-A*0201 Specific CD8+ T Cell Clones Derived from Men and Women
(A) CD107 mobilization assay performed on SMCY specific CD8+ T cell clones pulsed with 10−6M SMCY peptide followed by tenfold dilutions. Each line represents one distinct T cell clone. None of the clones responded to 10−6M negative control peptide (PPI) by this assay. T cell clones derived from female ID 38 (bottom) and male ID 61 (top). See also Figure S2A and S2B, and Table S3 for more clones. (B) Propidium iodide (PI) cytotoxicity assay. Graphs show the percentage of PI+ JY (male) target cells after incubation with SMCY specific CD8+ T cell clones at the indicated effector to target (E/T) ratios (symbols with black lines). Representative clones are from females ID 38 and 23 (bottom), and male ID 61 (top). A non specific CD8+ T cell clone derived from the same individuals is shown in each panel (gray “x” symbols). The gray dotted line indicates the background level of JY cell death in the absence of T cell clones. Performed in duplicate and representative of three to six experiments. The bottom panel combines data from two experiments; for that panel, values for the non HY T cell clone control and background target cell death were averaged. See also Figure S3C–E for additional clone and controls. An alternate cytotoxicity assay based on relative target cell survival is shown in Figure S3A and S3B.
Figure 5
Figure 5. Foreign-Specific CD8+ T Cells Expand in Response to Peptide + anti-CD28 Stimulation, while Self-Specific CD8+ T Cells Do Not
(A) Microfluidics based qPCR was performed individually on single CD8+ T cells binding the SMCY:HLA-A*0201 tetramer. Top: 152 cells from four males and 154 cells from four females (no history of pregnancy) were analyzed. Cells were stimulated 14 hours with SMCY peptide and anti-CD28 antibody. Only genes differentially expressed between women and men with p <0.05 and q < 0.15 are shown. Bottom: Fold change in gene expression after stimulation. qPCR was performed on unstimulated single CD8+ T cells binding the SMCY:HLA-A*0201 tetramer. 41 cells from one man and 38 cells from one woman were used in comparison to calculate fold difference in gene expression after 14 hours stimulation. Fold change could not be calculated for genes that were not expressed in unstimulated cells. (B) Coordinated mRNA expression of genes associated with proliferation and survival in female SMCY specific CD8+ T cells but not in males. Two-way clustered heatmaps of the correlation matrices for differentially expressed genes (p < 0.05 and q < 0.15) between male (top) and female (bottom) cells stimulated 14 hours with SMCY antigen and anti-CD28 antibody. Approximate value of correlation coefficient (R) indicated by color; 1.0 (yellow) indicates perfect correlation in the expression of two different genes on a per cell basis. (C) Cell expansion after peptide + anti-CD28 antibody stimulation of foreign-, but not self-specific CD8+ T cells. Equal numbers of tetramer+ CD8+ T cells, labeled by pooled tetramers loaded with either self or foreign peptides (Table S6, top), were sorted from a single blood sample into separate wells. Approximately 267 sorted cells for each group (self or foreign) were then stimulated in the presence of autologous feeder PBMCs with the same peptides with which they were tetramer selected at 1.5ug/ml and with anti-CD28 antibody at 5ug/ml. After 4.5 days, each sample was analyzed by flow cytometry. Panels gated on live CD8+ T cells. Sample in this figure is representative of five experiments, analyzed at 4.5 and/or 7.5 days; three of the five experiments included CFSE staining. See also Figure S5E and S5F, and Table S6.
Figure 6
Figure 6. Broad Recognition of All Position 5 Amino Acid Substitutions of the HLA-A* 0201 Restricted Peptide KLVALGINAV
(A) Frequency of CD8+ T cells recognizing position 5 amino acid substitutions of the HLA-A* 0201 restricted peptide KLVALGINAV. Frequency of tetramer+ CD8+ T cells per total CD8+ T cells calculated by tetramer enrichment. Each point represents one sample. Bar indicates mean. (*Tetramer+ T cells not detected in one sample.) (B) Cytotoxicity assay (based on relative target cell survival): CD8+ T cell clones recognize endogenously processed and presented HCV WT or variant antigen. Preferential killing of JY target cells expressing HCV NS3 protein containing the target HCV variant peptide versus a negative control HCV variant peptide after 18 hours incubation with a twenty fold excess of CD8+ T cell clone. 95% confidence intervals shown for experiments performed in triplicate. WT indicates wildtype HCV epitope. The dotted line indicates upper 95% confidence interval of a negative control T cell clone (label: non HCV) that does not bind any of the HCV variant tetramers. (*p<0.025: indicates significant difference in killing from negative control.) See also Figure S6 for CD107 mobilization assay with HCV peptide titration curves, and Table S7.

Comment in

References

    1. Alanio C, Lemaitre F, Law HK, Hasan M, Albert ML. Enumeration of human antigen-specific naive CD8+ T cells reveals conserved precursor frequencies. Blood. 2010;115:3718–3725. - PubMed
    1. Anderson MS, Venanzi ES, Klein L, Chen Z, Berzins SP, Turley SJ, von Boehmer H, Bronson R, Dierich A, Benoist C, Mathis D. Projection of an immunological self shadow within the thymus by the aire protein. Science. 2002;298:1395–1401. - PubMed
    1. Appay V, Dunbar PR, Callan M, Klenerman P, Gillespie GM, Papagno L, Ogg GS, King A, Lechner F, Spina CA, et al. Memory CD8+ T cells vary in differentiation phenotype in different persistent virus infections. Nat Med. 2002;8:379–385. - PubMed
    1. Barnea E, Beer I, Patoka R, Ziv T, Kessler O, Tzehoval E, Eisenbach L, Zavazava N, Admon A. Analysis of endogenous peptides bound by soluble MHC class I molecules: a novel approach for identifying tumor-specific antigens. Eur J Immunol. 2002;32:213–222. - PubMed
    1. Bautista JL, Lio CW, Lathrop SK, Forbush K, Liang Y, Luo J, Rudensky AY, Hsieh CS. Intraclonal competition limits the fate determination of regulatory T cells in the thymus. Nat Immunol. 2009;10:610–617. - PMC - PubMed

Publication types

Substances