

How Has the Age-Related Process of Overweight or Obesity Development Changed over Time? Co-ordinated Analyses of Individual Participant Data from Five United Kingdom Birth Cohorts
- PMID: 25993005
- PMCID: PMC4437909
- DOI: 10.1371/journal.pmed.1001828
How Has the Age-Related Process of Overweight or Obesity Development Changed over Time? Co-ordinated Analyses of Individual Participant Data from Five United Kingdom Birth Cohorts
Abstract
Background: There is a paucity of information on secular trends in the age-related process by which people develop overweight or obesity. Utilizing longitudinal data in the United Kingdom birth cohort studies, we investigated shifts over the past nearly 70 years in the distribution of body mass index (BMI) and development of overweight or obesity across childhood and adulthood.
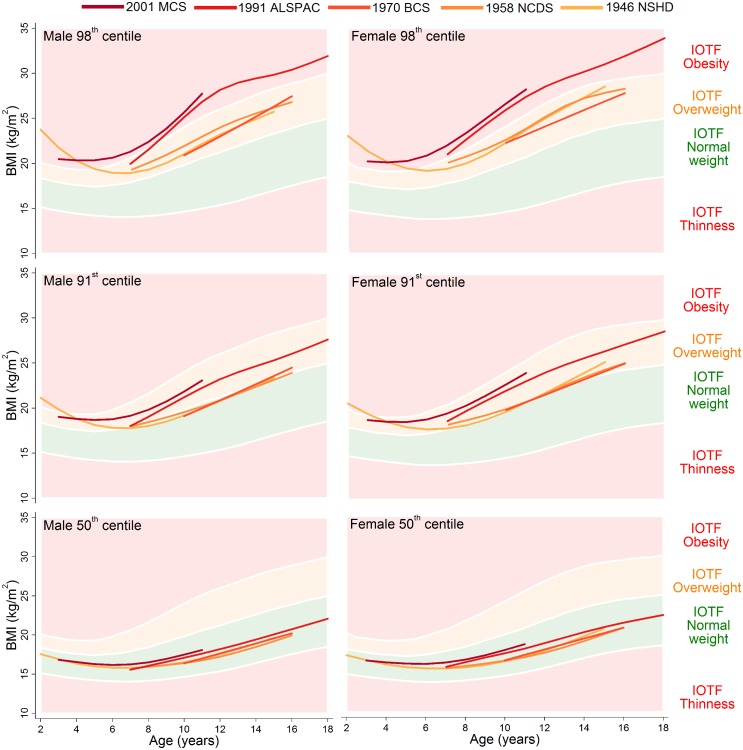
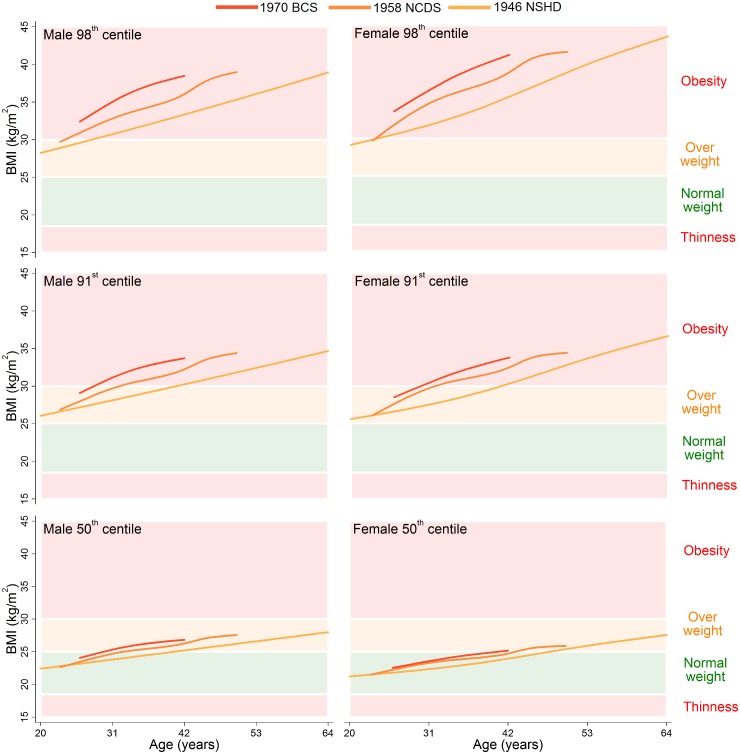
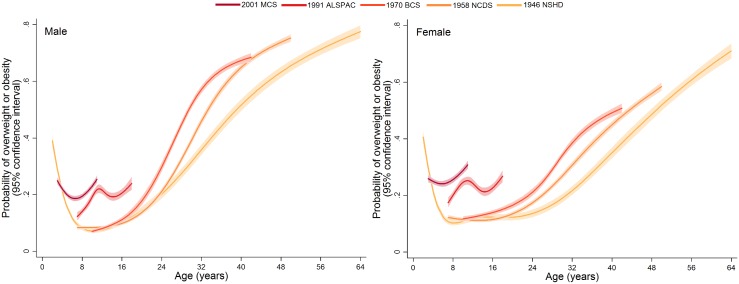
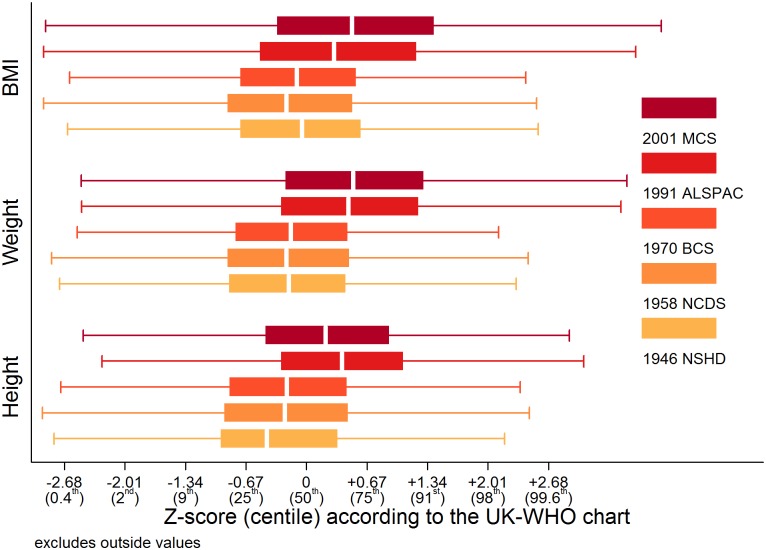
Methods and findings: The sample comprised 56,632 participants with 273,843 BMI observations in the 1946 Medical Research Council National Survey of Health and Development (NSHD; ages 2-64 years), 1958 National Child Development Study (NCDS; 7-50), 1970 British Cohort Study (BCS; 10-42), 1991 Avon Longitudinal Study of Parents and Children (ALSPAC; 7-18), or 2001 Millennium Cohort Study (MCS; 3-11). Growth references showed a secular trend toward positive skewing of the BMI distribution at younger ages. During childhood, the 50th centiles for all studies lay in the middle of the International Obesity Task Force normal weight range, but during adulthood, the age when a 50th centile first entered the overweight range (i.e., 25-29.9 kg/m2) decreased across NSHD, NCDS, and BCS from 41 to 33 to 30 years in males and 48 to 44 to 41 years in females. Trajectories of overweight or obesity showed that more recently born cohorts developed greater probabilities of overweight or obesity at younger ages. Overweight or obesity became more probable in NCDS than NSHD in early adulthood, but more probable in BCS than NCDS and NSHD in adolescence, for example. By age 10 years, the estimated probabilities of overweight or obesity in cohorts born after the 1980s were 2-3 times greater than those born before the 1980s (e.g., 0.229 [95% CI 0.219-0.240] in MCS males; 0.071 [0.065-0.078] in NSHD males). It was not possible to (1) model separate trajectories for overweight and obesity, because there were few obesity cases at young ages in the earliest-born cohorts, or (2) consider ethnic minority groups. The end date for analyses was August 2014.
Conclusions: Our results demonstrate how younger generations are likely to accumulate greater exposure to overweight or obesity throughout their lives and, thus, increased risk for chronic health conditions such as coronary heart disease and type 2 diabetes mellitus. In the absence of effective intervention, overweight and obesity will have severe public health consequences in decades to come.
Conflict of interest statement
The authors have declared that no competing interests exist.
Figures
Comment in
-
UK children are more than twice as likely to be obese than previous generations, figures show.BMJ. 2015 May 19;350:h2710. doi: 10.1136/bmj.h2710. BMJ. 2015. PMID: 25995367 No abstract available.
References
-
- McPherson K, Marsh T, Brown M (2007) Foresight Tackling obesities: Future choices—Modelling future trends in obesity and their impact on health. London, UK: Government Office for Science; 10.1093/heapro/dat007 - DOI
-
- Craig R, Mindell J (2013) Health Survey for England 2012. London, UK: The Information Centre.
-
- Department of Health Social Services and Public Safety (2012) Health Survey Northern Ireland: First Results from the 2011/12 Survey. Belfast, Northern Ireland: Public Health Information and Research Branch.
-
- The Scottish Government (2013) The Scottish Health Survey 2012, Volume 1: Main Report. Edinburgh, Scotland: The Scottish Government.
-
- Welsh Government (2013) The Welsh Health Survey, 2012. Cardiff, Wales: The Welsh Government; http://gov.wales/docs/statistics/2013/130911-welsh-health-survey-2012-en...
Publication types
MeSH terms
Grants and funding
LinkOut - more resources
Full Text Sources
Other Literature Sources
Medical
Miscellaneous
