Review
. 2015 Jul-Aug;21(4):293-306.
doi: 10.5152/dir.2014.14467.

Imaging the posterior mediastinum: a multimodality approach

Affiliations
Review

Imaging the posterior mediastinum: a multimodality approach

Mariaelena Occhipinti et al. Diagn Interv Radiol. 2015 Jul-Aug.

Abstract

The posterior mediastinum contains several structures that can produce a wide variety of pathologic conditions. Descending thoracic aorta, esophagus, azygos and hemiazygos veins, thoracic duct, lymph nodes, adipose tissue, and nerves are all located in this anatomical region and can produce diverse abnormalities. Although chest radiography may detect many of these pathologic conditions, computed tomography and magnetic resonance are the imaging modalities of choice for further defining the relationship of posterior mediastinal lesions to neighboring structures and showing specific imaging features that narrow the differential diagnosis. This review emphasizes modality-related answers to morphologic questions, which provide precise diagnostic information.


Figures

Figure 1
Figure 1
a, b. A 59-year-old male with multiple schwannomas. Axial CT scan (a) shows a paravertebral soft-tissue mass, with well-defined margins and low-attenuation central area (arrow) within the lesion. T2-weighted MRI (b) shows the mass with a central area of high signal intensity (arrow) surrounded by low-to-intermediate intensity signals.
Figure 2
Figure 2
a–c. A 35-year-old male with ganglioneuroma. Axial unenhanced CT image (a) shows a paravertebral soft-tissue mass with patchy fat-attenuating areas (arrows). Axial T2-weighted MRI (b) shows the mass with heterogeneous signal intensity, lower in the anterior portion (thin white arrows) and similar to cerebrospinal fluid in the most posterior part (black arrow). Lesion widens towards adjacent intervertebral foramen (thick white arrow) and causes displacement of the thecal sac towards right (open arrow). Axial T2-weighted MRI (c) shows curved hypointense signals (arrows) scattered among hyperintense signals, giving rise to a “whorled” appearance.
Figure 3
Figure 3
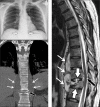
a–c. A 34-year-old male with Pott’s disease. Posteroanterior chest radiography (CXR) (a) shows widening of both paraspinal lines (arrows) in lower third of the mediastinum. Coronal CT reformation (b) shows collapse of the vertebral body (black arrow) and craniocaudal extent of paravertebral abscess (white arrows), which caused widening of paraspinal lines on CXR. Sagittal T2-weighted MRI (c) shows increased signal intensity within the affected vertebral body, adjacent intervertebral discs (thick white arrows), and the paravertebral abscess (thin white arrows). Abscess shows typical sub-ligamentous spread beneath anterior and posterior longitudinal ligaments, with posterior displacement and compression of the spinal cord (black arrow). Sagittal image also reveals the gibbus deformity, caused by the collapse of the anterior part of the vertebral body.
Figure 4
Figure 4
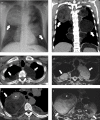
a–f. A 60-year-old male with extramedullary hematopoiesis, history of chronic anemia, and previous splenectomy. Posteroanterior CXR (a) shows multiple rounded opacities of various dimensions (biggest ones indicated by arrows) in both hemithoraces, without silhouetting heart and aorta. Coronal CT reformation image (b) confirms multiple masses (biggest ones indicated by arrows), with well-defined borders, along paravertebral areas. Axial unenhanced CT image (c) shows well-defined bilateral masses (arrows) with homogeneous fat attenuation in paraspinal areas at the level of T4. Fat attenuation values indicate inactivity of lesion. Axial T2-weighted MRI (d) at the same level as (c) shows bilateral masses (arrows) with signal intensity similar to mediastinal adipose tissue. Fatty deposition is consistent with inactivity of the the lesion. Axial unenhanced CT image (e) shows other bilateral paraspinal masses (arrows) at the level of T6 with higher attenuation values than the lesions shown in (c). Note a soft-tissue rounded area (asterisk) in the non-dependent portion of the right mass. Axial T2-weighted image (f) at the same level as (e) shows areas with low signal intensity (asterisks) and areas with high signal intensity (arrows) due to fat deposition within the masses.
Figure 5
Figure 5
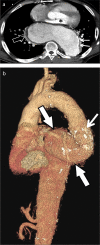
a, b. A 49-year-old man with “stable” aortic aneurysm. Axial contrast-enhanced CT scan (a) shows a large aneurysm of descending aorta with calcifications (thin white arrows) along the aortic wall. Large aneurysm causes passive atelectasis of the adjacent lung parenchyma (black arrow) and compression of the heart (asterisk). Three-dimensional volume rendering image from lateral view (b) shows tortuosity of descending aorta and the extent of descending thoracic aorta aneurysm (thick arrows), which continues into abdominal aorta. Note also calcifications (thin arrow) along the aortic wall.
Figure 6
Figure 6
a, b. A 55-year-old woman with aortic dissection type B. Axial (a) and sagittal (b) contrast-enhanced CT images show intimal flap (arrow) in the descending aorta dividing true (t) and false (f ) lumens and partial thrombosis of the false lumen (white arrow).
Figure 7
Figure 7
a, b. A 48-year-old man with esophageal varices and cirrhosis. Posteroanterior CXR (a) shows widening of the inferior third of the azygoesophageal recess (arrows). Axial enhanced CT scan obtained in venous phase (b) shows multiple enlarged venous vessels (white arrows) closely juxtaposed to the outer wall of the esophagus (black arrow), consistent with paraesophageal varices.
Figure 8
Figure 8
a, b. A 59-year-old man with squamous cell carcinoma of the esophagus. Coronal reformation CT image at mediastinal window setting (a) shows craniocaudal extent of the mass (thick arrow) in the middle third of the esophagus, with heterogeneous contrast enhancement. Pulmonary embolism of interlobar artery can also be seen (thin arrows). 18F-FDG-PET/CT scan (b) shows increased tracer uptake in the esophageal tumor (arrows) without any additional area of hypermetabolism.
Figure 9
Figure 9
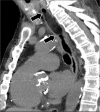
A 90-year-old man with fibrovascular polyp. Unenhanced sagittal CT image shows a 6 cm mass (between arrows) of fat attenuation within the upper thoracic esophagus.
Figure 10
Figure 10
a–c. A 50-year-old woman with esophageal duplication cyst. Axial enhanced CT image (a) shows a homogeneous mass (thick arrow) of water attenuation with well-defined borders, located in the lower right part of posterior mediastinum, closely adjacent to the esophageal wall (thin arrow). Axial T2-weighted half-Fourier acquisition single-shot turbo spin-echo MRI (b) demonstrates high signal intensity within the lesion (arrow), compatible with serous content. Axial T1-weighted image after contrast administration (c) shows complete absence of enhancement within the cyst (arrow), a characteristic of benignity.
Figure 11
Figure 11
a–c. A 60-year-old man with diffuse large B-cell lymphoma. Axial enhanced CT scan image (a) shows a soft-tissue mass (black arrow) in the paravertebral area, with smooth and regular margins towards the left lung parenchyma. Mass extends into the spinal canal through the widened intervertebral canal (white arrow). Axial (b) and sagittal (c) 18FDG-PET/CT fusion images show intense FDG uptake in the mass (black arrow) and in the vertebral canal (thin arrows), consistent with invasion of the vertebral canal.
Figure 12
Figure 12
a, b. A 76-year-old woman with liposarcoma. Posteroanterior CXR (a) shows rounded opacity (white arrows) with smooth borders superimposed on aortic knob (open arrow), without producing a “silhouette sign” with the aorta. Lack of the “silhouette sign” implies that the lesion is anterior or posterior to the aorta. Sagittal CT reformation (b) shows a heterogeneous posterior mediastinal mass containing areas of fat (white arrow) and soft-tissue attenuation (black arrow).
Figure 13
Figure 13
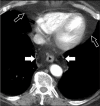
An 81-year-old woman with mediastinal lipomatosis. Axial CT image demonstrates excess fat deposition in the lower posterior mediastinum (white arrows) around the esophagus without compression. Note prominent fat in cardiophrenic angles (black arrows), consistent with epicardial fat pads.
Figure 14
Figure 14
a, b. A 51-year-old man with acute abdominal pain and paraesophageal hernia. Posteroanterior CXR (a) shows large opacity (white arrows) with inner air-fluid level (black arrow). Enhanced axial CT image after oral contrast administration (b) shows herniation of part of the stomach (asterisk) and abdominal adipose tissue (black arrow) through esophageal hiatus. Note separation between the esophagus (white arrow) and stomach (asterisk).
Figure 15
Figure 15
a, b. A 48-year-old man with Bochdalek hernia. Axial (a) and coronal reformation (b) CT images show herniation of abdominal fat through discontinuity of the medial portion of the diaphragm (arrows).
Figure 16
Figure 16
a–c. Intrathoracic goiter in a 60-year-old woman. Posteroanterior CXR (a) shows opacity (thin arrows) above the level of the right clavicle, with sharp and well-defined margins (“cervicothoracic sign”) due to its location in posterior mediastinum. The mass produces left displacement of the trachea (open arrow). Axial (b) and sagittal (c) enhanced CT images show a heterogeneous soft-tissue mass with hypodense areas (black arrows) due to cystic degeneration in the posterior mediastinum. Goiter causes compression and rightward displacement of the esophagus (white arrow). The mass extends from the cervical region as a continuation of the thyroid gland (asterisk).

References

    1. Zylak CJ. Diagnostic approach to radiology of the mediastinum. In: Taveras LM, Ferrucci JT, editors. Radiology: diagnosis-imaging-intervention. Philadelphia: Lippincott; 1986.
    1. Reeder LB. Neurogenic tumors of the mediastinum. Semin Thorac Cardiovasc Surg. 2000;12:261–267. http://dx.doi.org/10.1053/stcs.2000.16738. - DOI - PubMed
    1. Strollo DC, Rosado-de-Christenson ML, Jett JR. Primary mediastinal tumors: part II. Tumors of the middle and posterior mediastinum. Chest. 1997;112:1344–1357. http://dx.doi.org/10.1378/chest.112.5.1344. - DOI - PubMed
    1. Kawashima A, Fishman EK, Kuhlman JE, Nixon MS. CT of posterior mediastinal masses. Radiographics. 1991;11:1045–1067. http://dx.doi.org/10.1148/radiographics.11.6.1749849. - DOI - PubMed
    1. Balcombe J, Torigian DA, Kim W, Miller WT., Jr Cross-sectional imaging of paragangliomas of the aortic body and other thoracic branchiomeric paraganglia. AJR Am J Roentgenol. 2007;188:1054–1058. http://dx.doi.org/10.2214/AJR.05.1497. - DOI - PubMed

MeSH terms

LinkOut - more resources