

Prediction of remission in obsessive compulsive disorder using a novel machine learning strategy
- PMID: 25994109
- PMCID: PMC5466447
- DOI: 10.1002/mpr.1463
Prediction of remission in obsessive compulsive disorder using a novel machine learning strategy
Abstract
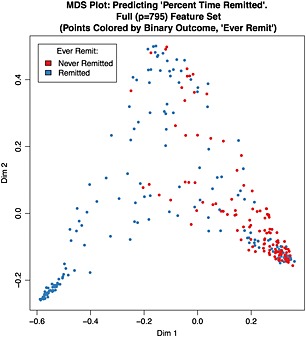
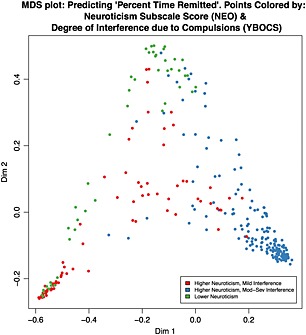
The study objective was to apply machine learning methodologies to identify predictors of remission in a longitudinal sample of 296 adults with a primary diagnosis of obsessive compulsive disorder (OCD). Random Forests is an ensemble machine learning algorithm that has been successfully applied to large-scale data analysis across vast biomedical disciplines, though rarely in psychiatric research or for application to longitudinal data. When provided with 795 raw and composite scores primarily from baseline measures, Random Forest regression prediction explained 50.8% (5000-run average, 95% bootstrap confidence interval [CI]: 50.3-51.3%) of the variance in proportion of time spent remitted. Machine performance improved when only the most predictive 24 items were used in a reduced analysis. Consistently high-ranked predictors of longitudinal remission included Yale-Brown Obsessive Compulsive Scale (Y-BOCS) items, NEO items and subscale scores, Y-BOCS symptom checklist cleaning/washing compulsion score, and several self-report items from social adjustment scales. Random Forest classification was able to distinguish participants according to binary remission outcomes with an error rate of 24.6% (95% bootstrap CI: 22.9-26.2%). Our results suggest that clinically-useful prediction of remission may not require an extensive battery of measures. Rather, a small set of assessment items may efficiently distinguish high- and lower-risk patients and inform clinical decision-making.
Keywords: obsessive compulsive disorder; risk factors; statistics.
Copyright © 2015 John Wiley & Sons, Ltd.
Figures

References
-
- Arnold S.E., Xie S.X., Leung Y.Y., Wang L.S., Kling M.A., Han X., Kim E.J., Wolk D.A., Bennett D.A., Chen‐Plotkin A., Grossman M., Hu W., Lee V.M., Mackin R.S., Trojanowski J.Q., Wilson R.S., Shaw L.M. (2012) Plasma biomarkers of depressive symptoms in older adults. Translational Psychiatry, 2(1), e65 DOI: 10.1038/tp.2011.63 - DOI - PMC - PubMed
-
- Biau G. (2012) Analysis of a Random Forests model. Journal of Machine Learning Research, 13(1), 1063–1095.
-
- Biau G., Devroye L., Lugosi G. (2008) Consistency of Random Forests and other averaging classifiers. Journal of Machine Learning Research, 9, 2015–2033.
-
- Biener L., Abrams D.B. (1991) The contemplation ladder: Validation of a measure of readiness to consider smoking cessation. Health Psychology, 10(5), 360–365. - PubMed
Publication types
MeSH terms
Grants and funding
LinkOut - more resources
Full Text Sources
Other Literature Sources
Medical
