. 2015 May 21:5:10494.
doi: 10.1038/srep10494.

A new look at the essence of the imaging photoplethysmography

Affiliations

A new look at the essence of the imaging photoplethysmography

Alexei A Kamshilin et al. Sci Rep. .

Abstract

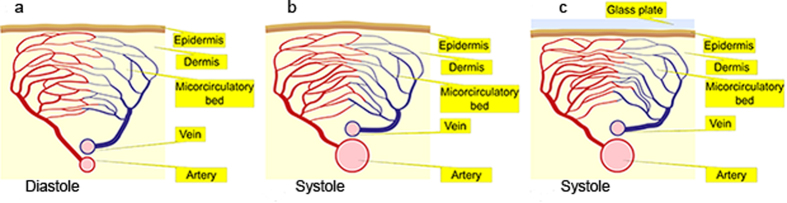
Photoplethysmography (PPG) is a noninvasive optical method accepted in the clinical use for measurements of arterial oxygen saturation. It is widely believed that the light intensity after interaction with the biological tissue in vivo is modulated at the heartbeat frequency mainly due to pulsatile variations of the light absorption caused by arterial blood-volume pulsations. Here we report experimental observations, which are not consistent with this model and demonstrate the importance of elastic deformations of the capillary bed in the formation of the PPG waveform. These results provide new insight on light interaction with live tissue. To explain the observations we propose a new model of PPG in which pulse oscillations of the arterial transmural pressure deform the connective-tissue components of the dermis resulting in periodical changes of both the light scattering and absorption. These local changes of the light-interaction parameters are detected as variations of the light intensity returned to a photosensitive camera. Therefore, arterial pulsations can be indirectly monitored even by using the light, which slightly penetrates into the biological tissue.


Figures

Figure 1
Figure 1. Mapping the PPG amplitude.
Two examples of spatial distribution of the PPG amplitude (a) and (b) overlaid with raw camera images measured in two different subjects. Maps of the positions of the spots in which we observed the maximal PPG amplitude for the left hand (c) and for the right hand (d) as collected for all studied subjects: one black circle for one subject. The colour scale on the right shows the pulsation amplitude as the AC/DC ratio of the PPG waveform. The figure was drawn by A.K.
Figure 2
Figure 2. Counter-phase PPG waveforms.
Map of the PPG amplitude (a) and the enlarged patch (b) of this amplitude map. A fragment from the map of blood pulsations phase (c) having the same size and position as the patch (b). Distribution of PPG pulsations (d) considering their relative phase in the area within the black circle shown in (b) and (c). PPG waveforms (e) calculated in ROIs of 3 × 3 pixels chosen in the points with extreme amplitude within the black circle. The colour scales alongside with pulsations maps are in degrees and in per cents for phase and amplitude PPG maps, respectively.
Figure 3
Figure 3. Spatial distribution of the PPG amplitude for different forces of the contact between the glass table and the skin of one of the subjects
. (a)–noncontact iPPG; (b)–gentle contact; (c)–enforced contact by the distributed weight of 1.7 kg. Respective PPG waveforms are shown on the right being calculated in the ROIs of 3 × 3 pixels chosen in the same point of the little finger. The colour scales show the PPG amplitude as the AC/DC ratio in per cent.
Figure 4
Figure 4. Simplified diagram of the new concept of the PPG signal formation.
(a) A part of the artery, which is situated near the dermis, in the diastole phase; (b) the artery in the systole phase in the case of free skin surface; (c) the systole phase in the case of the skin contact with the glass. Note that the density of vessels in the microcirculatory bed is the lowest in (a) and the highest in (c). The figure was drawn by I.S.
Figure 5
Figure 5. Schematic view of the experimental setups.
(a) Mapping the position of the spots with maximal PPG amplitude, and (b) studying the influence of the mechanical contact on the PPG waveform. LEDs are light-emitting diodes; P1 and P2 are polarizers with orthogonally oriented transmission axes. The figure was drawn by E.N.

References

    1. Kamal A. A. R., Harness J. B., Irving G & Mearns A. J. Skin photoplethysmography - a review. Comp. Method. Prog. Biomed. 28, 257–269 (1989). - PubMed
    1. Allen J. Photoplethysmography and its application in clinical physiological measurement. Physiol. Meas. 28, R1–R40 (2007). - PubMed
    1. Reisner A., Shaltis P. A., McCombie D. & Asada H. H. Utility of the photoplethysmogram in circulatory monitoring. Anesthesiology 108, 950–958 (2008). - PubMed
    1. Mannheimer P. D. The light-tissue interaction of pulse oximetry. Anesth. Analg. 105, S10–S17 (2007). - PubMed
    1. Shelley K. H. Photoplethysmography: beyond the calculation of arterial oxygen saturation and heart rate. Anesth. Analg. 105, S31–S36 (2007). - PubMed

Publication types