. 2015 May 21:6:7169.
doi: 10.1038/ncomms8169.

Large-scale spatiotemporal spike patterning consistent with wave propagation in motor cortex

Affiliations

Large-scale spatiotemporal spike patterning consistent with wave propagation in motor cortex

Kazutaka Takahashi et al. Nat Commun. .

Abstract

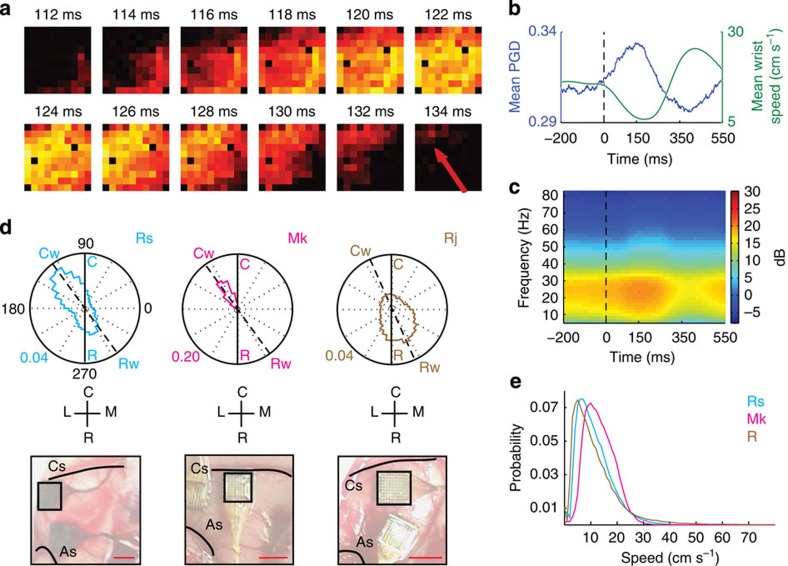
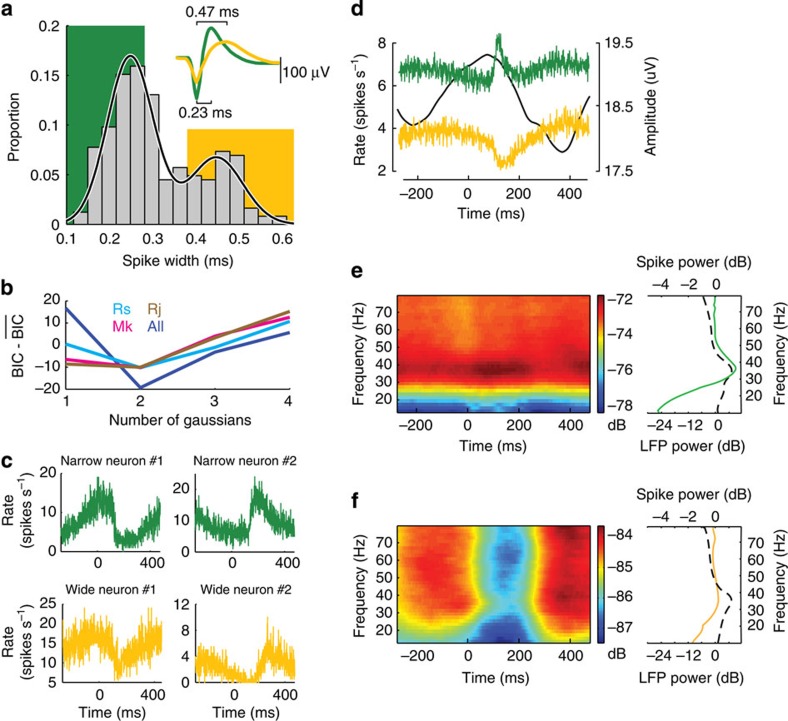
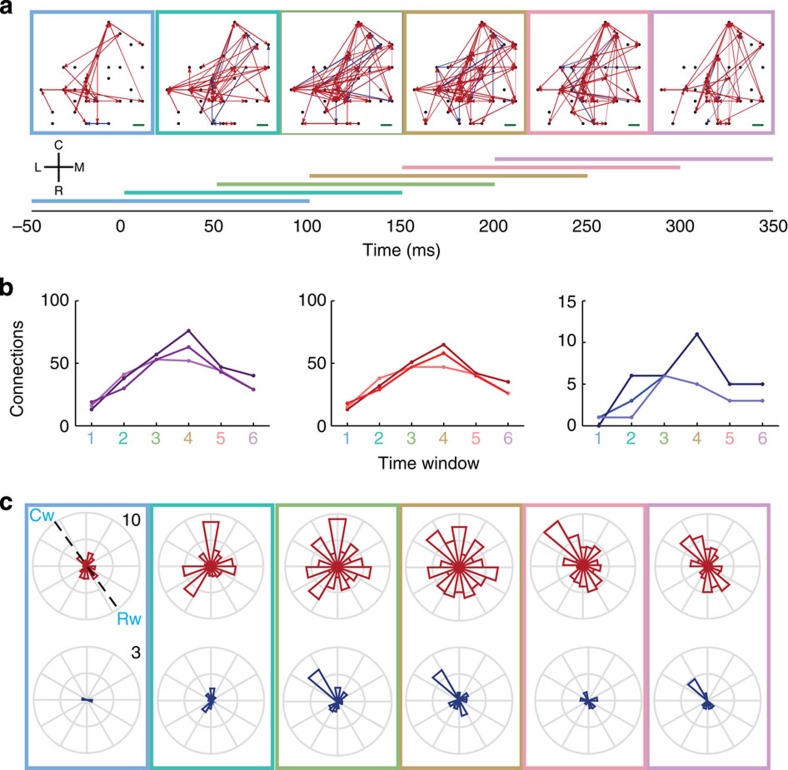
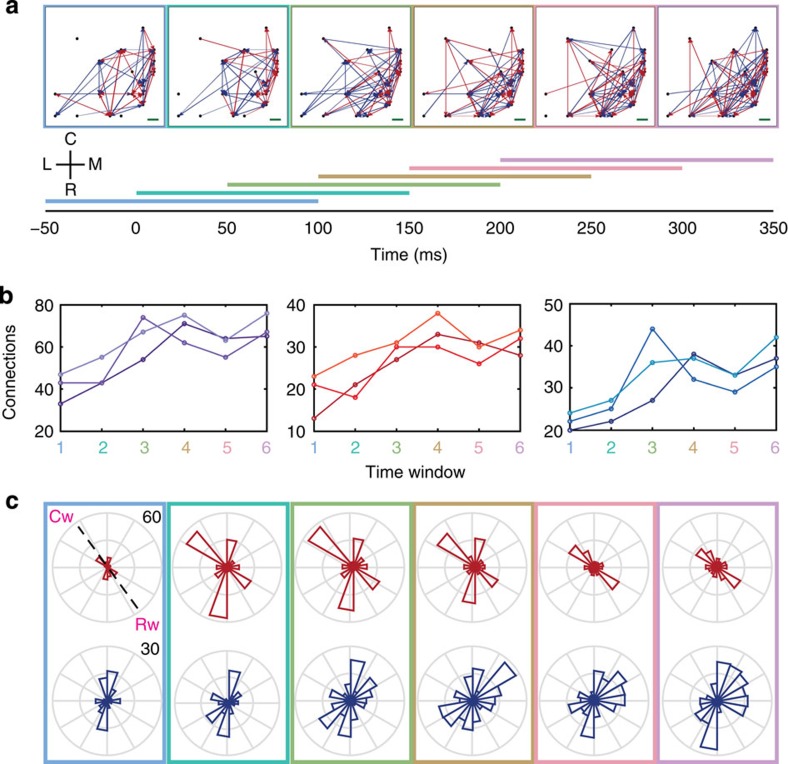
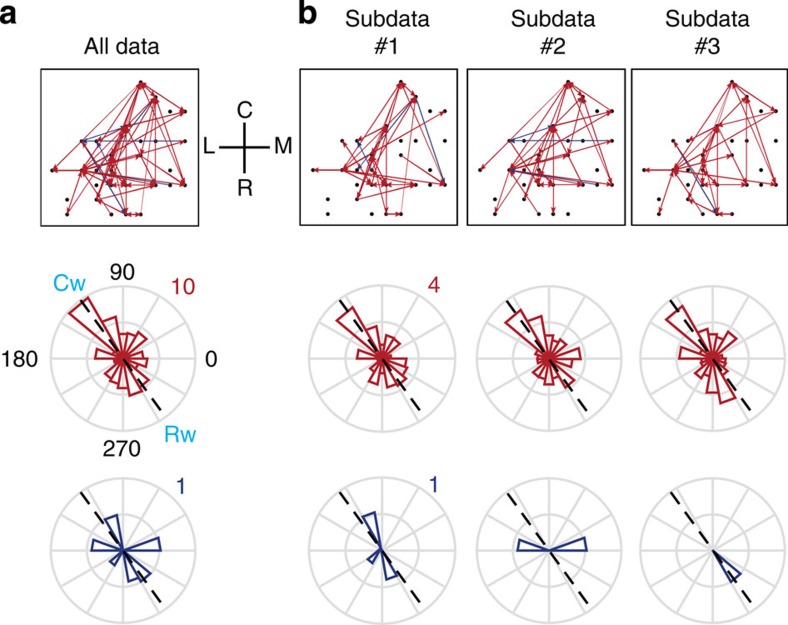
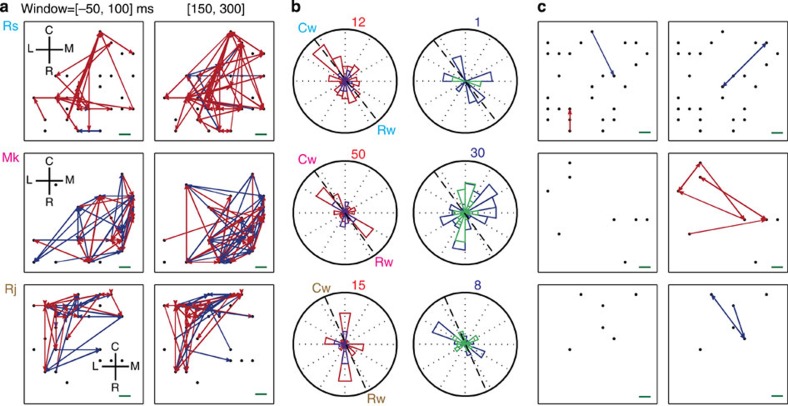
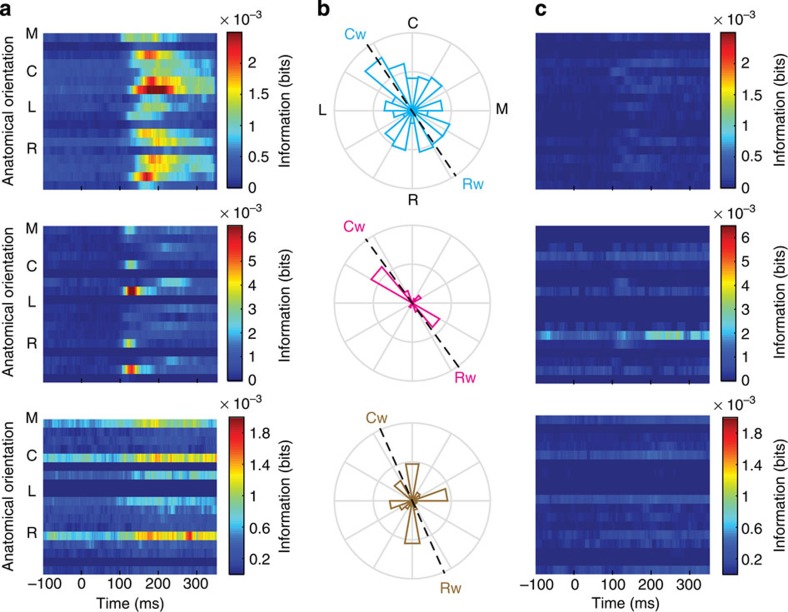
Aggregate signals in cortex are known to be spatiotemporally organized as propagating waves across the cortical surface, but it remains unclear whether the same is true for spiking activity in individual neurons. Furthermore, the functional interactions between cortical neurons are well documented but their spatial arrangement on the cortical surface has been largely ignored. Here we use a functional network analysis to demonstrate that a subset of motor cortical neurons in non-human primates spatially coordinate their spiking activity in a manner that closely matches wave propagation measured in the beta oscillatory band of the local field potential. We also demonstrate that sequential spiking of pairs of neuron contains task-relevant information that peaks when the neurons are spatially oriented along the wave axis. We hypothesize that the spatial anisotropy of spike patterning may reflect the underlying organization of motor cortex and may be a general property shared by other cortical areas.


Figures

Figure 1
Figure 1. Properties of LFP beta waves.
(a) Temporal snapshots of the LFP voltages across the array indicating wave propagation. The LFP voltage on each electrode was band-pass filtered in the beta frequency range (that is, ±3 Hz centred at the beta peak of the power spectrum). Time in milliseconds labelled above each plot is with respect to the onset of the visual target. The red arrow in the bottom right panel shows the propagation direction of the wave. (b) Temporal evolution of the GOF measure of planar wave activity (PGD in blue ranging from 0.295 to 0.335, as well as the mean hand speed (green) ranging from 5 to 36 cm s−1. (c) Averaged spectrogram of a single-channel LFP revealing the temporal dynamics in beta frequency power relative to the visual target onset. (d) Circular distributions of wave propagation directions for monkeys Rs (cyan), Mk (magenta) and Rj (brown). A solid black line denotes the rostro–caudal axis on the cortical surface. A dashed line in each rose plot connecting Cw (caudal wave direction) and Rw (rostral wave direction) denotes the axis defined by the first or only mode of beta wave propagation axis. Each panel below the circular distributions depicts the location of the multielectrode arrays (4 × 4 mm) in the arm area of MI for the corresponding subject. A red horizontal bar in the right lower corner in each panel is 4 mm. Landmarks and orientations: Cs, central sulcus; As, arcuate sulcus; C, caudal; R, rostral; M, medial; L, lateral. (e) Distributions of estimated propagation speeds for monkeys Rs (cyan), Mk (magenta) and Rj (brown).
Figure 2
Figure 2. Two functional cell classes based on extracellular spike waveform width.
(a) Histograms of spike waveform widths for all three monkeys, Rs, Mk and Rj. The solid curve indicates the fit using mixture of two Gaussians. Background colour indicates the bins classified as narrow (green) and wide (yellow) units. Inset: Examples of motor cortical units with narrow (green) and wide (yellow) spike waveform widths. (b) The difference between BIC values minus the mean BIC values over the range as a function of the number of Gaussians used in the mixture model to fit the distributions of spike widths. (c) Example peri-stimulus time histograms from two narrow (green) and two wide (yellow) spiking neurons from monkey Mk. (d) Averaged population spike rates for the two classes of cells from monkey Mk, narrow class in green and wide class in yellow. The time-resolved beta oscillation amplitude is plotted as a solid black line. (e,f) Averaged spectrograms for the two classes of units from monkey Mk, narrow class (e, left) and wide class (f, left), and averaged power spectra for the each class of units, narrow class in green (e, right) and wide class in yellow (f, right) computed over [−100, 300] ms relative to the visual target onset. Black dashed line on the right subfigures denotes average LFP spectrum over all channels with the base line pink noise removed.
Figure 3
Figure 3. Spatiotemporal patterns of network connectivity of narrow class of neurons in MI in six 150 ms time windows incremented by 50 ms from monkey Rs data set.
(a) Networks of significant directed connections on the array at different time windows (in milliseconds) in relation to the onset of visual target appearance. Each horizontal colour bar indicates duration of a time window used to compute a network surrounded by the same colour. C, R, M and L indicate caudal, rostral, medial and lateral orientations, respectively, on the cortical surface. Red and blue arrows represent excitatory and inhibitory connections, respectively. The black dots represent the relative positions of the electrodes on the array where the neurons were detected. Neurons whose spikes rates are ⩾1 spike s−1 and with narrow spike widths (≤0.267 ms) were analysed. The green scale bar on the right-bottom equals 400 μm on the cortical surface. (b) Number of significant connections at different time windows for both excitatory and inhibitory connections (left), excitatory connections only (center) and inhibitory connections only (right). The lines in different colour shades correspond to different time windows of data in the recording session. (c) Circular distribution of directed excitatory connections weighted by their strength and normalized by the total number of possible connections in each orientation on the surface of MI at the different time windows (top). Circular distribution of directed inhibitory connections weighted by their strength and normalized by the total number of possible connections in each orientation on the surface of MI at the different time windows (bottom). All rose plots are oriented in the same way as in the anatomical coordinate system defined with C, caudal; R, rostral; M, medial and L, lateral in a. A dashed line in the top left rose plot connecting Cw (caudal wave direction) and Rw (rostral wave direction) defines the wave propagation axis as in Fig. 1d.
Figure 4
Figure 4. Same as Fig. 3, but for monkey Mk data set.
.
Figure 5
Figure 5. Consistency in spatial patterning of network connectivity across different subsets of data in time window 5 within the data set in monkey Rs.
Networks of significant connections (top), circular distributions of excitatory connections (middle) and circular distributions of inhibitory connections (bottom). (a) Results from all three subsets of data were pooled. (b) Results from each subset of data are illustrated in each column. All plots are oriented by the coordinate system defined by C, caudal; R, rostral; M, medial and L, lateral in a. A dashed line in each rose plot connecting Cw (caudal wave direction) and Rw (rostral wave direction) defines the wave propagation axis as in Fig. 1d.
Figure 6
Figure 6. Spatiotemporal patterns of network connectivity of narrow and wide classes of neurons in two time windows.
Data from monkeys Rs (top), Mk (middle) and Rj (bottom). (a) Networks of significant directed connections on the array at different time windows. Red and blue arrows represent excitatory and inhibitory connections, respectively. The black dots represent the relative positions of the electrodes on the array where the neurons were detected. If >1 neuron was detected on a given electrode, a given dot contains all units on that electrode. Neurons with firing rates ⩾1 spike s−1 and narrow spike widths (≤∼0.2667, ms) in MI were analysed. The green scale bar on the right-bottom equals 400 μm on the cortical surface. R, rostral; C, caudal; M, medial and L, lateral denote the anatomical orientation. (b) Circular distributions of directed excitatory (left) and inhibitory (right) connections weighted by their strength and normalized by the total number of possible connections. The circular distribution of excitatory connections for time window [−50, 100] ms in purple overlies that for time window [150, 300] ms in red. The circular distributions of inhibitory connections for the same windows are in teal and blue, respectively. The dashed black lines represent the beta wave axis. (c) Same as in a, but using neurons with firing rates ⩾1 spike s−1 and wide spike widths (⩾0.4000, ms).
Figure 7
Figure 7. Target-direction information content of spike sequencing between neurons with narrow spike waveforms.
Data from monkeys Rs (top), Mk (middle) and Rj (bottom). (a) Time-resolved, mutual information between spike sequencing and target direction (that is, the direction from the location of the acquired target to the new target). Information was calculated for only pairs of neurons with excitatory connections. The colour map consists of 18 rows corresponding to 18 orientations (20-degree bins) aligned to anatomical orientations denoted with M, medial; C, caudal; L, lateral and R, rostral, with information in bits in blue-red false colour. (b) Circular distributions of spike sequencing information with respect to the orientation of neuron pairs on the cortical surface. Spike sequencing information was summed over the time window in [100, 350] ms and over pairs within each orientation and then normalized. The dashed black lines represent the beta wave axis defined by Cw (caudal wave direction) and Rw (rostral wave direction) as in Fig. 1d. (c) Target-direction information content of sequencing firing of non-connected narrow-spiking neurons.

Similar articles

Cited by

References

    1. Prechtl J. C., Cohen L. B., Pesaran B., Mitra P. P. & Kleinfeld D. Visual stimuli induce waves of electrical activity in turtle cortex. Proc. Natl Acad. Sci. USA 94, 7621–7626 (1997). - PMC - PubMed
    1. Arieli A., Shoham D., Hildesheim R. & Grinvald A. Coherent spatiotemporal patterns of ongoing activity revealed by real-time optical imaging coupled with single-unit recording in the cat visual cortex. J Neurophysiol. 73, 2072–2093 (1995). - PubMed
    1. Roland P. E. et al.. Cortical feedback depolarization waves: A mechanism of top-down influence on early visual areas. Proc. Natl Acad. Sci. USA 103, 12586–12591 (2006). - PMC - PubMed
    1. Benucci A., Frazor R. A. & Carandini M. Standing waves and traveling waves distinguish two circuits in visual cortex. Neuron 55, 103–117 (2007). - PMC - PubMed
    1. Lippert M. T., Takagaki K., Xu W., Huang X. & Wu J.-Y. Methods for voltage-sensitive dye imaging of rat cortical activity with high signal-to-noise ratio. J. Neurophysiol. 98, 502–512 (2007). - PMC - PubMed

Publication types

LinkOut - more resources