. 2015 May;137(5):2737-57.
doi: 10.1121/1.4919350.

Changes in otoacoustic emissions during selective auditory and visual attention

Affiliations

Changes in otoacoustic emissions during selective auditory and visual attention

Kyle P Walsh et al. J Acoust Soc Am. 2015 May.

Abstract

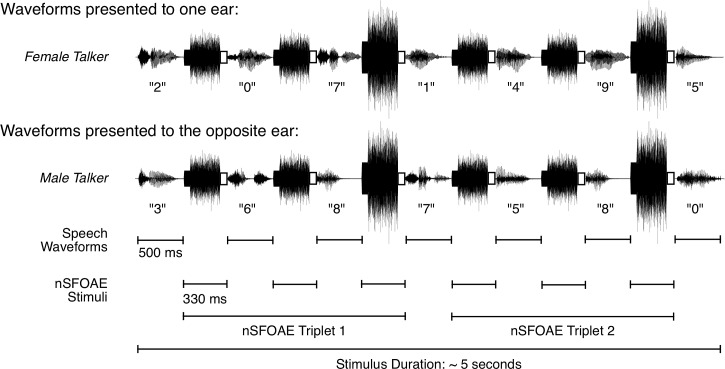
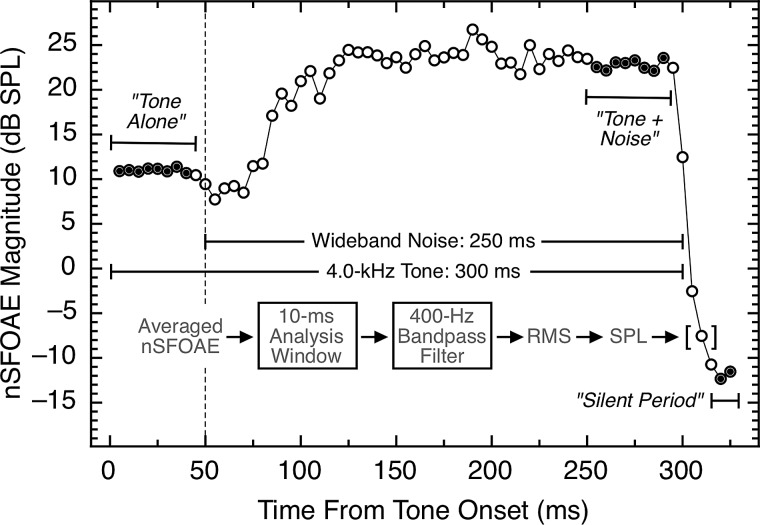
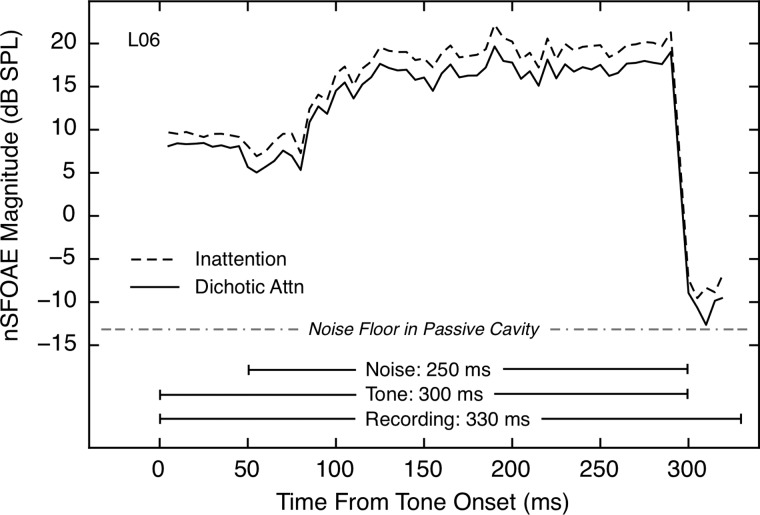
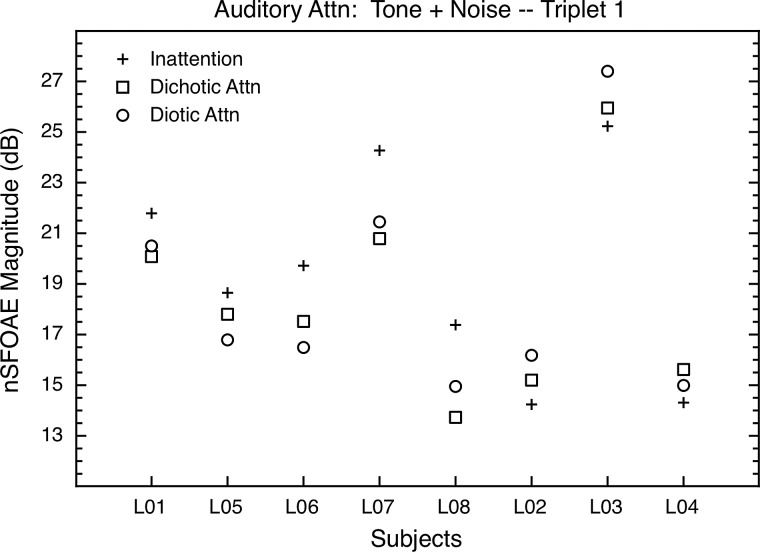
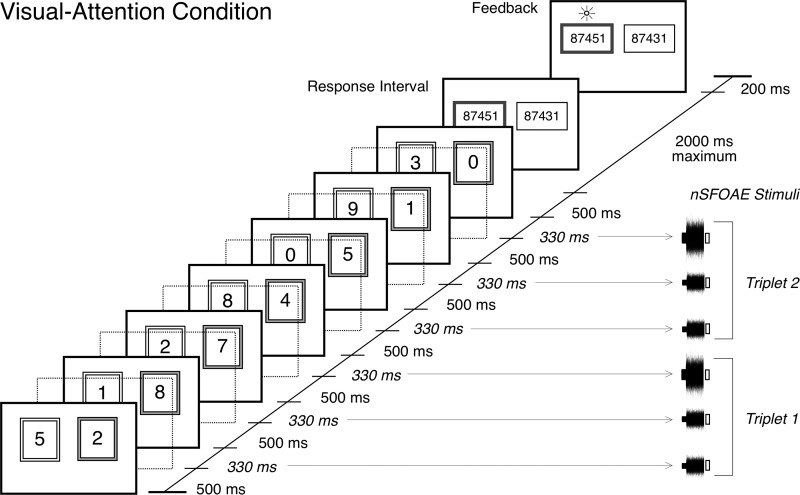
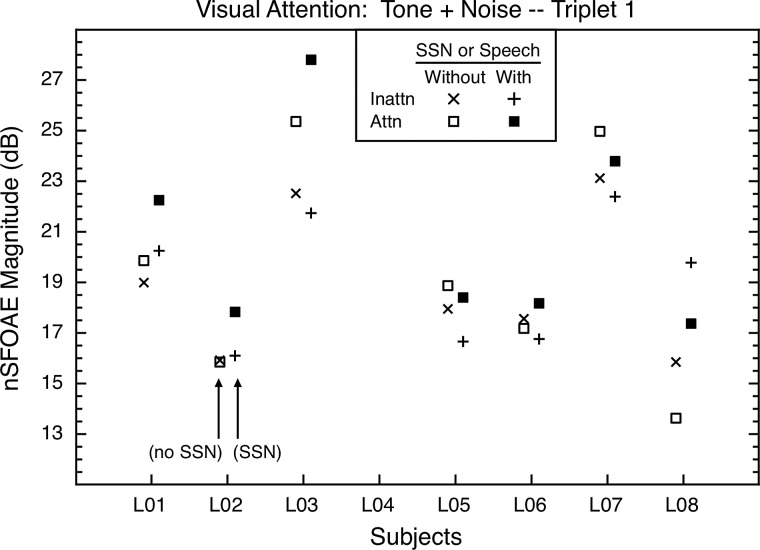
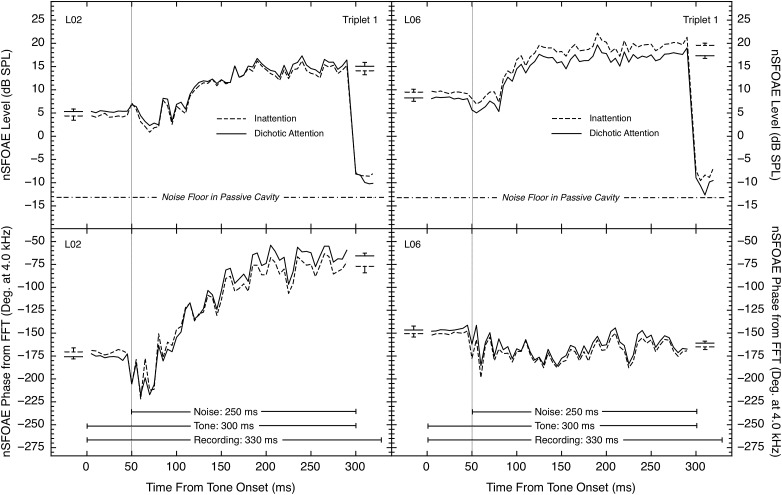
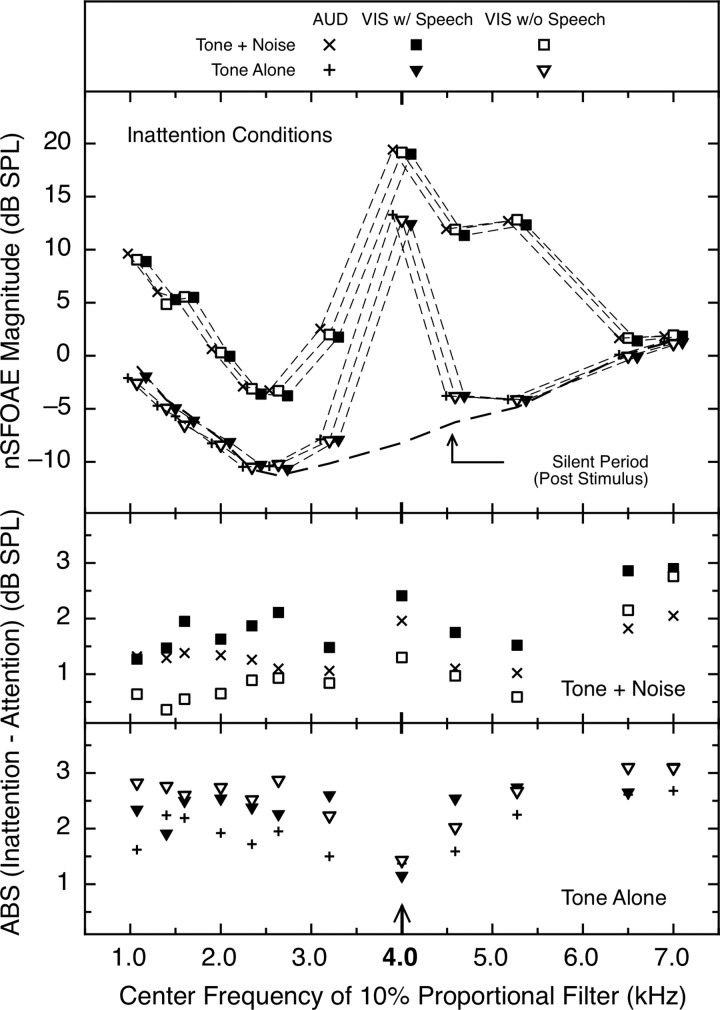
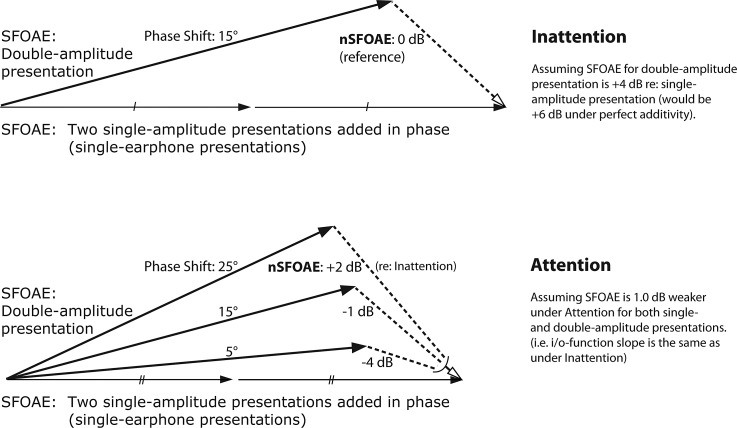
Previous studies have demonstrated that the otoacoustic emissions (OAEs) measured during behavioral tasks can have different magnitudes when subjects are attending selectively or not attending. The implication is that the cognitive and perceptual demands of a task can affect the first neural stage of auditory processing-the sensory receptors themselves. However, the directions of the reported attentional effects have been inconsistent, the magnitudes of the observed differences typically have been small, and comparisons across studies have been made difficult by significant procedural differences. In this study, a nonlinear version of the stimulus-frequency OAE (SFOAE), called the nSFOAE, was used to measure cochlear responses from human subjects while they simultaneously performed behavioral tasks requiring selective auditory attention (dichotic or diotic listening), selective visual attention, or relative inattention. Within subjects, the differences in nSFOAE magnitude between inattention and attention conditions were about 2-3 dB for both auditory and visual modalities, and the effect sizes for the differences typically were large for both nSFOAE magnitude and phase. These results reveal that the cochlear efferent reflex is differentially active during selective attention and inattention, for both auditory and visual tasks, although they do not reveal how attention is improved when efferent activity is greater.


Figures

FIG. 1.
FIG. 1.
Schematic showing how the speech sounds and the nSFOAE-eliciting stimuli were interleaved during one trial of the dichotic-listening condition in the auditory study. Each ear was presented with a series of seven spoken digits, one series spoken by a female talker, and the other series spoken simultaneously by a male talker. The ear receiving the female talker was selected randomly on each trial. Each digit was presented in a 500-ms temporal window. A 330-ms ISI separated consecutive digits, during which the nSFOAE-eliciting stimuli were presented. The latter always was composed of a 300-ms tone and a 250-ms frozen sample of wideband noise, and the onset of the tone always preceded the onset of the noise by the difference in their durations. A 30-ms silent period, shown here as an open rectangle, followed each nSFOAE-eliciting stimulus for the purpose of estimating the magnitude of the physiological noise in the nSFOAE recordings. The nSFOAE cancellation procedure was performed separately on each of the two triplets presented on each trial, yielding two estimates of the nSFOAE per trial. Although not shown here, a 2000-ms silent response interval and a 200-ms feedback interval completed each trial. During the response interval, the subject performed a two-alternative matching task based on the digits spoken by the female talker. For each block of trials, the physiological responses from the trials having a correct behavioral response were based on about 20 to 30 trials. [Reprinted with permission from Walsh et al. (2014a).]
FIG. 2.
FIG. 2.
An example of an nSFOAE response averaged from one block of trials of one condition. To summarize the data, tone-alone magnitudes were averaged from 5 to 40 ms, and tone-plus-noise magnitudes were averaged from 250 to 285 ms (thirty-five 10-ms epochs each; indicated by the filled circles). All nSFOAE responses, across all subjects and conditions, were analyzed in this same manner. The noise floor for these measurements was about −13.0 dB SPL. The data from the silent period already have been reported (Walsh et al., 2014a,b).
FIG. 3.
FIG. 3.
The nSFOAE responses for the full 330-ms measurement period for one subject for both the auditory inattention condition and the dichotic attention condition. The first 50 ms shows the response to tone-alone, the next 250 ms shows the response to tone-plus-noise, and the final 30 ms shows the response after the stimuli terminated. The dichotic response represents the mean of the nSFOAE averages obtained when the attended voice was either in the ear ipsilateral to the microphone or in the contralateral ear. The fine structure of the response during tone-plus-noise is not random fluctuation, but rather, it is attributable to the specific sample of noise used. Each response included only trials having correct behavioral responses and was averaged across at least four 30-trial blocks.
FIG. 4.
FIG. 4.
Auditory-attention study: The asymptotic nSFOAE responses to tone-plus-noise for triplet 1 for all subjects in the auditory study. The values shown began as means across thirty-five 10-ms analysis windows beginning at 250 ms into the 300-ms nSFOAE-eliciting stimulus within one block of trials (i.e., at response asymptote); those individual means then were averaged across at least four such blocks. The differences between inattention and attention were in one direction for the five subjects at the left of the figure, and in the other direction for the remaining three subjects. Standard errors of the mean were 0.73 dB, on average. The level of the noise floor of our measurement system at 4.0 kHz was about −13.0 dB SPL (see footnote 2).
FIG. 5.
FIG. 5.
Trial-timing sequence for the visual-attention study. Sequences of seven pairs of digits were presented simultaneously for 500 ms each, one sequence inside a pink box (gray in the figure) and one inside an adjacent blue box. Interleaved with the seven pairs of visual digits were six diotic presentations of the nSFOAE-eliciting stimuli, each being 330 ms in duration. Following the last pair of visual digits was a response interval of 2000 ms, during which the subject pressed one of two response keys to indicate which of two sequences of five digits contained the middle five digits of the digit sequence in the pink box. Immediately following was a feedback interval of 200 ms, during which a small symbol was displayed over the correct five-digit choice. In the inattention conditions, the subject pressed a response key immediately after the last nSFOAE stimulus was presented (no digits were displayed). In some conditions, dichotic speech or SSNs were presented simultaneously with the visual digits. [Reprinted with permission from Walsh et al. (2014b).]
FIG. 6.
FIG. 6.
Visual-attention study: The asymptotic nSFOAE responses to tone-plus-noise for triplet 1 for all subjects in the second study. One set of inattention and attention conditions (With) included spoken digits during the attention blocks and SSNs during the inattention blocks; another set included no speech nor SSN stimuli (Without). The values shown began as means across thirty-five 10-ms analysis windows beginning at 250 ms into the 300-ms nSFOAE-eliciting stimulus within one block of trials; those individual means then were averaged across at least four such blocks. As in the auditory-attention study, the differences between inattention and attention were in different directions for the different subjects. Within subjects, standard errors of the mean were about 0.78 dB, on average.
FIG. 7.
FIG. 7.
Comparison of (top) level and (bottom) phase of the nSFOAE response at 4.0 kHz for triplet 1 for two subjects from the auditory-attention study. The timing lines in the bottom panels mark the tone-alone and tone-plus-noise portions of the response. Level measurements were obtained for each successive 10-ms analysis window using a filter centered at 4.0 kHz and having a bandwidth equal to 10% of its center frequency; the phase values were obtained by performing FFTs on each 10-ms analysis window. At the left and right within each panel, plus or minus one standard error is shown for the estimates of the asymptotic tone-alone and the asymptotic tone-plus-noise responses, respectively; standard errors were calculated across the multiple blocks that were averaged.
FIG. 8.
FIG. 8.
Attentional effects across the spectrum. (top) Average magnitude of the asymptotic nSFOAE response for the inattention conditions in the auditory- and visual-attention studies. Data are shown for the tone-alone, tone-plus-noise, and silent periods of the eliciting stimuli. The nSFOAE-eliciting stimulus was a moderate 4.0-kHz tone and a weak wideband noise. The values shown were obtained by varying the center frequency of the analysis filter and repeating the moving-window analysis. All values have been corrected for the rise times of those different filters (see Walsh et al., 2014a,b), and for clarity, entries have been slightly displaced laterally. The noise floor of the measurement system lay several decibels below the values from the silent period. (Middle) and (bottom) Across-subject means of the absolute values (ABS) of the differences between the inattention and attention conditions for the tone-plus-noise and tone-alone portions of the nSFOAE responses, respectively. For the auditory-attention study, the average standard error of the differences of the means (Inattention – Attention) across subjects and frequencies was 0.33 dB; for the visual-attention study, it was 0.37. For the auditory-attention conditions there were eight subjects; for the two visual-attention conditions only seven of those subjects completed the study.
FIG. 9.
FIG. 9.
Phasor diagrams for an Inattention and Attention condition. (Top) Inattention condition: When the response to the two-earphone presentations is subtracted from the sum of the two single-earphone responses, an nSFOAE is left as a resultant (dashed line). Call that the reference (0 dB) for comparison with the attention condition. (Bottom) Attention condition: Assume that efferent activity always is stronger during attention than inattention, so that the strength of all responses is slightly weaker than in the top panel. Also assume that the phase angle (time delay) between the response to the two-earphone presentations and the sum of the responses to the two single-earphone presentations can be different in different subjects. When that phase angle is 5°, the nSFOAE (the dashed lines) during attention is 4 dB weaker compared to inattention; when that phase angle is 15°, the nSFOAE during attention is 1 dB weaker compared to inattention; when that phase angle is 25°, the nSFOAE during attention is 2 dB stronger compared to inattention. Thus, even though efferent activity itself always is stronger during attention than inattention, the sign of the difference between attention and inattention can be positive or negative depending upon the time delays in individual cochleas.

Similar articles

Cited by

References

    1. Backus, B. C. , and Guinan, J. J., Jr. (2006). “ Time-course of the human medial olivocochlear reflex,” J. Acoust. Soc. Am. 119, 2889–2904.10.1121/1.2169918 - DOI - PubMed
    1. Brown, M. C. (2011). “ Anatomy of olivocochlear neurons,” in Auditory and Vestibular Efferents, edited by Ryugo D. K., Fay R. R., and Popper A. N. ( Springer, New York: ), pp. 17–37.
    1. Brown, M. C. , Nuttall, A. L. , and Masta, R. I. (1983). “ Intracellular recordings from cochlear inner hair cells: Effects of stimulation of the crossed olivocochlear efferents,” Science 222, 69–72.10.1126/science.6623058 - DOI - PubMed
    1. Burns, E. M. , Harrison, W. A. , Bulen, J. C. , and Keefe, D. H. (1993). “ Voluntary contraction of middle ear muscles: Effects on input impedance, energy reflectance and spontaneous otoacoustic emissions,” Hear. Res. 67, 117–128.10.1016/0378-5955(93)90239-W - DOI - PubMed
    1. Church, G. T. , and Cudahy, E. A. (1984). “ The time course of the acoustic reflex,” Ear Hear. 5, 235–242.10.1097/00003446-198407000-00008 - DOI - PubMed

Publication types

MeSH terms