. 2015 May 22;16(1):169.
doi: 10.1186/s12859-015-0611-3.

InteractiVenn: a web-based tool for the analysis of sets through Venn diagrams

Affiliations

InteractiVenn: a web-based tool for the analysis of sets through Venn diagrams

Henry Heberle et al. BMC Bioinformatics. .

Abstract

Background: Set comparisons permeate a large number of data analysis workflows, in particular workflows in biological sciences. Venn diagrams are frequently employed for such analysis but current tools are limited.

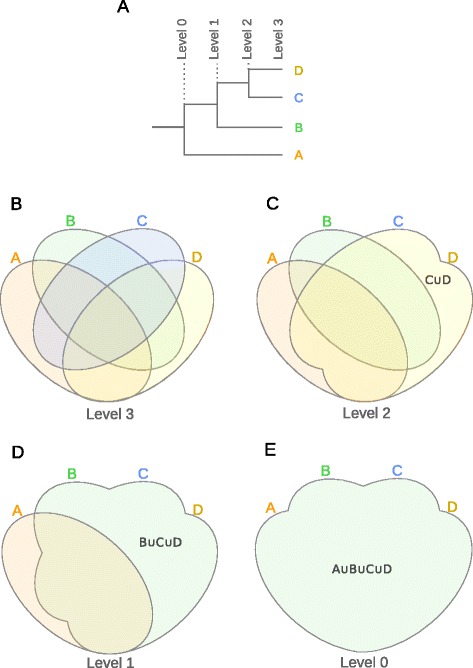
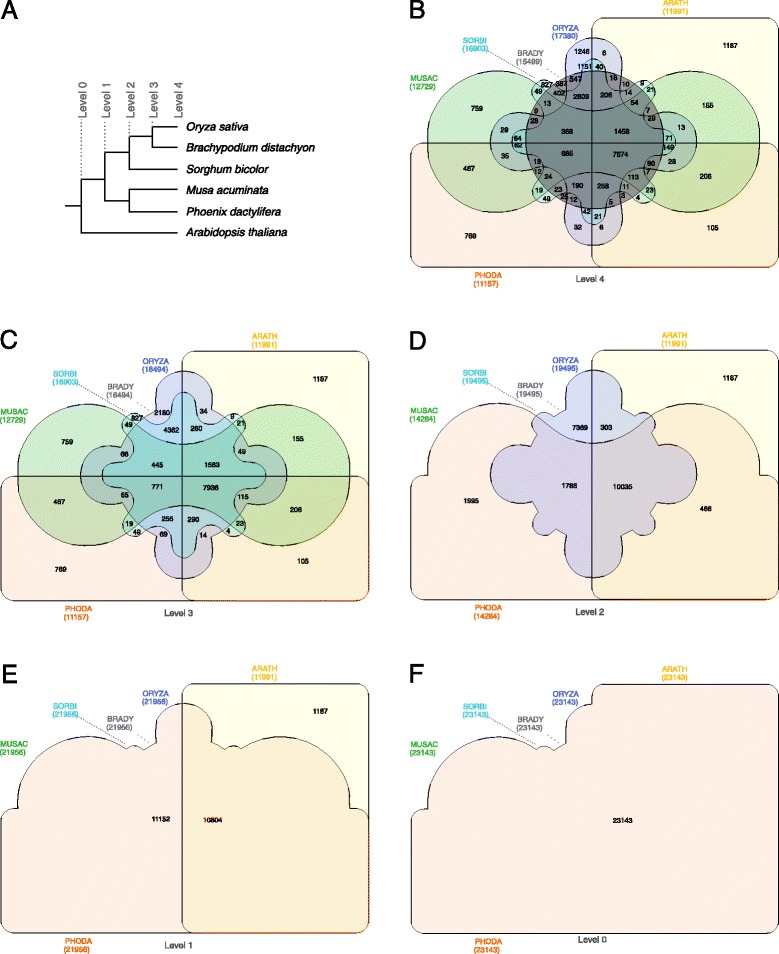
Results: We have developed InteractiVenn, a more flexible tool for interacting with Venn diagrams including up to six sets. It offers a clean interface for Venn diagram construction and enables analysis of set unions while preserving the shape of the diagram. Set unions are useful to reveal differences and similarities among sets and may be guided in our tool by a tree or by a list of set unions. The tool also allows obtaining subsets' elements, saving and loading sets for further analyses, and exporting the diagram in vector and image formats. InteractiVenn has been used to analyze two biological datasets, but it may serve set analysis in a broad range of domains.

Conclusions: InteractiVenn allows set unions in Venn diagrams to be explored thoroughly, by consequence extending the ability to analyze combinations of sets with additional observations, yielded by novel interactions between joined sets. InteractiVenn is freely available online at: www.interactivenn.net .


Figures

Figure 1
Figure 1
InteractiVenn Interface. InteractiVenn interface’s main parts are indicated by lettering as follows: (A) unions sequence; (B) the button that starts the sequence of set unions defined in (A); (C) the selector of the number of sets of the diagram; (D) fields to be filled with the elements of each set, one element (string) per line; (E) controls to download the current sets as a text file; (F) controls to upload sets previously saved; (G) controls to export the current diagram with extension in SVG format and (H) controls to increase and decrease font size and color opacity, to reset the diagram’s colors and font and to display the tree that will guide unions.
Figure 2
Figure 2
Venn diagram construction by a sequence of union operations. (A) binary tree; (B) Venn diagram for level 3; (C) Venn diagram for level 2; (D) Venn diagram for level 1; (E) Venn diagram for level 0.
Figure 3
Figure 3
Comparison of ranked lists of candidate biomarkers by five feature selection methods. (A) 38 proteins are shared by all methods, whereas the semi and multivariate methods show more exclusive proteins than the univariate ones; (B) 144 proteins are exclusively shared by the semi and multivariate methods; (C) KLK3 was retrieved as an exclusive protein by only the MWW test.
Figure 4
Figure 4
Venn diagram showing the distribution of shared gene families (sequence clusters) among six plant proteomes. The Venn diagram was constructed by a sequence of union operations following the hierarchy of a binary tree based on the work by D’Hont et al. [2]. (A) binary tree; (B) Venn diagram for level 4; (C) Venn diagram for level 3; (D) Venn diagram for level 2; (E) Venn diagram for level 1; (F) Venn diagram for level 0. ORYZA: Oryza sativa; BRADY: Brachypodium distachyon; SORBI: Sorghum bicolor; MUSAC: Musa acuminata; PHODA: Phoenix dactylifera; ARATH: Arabidopsis thaliana.

References

    1. Ruskey F, Weston M. A survey of Venn diagrams. Electron J Comb. 1997; 4.
    1. D’Hont A, Denoeud F, Aury JM, et al. The banana (musa acuminata) genome and the evolution of monocotyledonous plants. Nature. 2012;7410:213–7. doi: 10.1038/nature11241. - DOI - PubMed
    1. Hulsen T, de Vlieg J, Alkema W. Biovenn - a web application for the comparison and visualization of biological lists using area-proportional Venn diagrams. BMC Genomics. 2008;9:488. doi: 10.1186/1471-2164-9-488. - DOI - PMC - PubMed
    1. Pirooznia M, Nagarajan V, Deng Y. GeneVenn - a web application for comparing gene lists using Venn diagrams. Bioinformation. 2007;1(10):420–2. doi: 10.6026/97320630001420. - DOI - PMC - PubMed
    1. Kestler HA, Muller A, Gress TM, Buchholz M. Generalized Venn diagrams: a new method of visualizing complex genetic set relations. Bioinformatics. 2005;21(5):1592–5. doi: 10.1093/bioinformatics/bti169. - DOI - PubMed

Publication types