. 2015 Nov;35(8):1187-202.
doi: 10.1007/s10571-015-0212-8. Epub 2015 May 21.

Quantitative Analysis of Glutamate Receptors in Glial Cells from the Cortex of GFAP/EGFP Mice Following Ischemic Injury: Focus on NMDA Receptors

Affiliations

Quantitative Analysis of Glutamate Receptors in Glial Cells from the Cortex of GFAP/EGFP Mice Following Ischemic Injury: Focus on NMDA Receptors

David Dzamba et al. Cell Mol Neurobiol. 2015 Nov.

Abstract

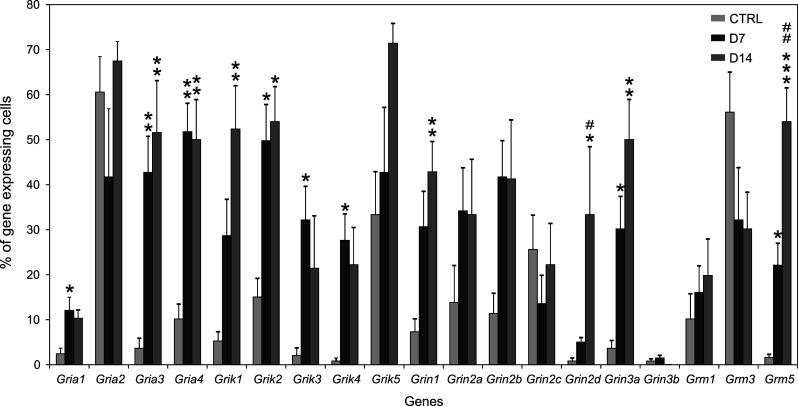
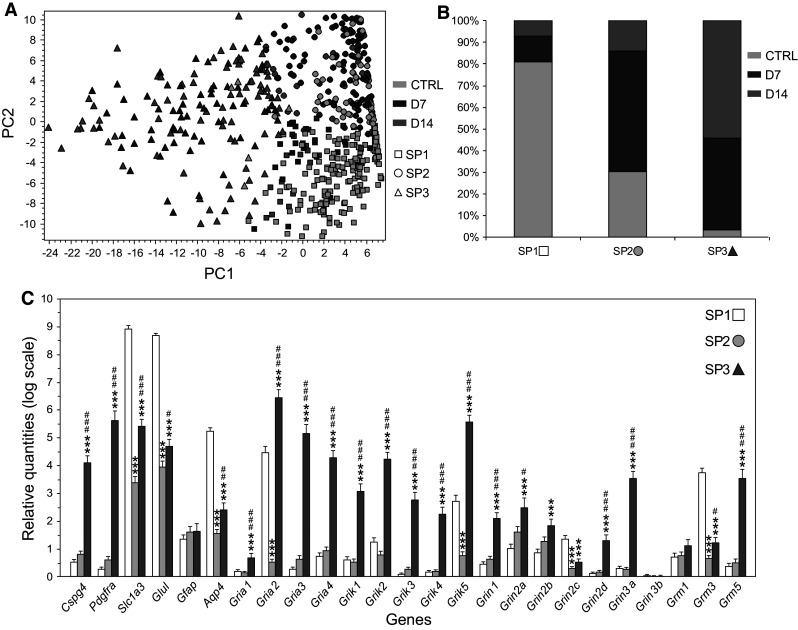
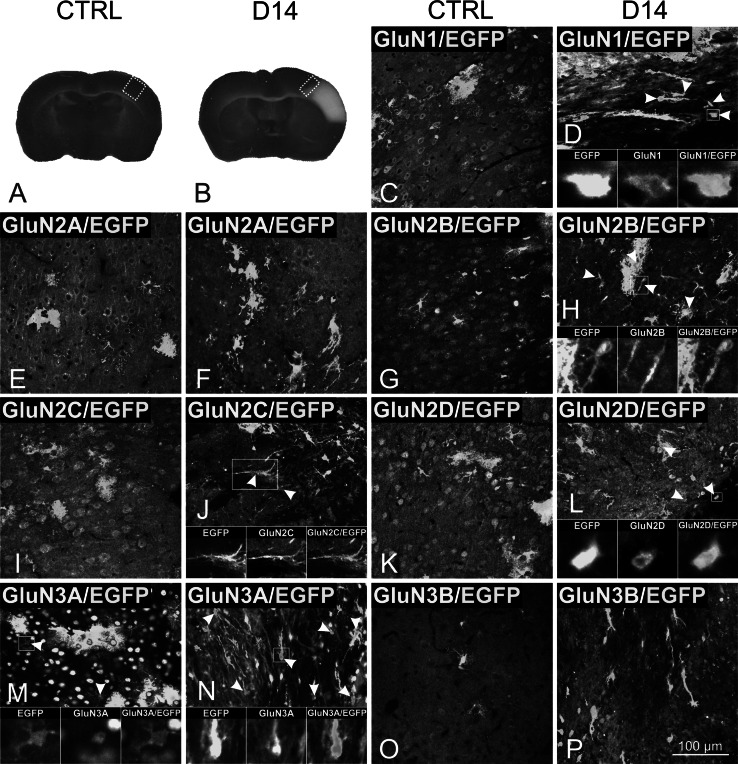
Cortical glial cells contain both ionotropic and metabotropic glutamate receptors. Despite several efforts, a comprehensive analysis of the entire family of glutamate receptors and their subunits present in glial cells is still missing. Here, we provide an overall picture of the gene expression of ionotropic (AMPA, kainate, NMDA) and the main metabotropic glutamate receptors in cortical glial cells isolated from GFAP/EGFP mice before and after focal cerebral ischemia. Employing single-cell RT-qPCR, we detected the expression of genes encoding subunits of glutamate receptors in GFAP/EGFP-positive (GFAP/EGFP(+)) glial cells in the cortex of young adult mice. Most of the analyzed cells expressed mRNA for glutamate receptor subunits, the expression of which, in most cases, even increased after ischemic injury. Data analyses disclosed several classes of GFAP/EGFP(+) glial cells with respect to glutamate receptors and revealed in what manner their expression correlates with the expression of glial markers prior to and after ischemia. Furthermore, we also examined the protein expression and functional significance of NMDA receptors in glial cells. Immunohistochemical analyses of all seven NMDA receptor subunits provided direct evidence that the GluN3A subunit is present in GFAP/EGFP(+) glial cells and that its expression is increased after ischemia. In situ and in vitro Ca(2+) imaging revealed that Ca(2+) elevations evoked by the application of NMDA were diminished in GFAP/EGFP(+) glial cells following ischemia. Our results provide a comprehensive description of glutamate receptors in cortical GFAP/EGFP(+) glial cells and may serve as a basis for further research on glial cell physiology and pathophysiology.

Keywords: Astrocytes; Calcium imaging; MCAo; NG2 glia; Single-cell RT-qPCR.


Conflict of interest statement

The authors declare that they have no conflict of interest.

Figures

Fig. 1
Fig. 1
The percentage of cells expressing genes coding individual subunits of glutamate receptors in control mice and in mice after MCAo. Cells isolated from control mice (CTRL, 5 mice, 246 cells) and from mice 7 and 14 days after MCAo (D7, 4 mice, 196 cells and D14, 3 mice, 125 cells) were used. Genes coding AMPA receptors (Gria1-4), kainate receptors (Grik15), NMDA receptors (Grin1-3b), and metabotropic glutamate receptors (Grm1,3,5) were studied. Error bars represent SEM. Significant differences between D7/D14 compared to CTRL (*p < 0.05, **p < 0.01, ***p < 0.001) and D14 compared to D7 (# p < 0.05, ## p < 0.01) were calculated by one-way ANOVA followed by the Bonferroni post-test
Fig. 2
Fig. 2
Gene expression profiling of distinct subpopulations of GFAP/EGFP+ cells isolated from the cortex of GFAP/EGFP mice. a Principal component analysis (PCA) of cells from control mice (CTRL, 246 cells/5 mice) and those 7 and 14 days after MCAo (D7, 199 cells/4 mice; D14, 126 cells/3 mice). The data were mean-centered according to the genes. The cells were divided into three groups by Kohonen self-organizing maps (SOM) and are marked by different symbols (squares for subpopulation SP1, circles for subpopulation SP2, and triangles for subpopulation SP3). b Percentage representation of CTRL, D7, and D14 cells in the subpopulations SP1–3. c Bar plot with SEM showing the relative expression of the analyzed genes in subpopulations SP1–3. Significant differences between SP2/SP3 compared to SP1 (***p < 0.001) and SP3 compared to SP2 (# p < 0.05, ## p < 0.01, ### p < 0.001) were calculated by one-way ANOVA followed by the Bonferroni post-test
Fig. 3
Fig. 3
Spearman correlation coefficients between genes coding glutamate receptor subunits and markers of NG2 glia/astrocytes in control cells (CTRL) and in cells 7 and 14 days after MCAo (D7, D14). The correlation coefficients were calculated from all cells including those without any expression of the studied genes. Positive correlations are highlighted in green, negative in red. All the values of the correlation coefficients are significant with p < 0.05. Correlation coefficients with p < 0.001 are in bold (Complete list of Spearman correlation coefficients is provided in Online Resource 1)
Fig. 4
Fig. 4
Immunohistochemical analysis of the GluN1, GluN2A-D, and GluN3A-B subunits of the NMDA receptors in the cortex of adult GFAP/EGFP mice under control conditions (CTRL) and 14 days after MCAo (D14). Coronal brain sections from CTRL (a) and D14 (b) animals stained with triphenyl tetrazolium chloride. The white color in b indicates the volume of ischemic tissue at D14. The boxed areas indicate the regions in which the immunohistochemical analysis was performed. The arrowheads in cp indicate the overlay of GFAP/EGFP+ cells and NMDA subunit staining—see figure insets for detailed images of cells in white rectangles. Note the overlap of the EGFP signal with GluN3A staining in CTRL tissue and GluN1, GluN2B-D, and GluN3A staining at D14. The same scale bar applies to all non-inset images
Fig. 5
Fig. 5
Calcium imaging measurements of cortical GFAP/EGFP+ glial cells from GFAP/EGFP mice in situ. a Kinetics of the responses to the application of 100 µM NMDA (top). Quantification of the delay of the response onset shows that the average delay was ~30 s (bottom) (n = 94). b The concentration dependence of control cells responding to the application of NMDA (4, 20, and 100 µM, left) with quantification of the responses (right). c A histogram of the distribution of Ca2+ responses evoked by the application of 100 µM NMDA. Only cells with responses having an area under the curve higher than ten were analyzed (n = 232). d The co-application of 1 µM TTX did not reveal any significant change in the Ca2+ responses evoked by 100 µM NMDA. e The selective NMDA receptor blocker DL-APV markedly blocked the Ca2+ elevations evoked by the application of 100 µM NMDA. f The co-application of memantine decreased the NMDA-evoked Ca2+ elevation, which indicates the presence of GluN2C–D subunits in the NMDA receptors. g A comparison of the Ca2+ responses to the application of 100 µM glycine, 100 µM NMDA, and 100 µM glutamate in control cells (CTRL) and in cells 13–14 days after MCAo (D13–14). Error bars represent SEM. Significant differences (*p < 0.05, **p < 0.01, and ***p < 0.001) were calculated by one-way ANOVA followed by the Bonferroni post-test (b), a paired t test (df), and an unpaired t test (g); n indicates the number of cells
Fig. 6
Fig. 6
Calcium imaging measurements of cortical GFAP/EGFP+ glial cells from GFAP/EGFP mice in vitro. a Kinetics of the responses to the application of 500 µM NMDA + 100 µM glycine. b A comparison of the Ca2+ responses to the application of 500 µM NMDA + 100 µM glycine in cells isolated from control mice (CTRL) and those isolated from mice 13–14 days after MCAo (D13–14). Error bars represent SEM. Asterisk indicates a significant difference (p < 0.05) calculated by an unpaired t test; n indicates the number of cells. c Imaging of the Ca2+ elevation induced by the application of 500 µM NMDA + 100 µM glycine with a focus on the cell processes. Traces in different colors (bottom) correspond to the imaged regions in the image of the GFAP/EGFP+ glial cell (top). Note that Ca2+ elevations were not detected in all of the processes

References

    1. Aronica E, van Vliet EA, Mayboroda OA et al (2000) Upregulation of metabotropic glutamate receptor subtype mGluR3 and mGluR5 in reactive astrocytes in a rat model of mesial temporal lobe epilepsy. Eur J Neurosci 12:2333–2344 - PubMed
    1. Aronica E, Leenstra S, Jansen GH et al (2001) Expression of brain-derived neurotrophic factor and tyrosine kinase B receptor proteins in glioneuronal tumors from patients with intractable epilepsy: colocalization with N-methyl-D-aspartic acid receptor. Acta Neuropathol 101:383–392 - PubMed
    1. Aronica E, Gorter JA, Ijlst-Keizers H et al (2003) Expression and functional role of mGluR3 and mGluR5 in human astrocytes and glioma cells: opposite regulation of glutamate transporter proteins. Eur J Neurosci 17:2106–2118. doi:10.1046/j.1460-9568.2003.02657.x - PubMed
    1. Atlason PT, Garside ML, Meddows E et al (2007) N-Methyl-D-aspartate (NMDA) receptor subunit NR1 forms the substrate for oligomeric assembly of the NMDA receptor. J Biol Chem 282:25299–25307. doi:10.1074/jbc.M702778200 - PubMed
    1. Benesova J, Rusnakova V, Honsa P et al (2012) Distinct expression/function of potassium and chloride channels contributes to the diverse volume regulation in cortical astrocytes of GFAP/EGFP mice. PLoS One 7:e29725. doi:10.1371/journal.pone.0029725 - PMC - PubMed

Publication types

MeSH terms

Substances

LinkOut - more resources