. 2015 May 15;29(10):1045-57.
doi: 10.1101/gad.255737.114.

Position-specific binding of FUS to nascent RNA regulates mRNA length

Affiliations

Position-specific binding of FUS to nascent RNA regulates mRNA length

Akio Masuda et al. Genes Dev. .

Abstract

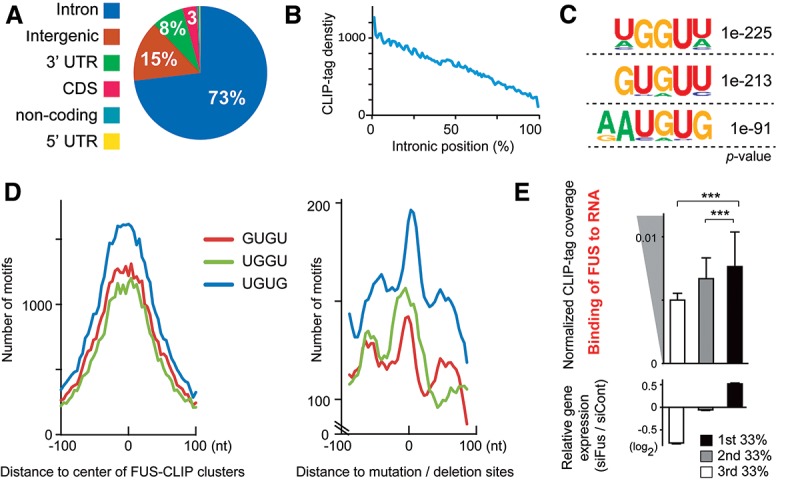
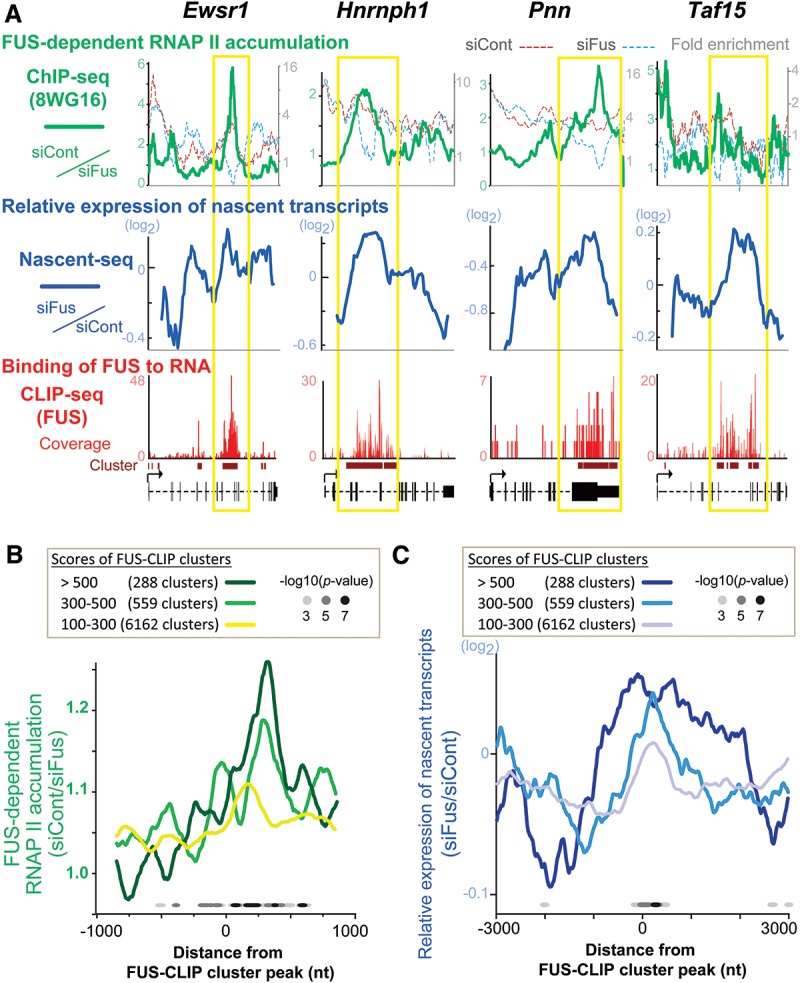
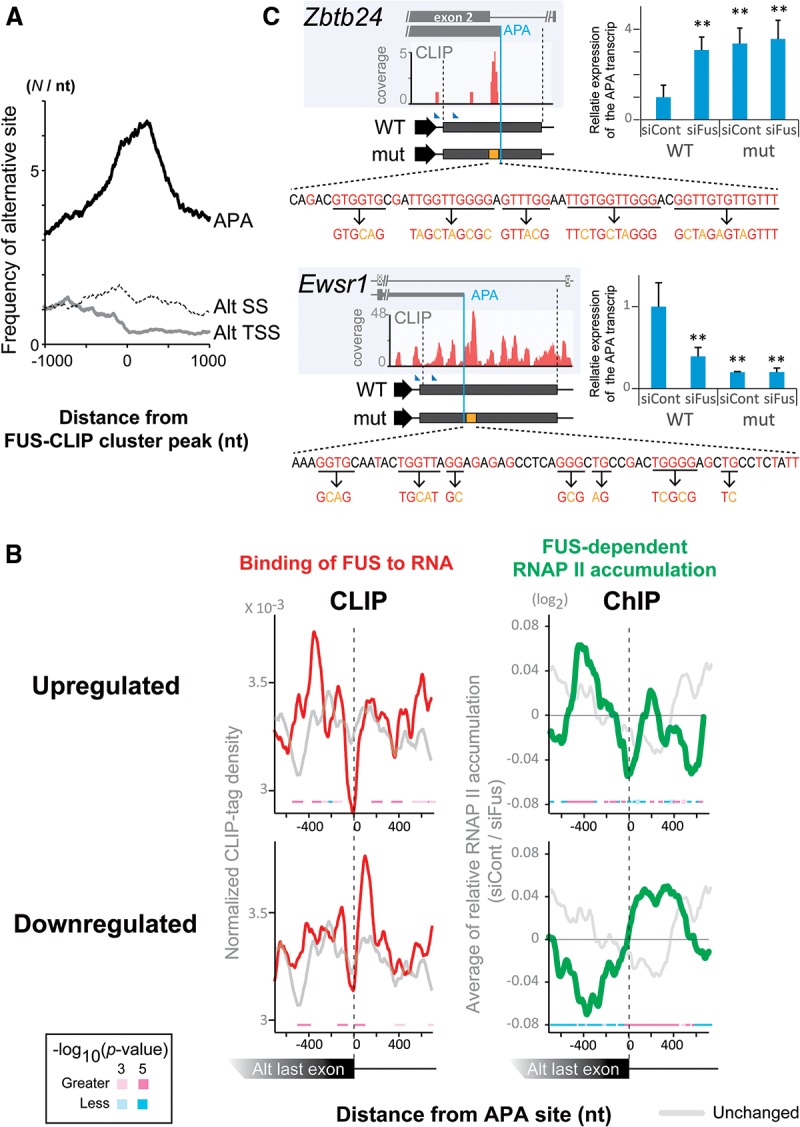
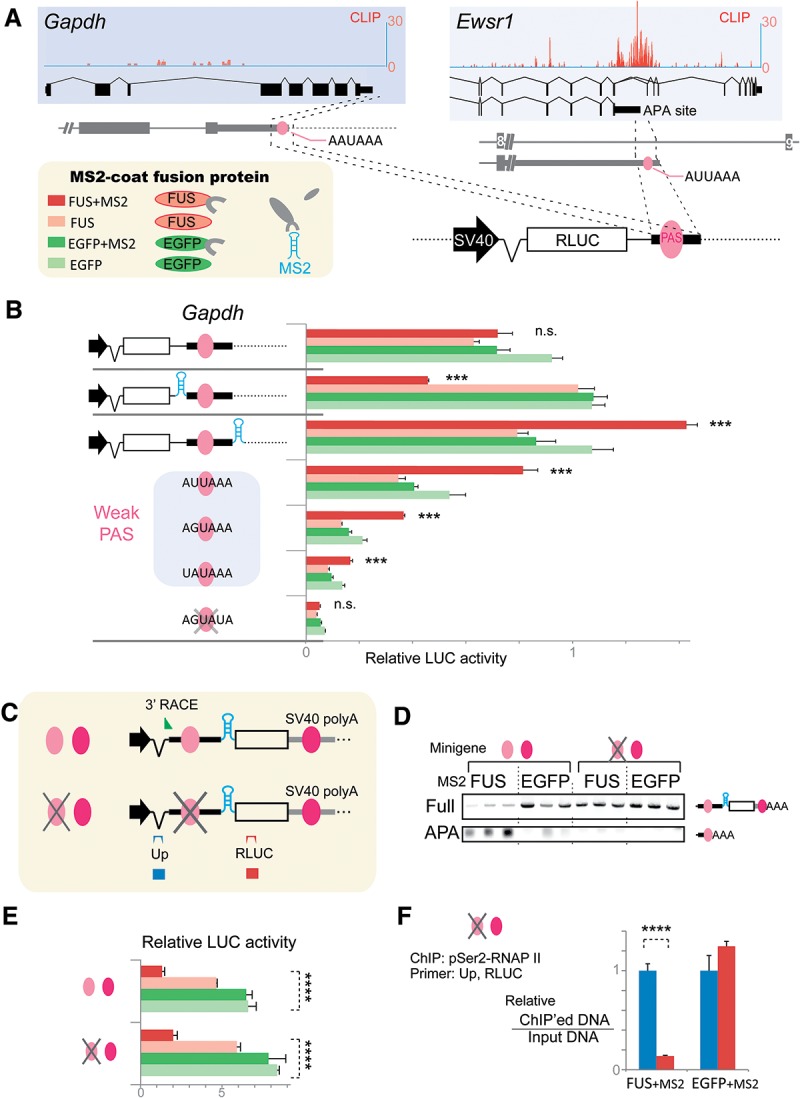
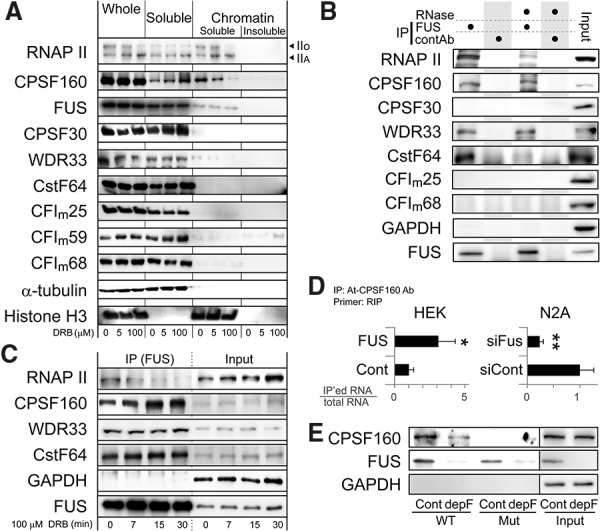
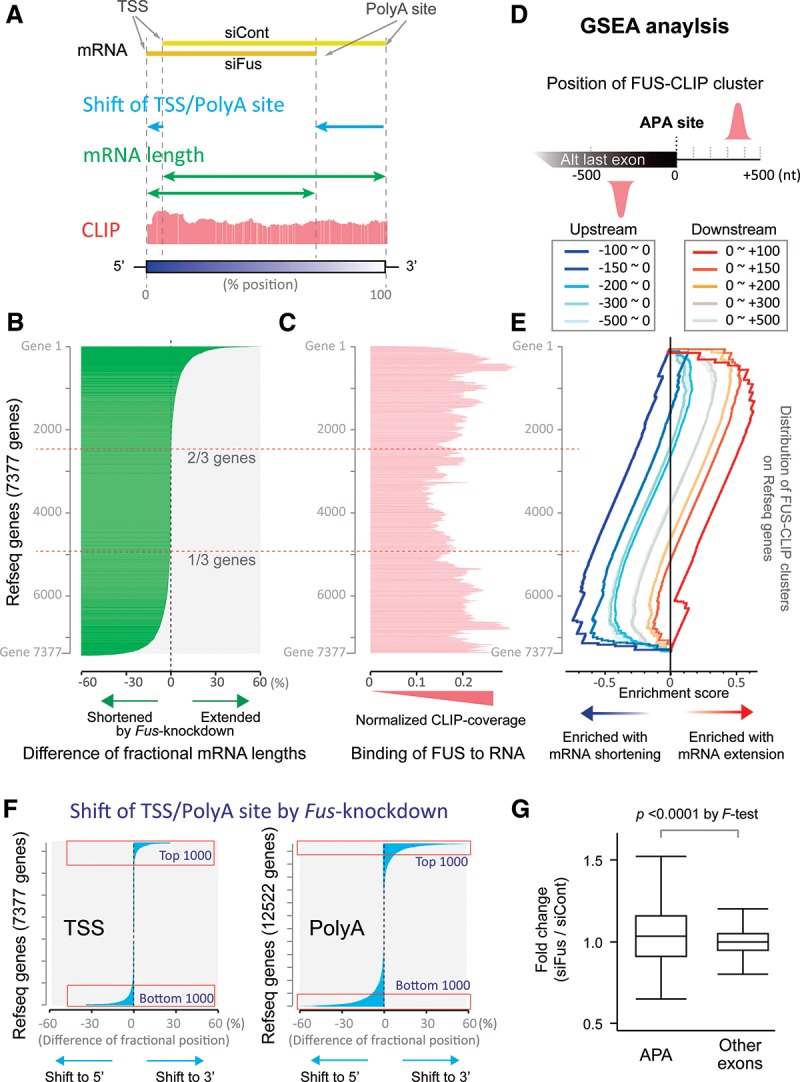
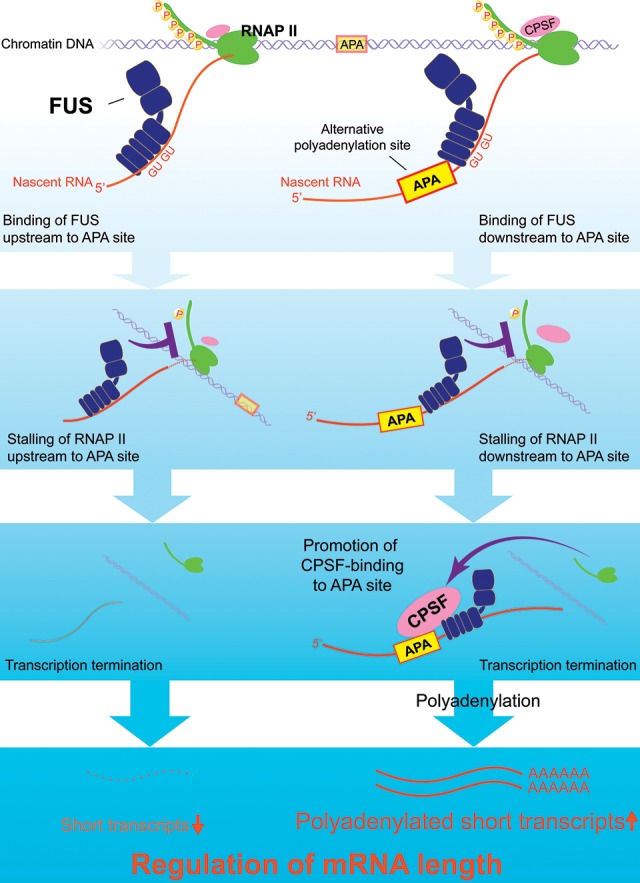
More than half of all human genes produce prematurely terminated polyadenylated short mRNAs. However, the underlying mechanisms remain largely elusive. CLIP-seq (cross-linking immunoprecipitation [CLIP] combined with deep sequencing) of FUS (fused in sarcoma) in neuronal cells showed that FUS is frequently clustered around an alternative polyadenylation (APA) site of nascent RNA. ChIP-seq (chromatin immunoprecipitation [ChIP] combined with deep sequencing) of RNA polymerase II (RNAP II) demonstrated that FUS stalls RNAP II and prematurely terminates transcription. When an APA site is located upstream of an FUS cluster, FUS enhances polyadenylation by recruiting CPSF160 and up-regulates the alternative short transcript. In contrast, when an APA site is located downstream from an FUS cluster, polyadenylation is not activated, and the RNAP II-suppressing effect of FUS leads to down-regulation of the alternative short transcript. CAGE-seq (cap analysis of gene expression [CAGE] combined with deep sequencing) and PolyA-seq (a strand-specific and quantitative method for high-throughput sequencing of 3' ends of polyadenylated transcripts) revealed that position-specific regulation of mRNA lengths by FUS is operational in two-thirds of transcripts in neuronal cells, with enrichment in genes involved in synaptic activities.

Keywords: CLIP; FUS; RNA polymerase II; alternative polyadenylation; mRNA length.


Figures

Figure 1.
Figure 1.
Positional analysis of FUS CLIP tags. (A) Pie chart showing the distribution of FUS CLIP clusters. (B) Positional FUS CLIP tag density on 648 introns >100 kb. (C) The three most enriched motifs generated by HOMER (Heinz et al. 2010) for the FUS CLIP clusters. The likelihood of finding the indicated motif by chance is indicated as a P-value. (D) Total number of the three GU motifs within a 200-nucleotide (nt) window. Position 0 is the center of the FUS CLIP clusters (left panel) or the mutated/deleted sites of FUS CLIP reads (right panel), which is a putative cross-link site of FUS in the CLIP experiment. (E) FUS–RNA interaction on FUS CLIP-seq correlates with up-regulated gene expression in response to Fus knockdown. FUS CLIP coverage is normalized by the expression level of each transcript by RNA sequencing (RNA-seq) of wild-type N2A cells. (Bottom panel) According to wild-type RNA-seq, 3750 genes are expressed with fragments per kilobase per million mapped fragments (FPKM) > 10 in N2A cells. The 3750 genes are evenly divided into three categories according to the changes in their relative expression levels by Fus knockdown (n = 1250 in each group). (Top panel) The mean and SE of normalized FUS CLIP tag coverages are indicated for the three categories. (***) P < 0.001 by Kruskal-Wallis test and Steel-Dwass post-hoc test.
Figure 2.
Figure 2.
FUS facilitates local accumulation of RNAP II and suppresses nascent transcripts. (A) Distribution of FUS CLIP tags, RNAP II ChIP tags, and Nascent-seq tags on four representative genes, with prominent enrichment of CLIP tags in the middle of the gene. Fold enrichment of ChIP tags compared with input tags in N2A cells that were treated with siCont (red dotted line) and siFus (blue dotted line) is plotted on the right ordinate. Relative enrichment of ChIP tags (green solid line), representing FUS-dependent accumulation of RNAP II, was calculated by dividing ChIP tags of siCont by those of siFus and is plotted on the left ordinate. Relative expression of nascent transcripts (blue solid line) was calculated by dividing Nascent-seq tags of siFus by those of siCont. Yellow boxes indicate the regions where FUS CLIP tags and FUS-dependent RNAP II are enriched. (B) Combined analysis of CLIP-seq and ChIP-seq. FUS CLIP clusters were classified into three categories depending on the number of tags within a cluster. FUS-dependent RNAP II accumulation is calculated as in A. A total of 7009 transcripts have FUS CLIP clusters with MACS score >100 in N2A cells. RNAP II ChIP tags in siCont- and siFus-treated N2A cells are calculated for individual nucleotides in the indicated segment. The statistical differences of RNAP II ChIP tags between siCont and siFus were estimated by a Wilcoxon test and are indicated by dots. (C) Combined analysis of CLIP-seq and Nascent-seq. FUS CLIP clusters were classified as in B. Relative expression of nascent transcripts was calculated as in A. Note that the ordinate shows siFus/siCont in contrast to siCont/siFus in B, because Fus knockdown has the opposite effects on RNAP II and nascent RNA. The P-values were calculated as in B and are indicated by dots.
Figure 3.
Figure 3.
FUS binds to RNA segments around APA sites. (A) Distribution of alternative polyA sites (APA), alternative TSSs (alt TSS), and alternative splice sites (alt SSs) around FUS CLIP clusters. The center of the cluster is set to position 0. (B) Distribution of FUS CLIP tags (red lines in left panels; CLIP) and FUS-dependent RNAP II accumulation (green lines in right panels; ChIP) around APA sites that are up-regulated (red/green lines in top panels; fold change more than four, 1033 sites) and down-regulated (red/green lines in bottom panels; fold change less than one-quarter, 1977 sites) by Fus knockdown. Unchanged APA sites (fold change two-thirds to 1.5, 3833 sites) are indicated by light-gray lines. FUS-dependent RNAP II accumulation was calculated as in Figure 2A. The P-values for the differences between siFus and siCont were calculated using Wilcoxon test and are indicated by squares. (C) Position dependence of FUS binding to RNA in the activation/inactivation of APA. Fus mRNA is knocked down in N2A cells (siFus) along with overexpression of the Ztbt24/Ewsr1 minigenes and pRL/SV40, and 3′RACE analyses were performed using real-time RCR quantification. Expression levels of the APA transcripts were normalized to that of Renilla luciferase, and the relative mRNA expression levels were normalized to the sample transfected with wild-type minigene (WT) and control siRNA (siCont). Schematic of the minigene constructs harboring the APA sites and the flanking regions are shown in the left panels. Blue lines indicate the positions of APA sites. Arrowheads indicate the forward primers for 3′ RACE. Orange boxes indicate locations of mutated regions, where FUS CLIP tags are clustered. Individual mutations disrupting GU tracts, which are potential binding sites of FUS, are shown at the bottom. The mean and SD are indicated. (**) P < 0.01 compared with the siCont of the wild-type minigene by one-way ANOVA and post-hoc Tukey test.
Figure 4.
Figure 4.
Binding of FUS to nascent RNA downstream from PAS terminates transcription and promotes polyadenylation. (A) Schemes of MS2 fusion protein constructs and the Renilla luciferase (RLUC) construct harboring short genomic regions around the polyA sites of Gapdh and Ewsr1. (B) Position-specific regulation of the luciferase activity of a minigene with the Gapdh-polyA site by FUS-MS2 fusion protein (red bar). Renilla luciferase activities were normalized to that of cotransfected firefly luciferase activity. (***) P < 0.001 compared with the relative luciferase activity of EGFP + MS2 (green bar) by one-way ANOVA and post-hoc Tukey test. (C) Schemes of the Renilla luciferase construct, placing an MS2-tethering site upstream of the Ewsr1-APA site and a constitutive SV40 polyA site downstream from Renilla luciferase. Alternative and constitutive PASs are indicated by light and dark red circles, respectively. These symbols are used in DF to indicate the constructs. A slash mark on the alternative PAS indicates a disrupted PAS. A green arrowhead indicates the forward primer for 3′ RACE in D. Blue (Up) and red (RLUC) boxes indicate positions of PCR products. Positions of PCR primers are similarly indicated above each box. (D) 3′ RACE using nested RT–PCR to detect the polyadenylated full-length transcript (Full) and alterative short transcript (APA) using total RNA from HEK293 cells transfected with the indicated luciferase minigene and MS2 constructs. (E) Tethering of FUS suppresses transcription of the downstream region independent of PAS. MS2 constructs are indicated in C. (****) P < 0.0001 by one-way ANOVA. (F) Tethered FUS suppresses pSer2-RNAP II on the downstream region even with the lack of PAS. ChIP analysis of pSer2-RNAP II was performed using the indicated luciferase minigene and MS2 constructs. (****) P < 0.0001 by t-test. Primer positions are indicated in C.
Figure 5.
Figure 5.
FUS interacts with CPSF160 and promotes binding of CPSF160 to PAS during stalling of RNAP II. (A) Distribution of RNAP II, FUS, and 3′ end processing factors in N2A cells. Cells were treated with the indicated concentrations of DRB for 2 h to inhibit RNAP II, and cell fractionation was performed followed by immunoblotting with the indicated antibodies. Histone H3 and α-tubulin are markers for chromatin-bound and chromatin-unbound soluble fractions, respectively. (B) RNA enhances interaction between endogenous FUS and RNAP II but not CPSF160. Total cell lysates were incubated with or without RNase and coimmunoprecipitated with anti-FUS antibody followed by immunoblotting with the indicated antibodies. (C) An RNAP II inhibitor, DRB, decreases RNAP II bound to FUS and increases CPSF160 bound to FUS. N2A cells treated with 100 μM DRB for the indicated durations were coimmunoprecipitated using anti-FUS antibody followed by immunoblotting. (D) FUS enhances binding of CPSF160 to PAS in the Ewsr1 minigene in cultured cells. Fus mRNA was knocked down in N2A cells (siFus) or overexpressed in HEK293 cells (FUS) along with overexpression of the Ewsr1 wild-type minigene shown in Figure 3C. The Ewsr1 minigene's mRNA was immunoprecipitated with anti-CPSF160 antibody. Ratios of the amount of coimmunoprecipitated RNA to that of input RNA were quantified by real-time RT–PCR using the RNA immunoprecipitation (RIP) primer pair in Supplemental Figure S5F. (*) P < 0.05; (**) P < 0.01 by t-test. (E) FUS enhances binding of CPSF160 to PAS in vitro. Mock-depleted (Cont) and FUS-depleted (depF) N2A nuclear extracts were affinity-purified with an RNA probe carrying the wild-type (WT) or mutant (mut) PAS and resolved by immunoblotting. Location of the RNA probe is shown in Supplemental Figure S5F.
Figure 6.
Figure 6.
FUS regulates the mRNA length of approximately two-thirds of 7377 genes expressed in N2A cells. (A) Our scheme for calculating mRNA length and a shift of TSS/PolyA site. Weighted average positions of TSSs (TSS) and polyA sites (PolyA site) of 7377 genes in which both TSSs and polyA sites were detected in CAGE-seq and PolyA-seq analyses, respectively, were calculated as follows: The most 5′ and 3′ ends of each gene according to RefSeq were set to positions 0% and 100%, respectively. The relative position of each peak of CAGE-seq or PolyA-seq was calculated (% position). The calculated positions were weighted by the amount of CAGE-seq/PolyA-seq coverage at each site to calculate the weighted average positions of the TSS and polyA site for each gene. The fractional mRNA length was calculated by subtracting the weighted average position of the TSS from that of the polyA site. A shift of TSS for each gene was calculated by subtracting the weighted average position of the TSS in siCont-treated cells from that in siCont-treated cells. A shift of the polyA site was similarly calculated for the same gene. (B) Differential mRNA length by Fus silencing. The fractional mRNA length in siCont-treated cells was subtracted from the fractional mRNA length in siFus-treated cells for each gene to calculate the difference. Genes are sorted in descending order from the most extended to the most shortened fractional mRNA length. (C) Normalized CLIP tag coverages of the genes indicated in B. FUS CLIP coverage was normalized by the expression level of each transcript by RNA-seq. The more fractional mRNA lengths were changed, the more CLIP tags were observed. (D) Scheme of gene set enrichment analysis (GSEA). Genes having FUS CLIP clusters up to −100, −200, −300, −400, and −500 nt upstream of the APA site are identified. Similarly, genes having FUS CLIP clusters up to +100, +200, +300, +400, +500 nt downstream from the APA site are identified. The 10 different gene sets were used for GSEA in E. (E) GSEA of genes indicated in B. The 10 gene sets identified in D were subjected to GSEA. Five gene sets carrying FUS CLIP clusters upstream of the APA sites are enriched in the lower region (blue lines), where the fractional mRNA lengths are shortened by Fus knockdown. In contrast, five gene sets carrying FUS CLIP clusters downstream from the APA sites are enriched in the upper region (red lines), where the fractional mRNA lengths are extended by Fus knockdown. (F) Shifts of TSSs and polyA sites by Fus silencing in N2A cells. Shifts of TSSs and PolyA sites were calculated as explained in A. Genes were sorted in the order of the most shifted to the 3′ end to the most shifted to the 5′ end. FUS modulates mRNA length mostly by shifting polyA sites not TSSs (Supplemental Fig. S6E). In addition, a shift of polyA sites is independent of that of TSSs in each gene (Supplemental Fig. S6F). (G) Exon array analysis of APA-carrying exons and the other exons upon Fus knockdown in primary motor neurons. Array signals of APA-carrying exons are either more up-regulated or down-regulated by Fus knockdown compared with the other exons on the same genes. Increased up-regulation or down-regulation by Fus knockdown results in broadly distributed fold changes with APA-carrying exons. P < 0.0001 by F-test. The box denotes the 25th and 75th percentiles; a line within a box denotes the 50th percentile; whiskers denote values of the 75th percentile + 1.5 times the vertical distance covered by the box.
Figure 7.
Figure 7.
A proposed model for RNA-dependent position-specific regulation of alternative transcription termination and polyadenylation by FUS.

Similar articles

Cited by

References

    1. Avendano-Vazquez SE, Dhir A, Bembich S, Buratti E, Proudfoot N, Baralle FE. 2012. Autoregulation of TDP-43 mRNA levels involves interplay between transcription, splicing, and alternative polyA site selection. Genes Dev 26: 1679–1684. - PMC - PubMed
    1. Bataille AR, Jeronimo C, Jacques PE, Laramee L, Fortin ME, Forest A, Bergeron M, Hanes SD, Robert F. 2012. A universal RNA polymerase II CTD cycle is orchestrated by complex interplays between kinase, phosphatase, and isomerase enzymes along genes. Mol Cell 45: 158–170. - PubMed
    1. Beaudoing E, Freier S, Wyatt JR, Claverie JM, Gautheret D. 2000. Patterns of variant polyadenylation signal usage in human genes. Genome Res 10: 1001–1010. - PMC - PubMed
    1. Berg MG, Singh LN, Younis I, Liu Q, Pinto AM, Kaida D, Zhang Z, Cho S, Sherrill-Mix S, Wan L, et al. 2012. U1 snRNP determines mRNA length and regulates isoform expression. Cell 150: 53–64. - PMC - PubMed
    1. Bertolotti A, Lutz Y, Heard DJ, Chambon P, Tora L. 1996. hTAF(II)68, a novel RNA/ssDNA-binding protein with homology to the pro-oncoproteins TLS/FUS and EWS is associated with both TFIID and RNA polymerase II. EMBO J 15: 5022–5031. - PMC - PubMed

Publication types

LinkOut - more resources