Clinical Trial
. 2015 May 20;7(288):288ra78.
doi: 10.1126/scitranslmed.aaa7014.

Adoptive transfer of activated marrow-infiltrating lymphocytes induces measurable antitumor immunity in the bone marrow in multiple myeloma

Affiliations
Clinical Trial

Adoptive transfer of activated marrow-infiltrating lymphocytes induces measurable antitumor immunity in the bone marrow in multiple myeloma

Kimberly A Noonan et al. Sci Transl Med. .

Abstract

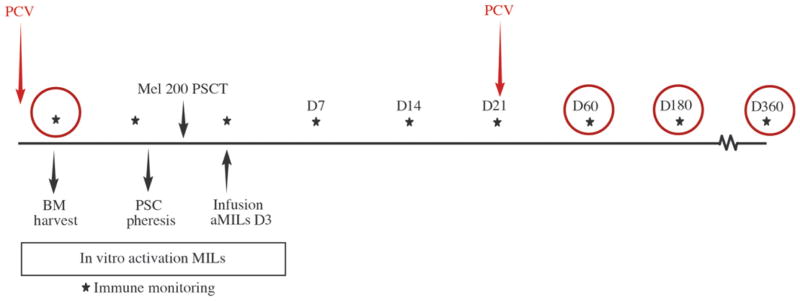
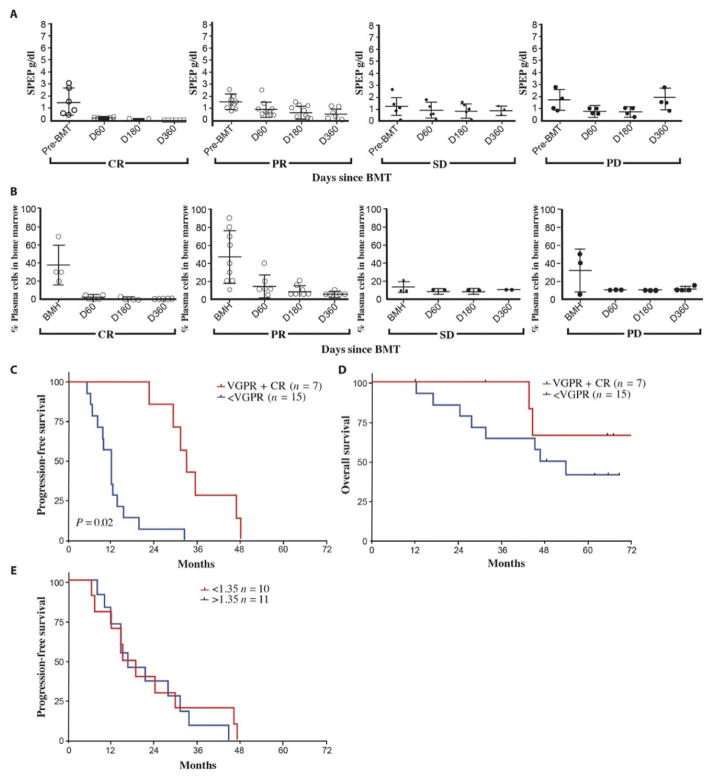
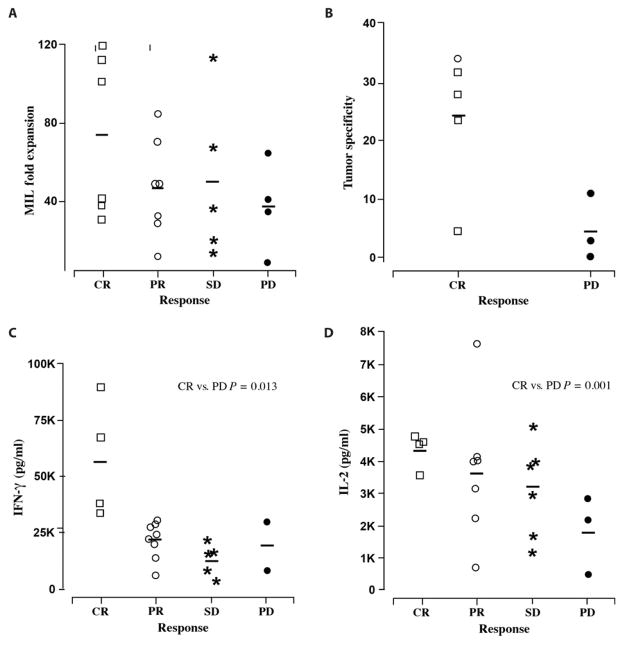
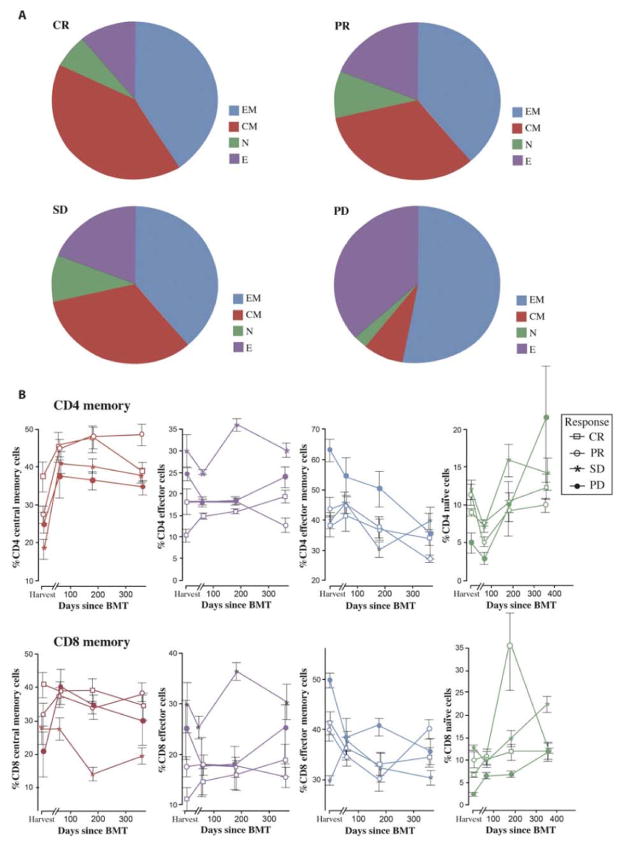
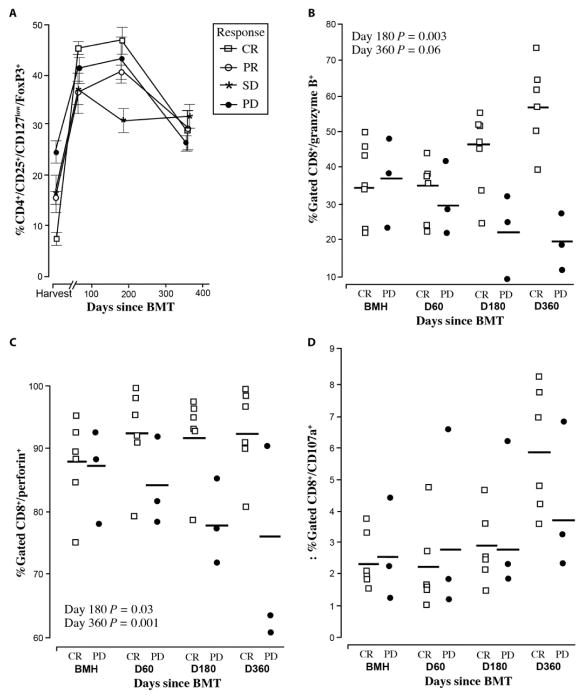
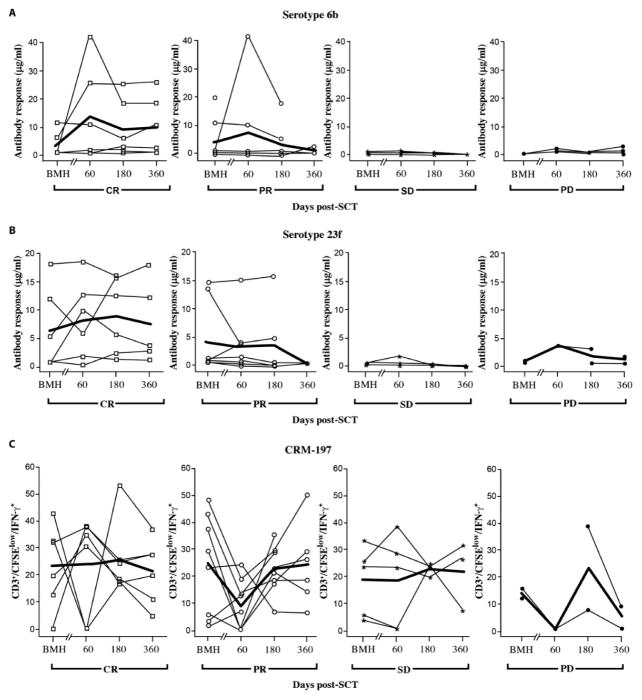
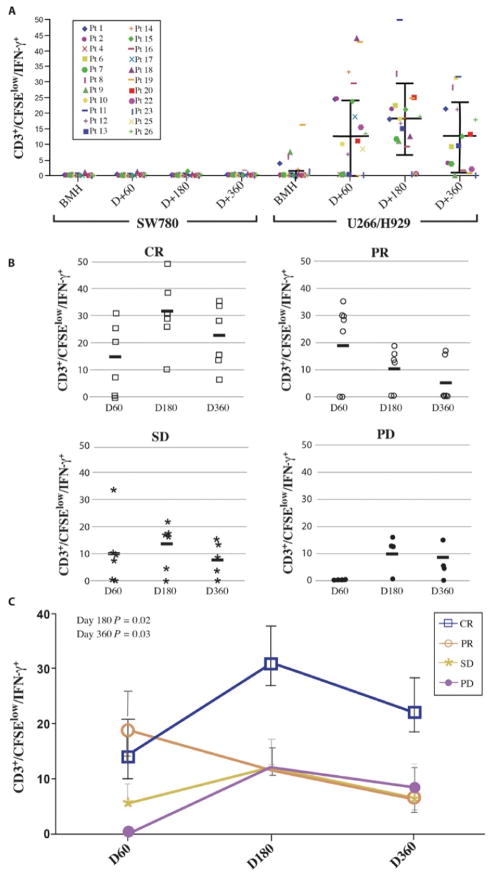
Successful adoptive T cell therapy (ACT) requires the ability to activate tumor-specific T cells with the ability to traffic to the tumor site and effectively kill their target as well as persist over time. We hypothesized that ACT using marrow-infiltrating lymphocytes (MILs) in multiple myeloma (MM) could impart greater antitumor immunity in that they were obtained from the tumor microenvironment. We describe the results from the first clinical trial using MILs in MM. Twenty-five patients with either newly diagnosed or relapsed disease had their MILs harvested, activated and expanded, and subsequently infused on the third day after myeloablative therapy. Cells were obtained and adequately expanded in all patients with anti-CD3/CD28 beads plus interleukin-2, and a median of 9.5 × 10(8) MILs were infused. Factors indicative of response to MIL ACT included (i) the presence of measurable myeloma-specific activity of the ex vivo expanded product, (ii) low endogenous bone marrow T cell interferon-γ production at baseline, (iii) a CD8(+) central memory phenotype at baseline, and (iv) the generation and persistence of myeloma-specific immunity in the bone marrow at 1 year after ACT. Achieving at least a 90% reduction in disease burden significantly increased the progression-free survival (25.1 months versus 11.8 months; P = 0.01). This study demonstrates the feasibility and efficacy of MILs as a form of ACT with applicability across many hematologic malignancies and possibly solid tumors infiltrating the bone marrow.

Trial registration: ClinicalTrials.gov NCT00566098.


Conflict of interest statement

Competing interests: The authors declare that they have no competing interests.

Figures

Fig. 1
Fig. 1. Study schema
A PCV was given 2 weeks before BM was obtained for MIL expansion. Patients then underwent a standard stem cell mobilization with cyclophosphamide and G-CSF. A melphalan-200 preparative regimen (Mel 200) was given in preparation for the SCT. The activated MILs (aMILs) were infused on day (D) 3 after transplant. A second PCV was given on day +21. Immune monitoring of the BM occurred with the BM harvest and on days 60, 180, and 360 as indicated by the circles. PSCT, peripheral SCT.
Fig. 2
Fig. 2. Clinical data
(A) Serum protein electrophoresis (SPEP) analysis. Disease burden was measured by SPEP (g/dl) at bone marrow harvest (BMH) and on days 60, 180, and 360. CR, n = 6; PR, n = 7; SD, n = 5; PD, n = 4. (B) Percentage plasma cells in BM. The percent of plasma cells in BM biopsies was determined at the indicated time points. (C) PFS. PFS was analyzed comparing patients who achieved a VGPR or better versus those who achieved less than a VGPR (P = 0.02, Student’s t test). (D) OS. OS was analyzed comparing patients who achieved a VGPR or better versus those who achieved less than a VGPR. (E) PFS and MIL dosage. PFS was analyzed comparing patients who received an MIL dose of 1.35 × 10⁸ cells to those who received less than 1.35 × 10⁸ cells.
Fig. 3
Fig. 3. MILs clinical product
(A) MILs fold expansion. Fold expansion of MIL products was analyzed according to disease response (CR, n = 6; PR, n = 7; SD, n = 5; PD, n = 4). (B) Tumor specificity of MIL product. The tumor specificity of the MIL products was measured by CD3+/CFSElow/IFN-γ–producing cells comparing patients who achieved a CR (n = 5) versus those who had PD (n = 3). (C) IFN-γ–activated MIL clinical product supernatant. IFN-γ (pg/ml) was measured in the activated MIL clinical product supernatant. Data were analyzed according to disease response. With a Kruskal-Wallis test and Wilcoxon sum rank, the patients who achieved a CR (n = 4) had significantly more IFN-γ in the product supernatant than those with PD (n = 3) (P = 0.013). (D) IL-2 MIL product supernatant. IL-2 was measured in the MIL product supernatant. Data were analyzed according to disease response. With a Kruskal-Wallis test and Wilcoxon sum rank, patients who achieved a CR (n = 4) had significantly more IL-2 than those with PD (n = 3) (P = 0.001).
Fig. 4
Fig. 4. Memory subsets
(A) T cell memory subsets at baseline. CD8 memory subsets of MILs were measured by staining CD8/CD45RO/CD62L. Subsets are as follows: naïve cells (N) are CD45RO/CD62L; effector cells (E) are CD45RO/CD62L+; effector memory cells (EM) are CD45RO+/CD62L; and central memory cells (CM) are CD45RO+/CD62L+. Data were analyzed according to disease response. CR, n = 6; PR, n = 7; SD, n = 5; PD, n = 4. (B) T cell memory subsets after MIL infusion. CD4 (upper row) and CD8 (lower row) memory cell subsets in the BM were plotted for each patient at harvest and on days 60, 180, and 360 according to disease response (CR, n = 6; PR, n = 7; SD, n = 5; PD, n = 4).
Fig. 5
Fig. 5. Peritransplant immune responses
(A) Tregs. Tregs as measured by CD4+/CD25+/FoxP3+ were measured at harvest and on days 60, 180, and 360. Data were analyzed according to disease response. CR, n = 6; PR, n = 7; SD, n = 5; PD, n = 4. (B) CD8+ granzyme B+ expression on marrow-derived T cells was analyzed in patients achieving a CR or PD by flow cytometry examining CD8 and granzyme B production. Student’s t test showed that statistical significance was reached at days 180 and 360 (P = 0.003 and 0.006, respectively). CR, n = 6; PD, n = 3. (C) CD8+ perforin+ marrow-derived T cells were analyzed by flow cytometry in patients who either achieved a CR or had PD. CD8 perforin production with Student’s t test statistical significance P = 0.03 on day 180 and P = 0.01 on day 360. CR, n = 6; PD, n = 3. (D) CD8+CD107a+ marrow-derived T cells were analyzed by flow cytometry in patients who either achieved a CR or had PD. With a Student’s t test, these data were not statistically significant.
Fig. 6
Fig. 6. PCV serologic and T cell responses
Plasma from the BM at the indicated time points before and after MIL infusion were used to quantify humoral responses. (A and B) 6B (A) and 23F (B) antibody titers after PCV vaccination. Data were graphed per patient and analyzed according to disease response. CR, n = 6; PR, n = 7; SD, n = 5; PD, n = 4. (C) CRM-197–specific T cell responses. T cell responses to CRM-197 were measured in the BM by quantifying CD3+/CFSElow/IFN-γ+ T cells. The positive responses at BMH were a result of the administration of PCV 2 weeks before the harvest. Data were analyzed according to disease response groups.
Fig. 7
Fig. 7. Tumor-specific responses
(A) Tumor-specific responses over time. Myeloma-specific immunity was measured by pulsing BM that was CFSE-labeled with tumor lysate and analyzing CD3+/CFSElow/IFN-γ+ cells as the antigen-specific cells. CR, n = 6; PR, n = 7; SD, n = 5; PD, n = 4. (B) Tumor-specific fold change over time by disease response. The fold change of CD3+/CFSElow/IFN-γ+ cells was measured from baseline over time and analyzed. (C) Tumor-specific fold change over time by disease response summary. The fold change of CD3+/CFSElow/IFN-γ+ cells was measured from baseline over time and analyzed according to disease response. With the Wilcoxon sum rank at days 180 and 360, the patients achieving a CR had statistically significantly greater fold increase in tumor-specific T cells than those in all other response groups (P = 0.02 and 0.03, respectively).

References

    1. Attal M, Harousseau JL, Stoppa AM, Sotto JJ, Fuzibet JG, Rossi JF, Casassus P, Maisonneuve H, Facon T, Ifrah N, Payen C, Bataille R. A prospective, randomized trial of autologous bone marrow transplantation and chemotherapy in multiple myeloma. Intergroupe Francais du Myelome. N Engl J Med. 1996;335:91–97. - PubMed
    1. Borrello I, Sotomayor EM, Rattis FM, Cooke SK, Gu L, Levitsky HI. Sustaining the graft-versus-tumor effect through posttransplant immunization with granulocyte-macrophage colony-stimulating factor (GM-CSF)–producing tumor vaccines. Blood. 2000;95:3011–3019. - PubMed
    1. Rapoport AP, Stadtmauer EA, Aqui N, Badros A, Cotte J, Chrisley L, Veloso E, Zheng Z, Westphal S, Mair R, Chi N, Ratterree B, Pochran MF, Natt S, Hinkle J, Sickles C, Sohal A, Ruehle K, Lynch C, Zhang L, Porter DL, Luger S, Guo C, Fang HB, Blackwelder W, Hankey K, Mann D, Edelman R, Frasch C, Levine BL, Cross A, June CH. Restoration of immunity in lymphopenic individuals with cancer by vaccination and adoptive T-cell transfer. Nat Med. 2005;11:1230–1237. - PubMed
    1. Dummer W, Niethammer AG, Baccala R, Lawson BR, Wagner N, Reisfeld RA, Theofilopoulos AN. T cell homeostatic proliferation elicits effective antitumor auto-immunity. J Clin Invest. 2002;110:185–192. - PMC - PubMed
    1. Porrata LF, Gertz MA, Inwards DJ, Litzow MR, Lacy MQ, Tefferi A, Gastineau DA, Dispenzieri A, Ansell SM, Micallef IN, Geyer SM, Markovic SN. Early lymphocyte recovery predicts superior survival after autologous hematopoietic stem cell transplantation in multiple myeloma or non-Hodgkin lymphoma. Blood. 2001;98:579–585. - PubMed

Publication types

MeSH terms

Substances

Associated data