. 2015 Aug;89(15):7905-21.
doi: 10.1128/JVI.00729-15. Epub 2015 May 20.

FUSE Binding Protein 1 Facilitates Persistent Hepatitis C Virus Replication in Hepatoma Cells by Regulating Tumor Suppressor p53

Affiliations

FUSE Binding Protein 1 Facilitates Persistent Hepatitis C Virus Replication in Hepatoma Cells by Regulating Tumor Suppressor p53

Updesh Dixit et al. J Virol. 2015 Aug.

Erratum in

Abstract

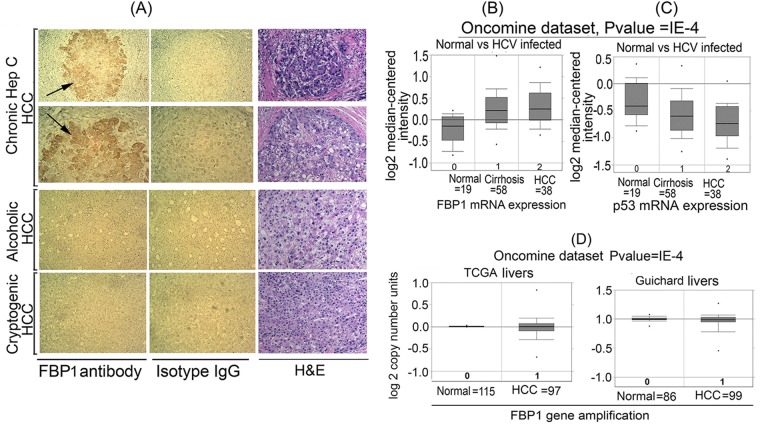
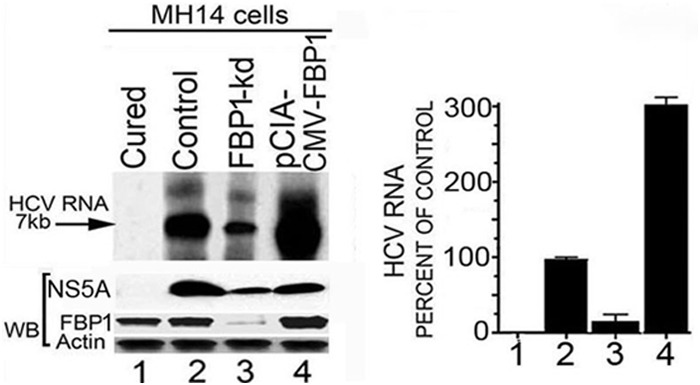
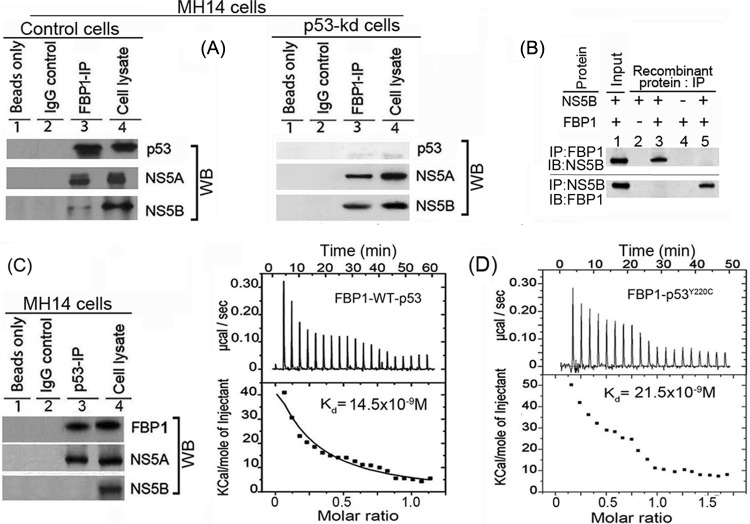
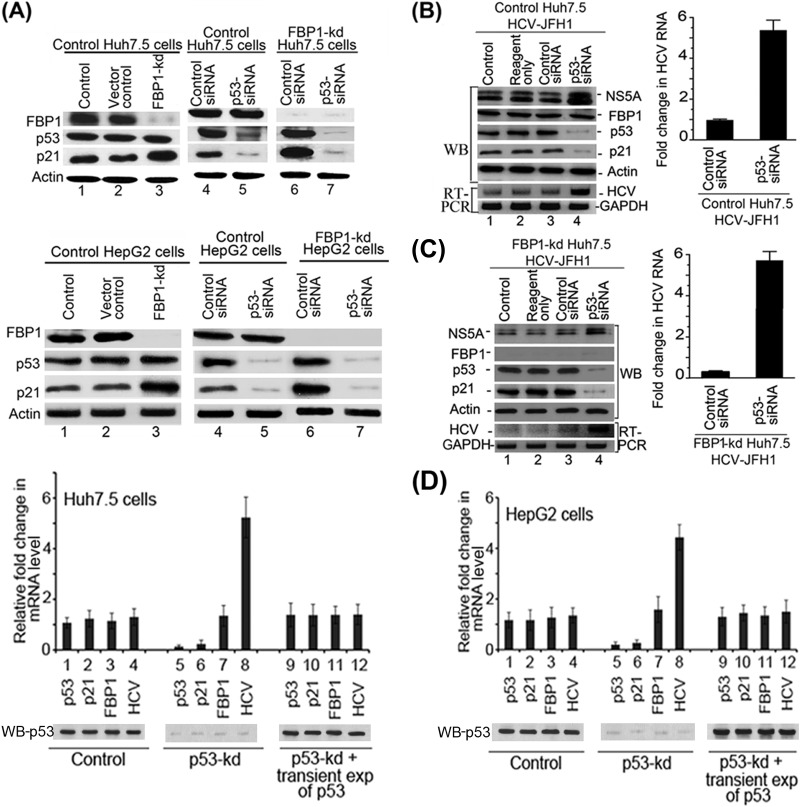
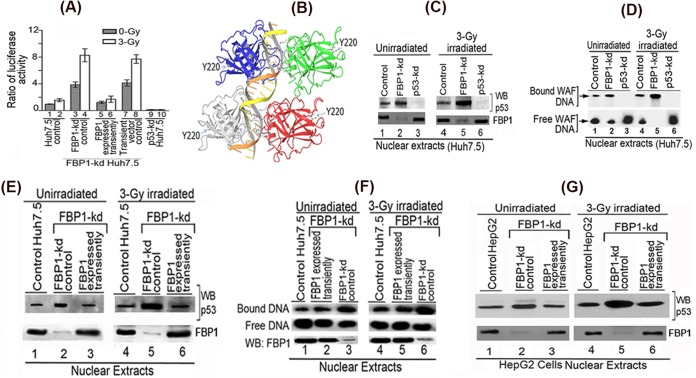
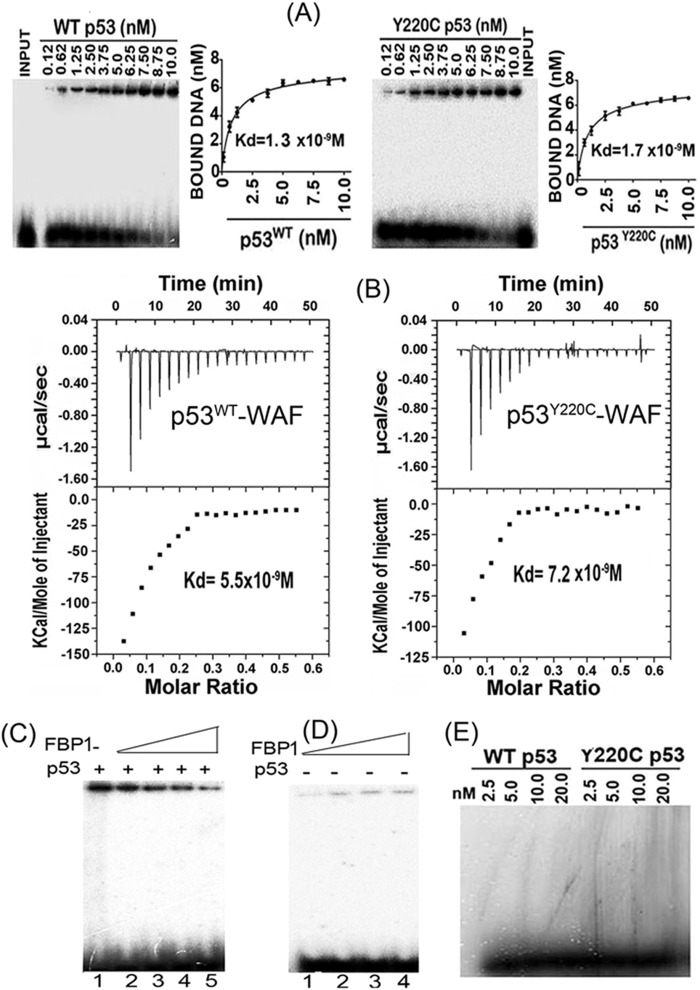
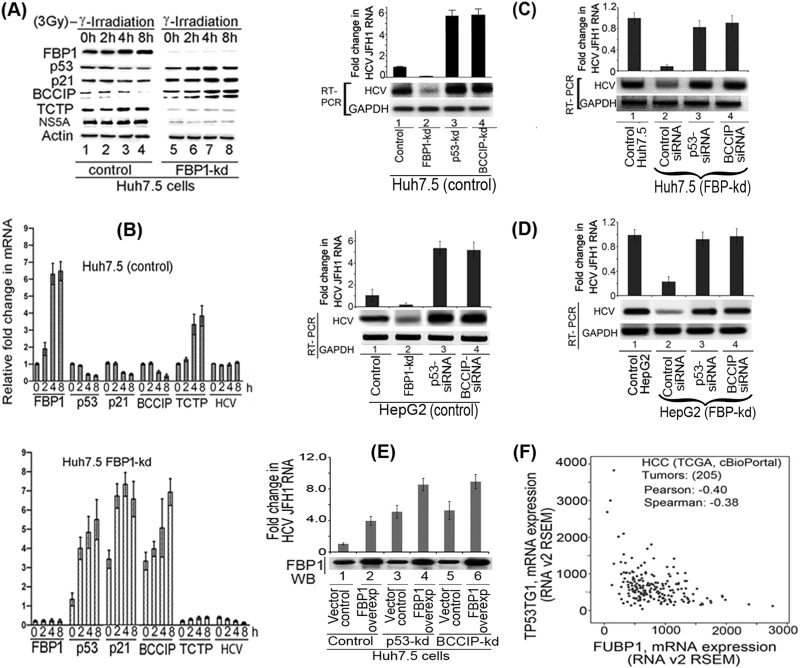
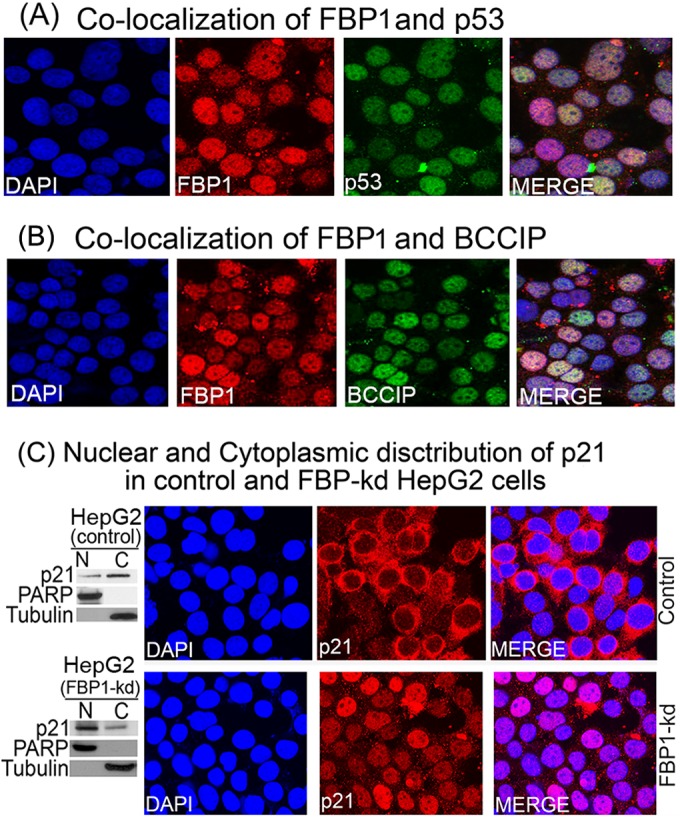
Hepatitis C virus (HCV) is a leading cause of chronic hepatitis C (CHC), liver cirrhosis, and hepatocellular carcinoma (HCC). Immunohistochemistry of archived HCC tumors showed abundant FBP1 expression in HCC tumors with the CHC background. Oncomine data analysis of normal versus HCC tumors with the CHC background indicated a 4-fold increase in FBP1 expression with a concomitant 2.5-fold decrease in the expression of p53. We found that FBP1 promotes HCV replication by inhibiting p53 and regulating BCCIP and TCTP, which are positive and negative regulators of p53, respectively. The severe inhibition of HCV replication in FBP1-knockdown Huh7.5 cells was restored to a normal level by downregulation of either p53 or BCCIP. Although p53 in Huh7.5 cells is transcriptionally inactive as a result of Y220C mutation, we found that the activation and DNA binding ability of Y220C p53 were strongly suppressed by FBP1 but significantly activated upon knockdown of FBP1. Transient expression of FBP1 in FBP1 knockdown cells fully restored the control phenotype in which the DNA binding ability of p53 was strongly suppressed. Using electrophoretic mobility shift assay (EMSA) and isothermal titration calorimetry (ITC), we found no significant difference in in vitro target DNA binding affinity of recombinant wild-type p53 and its Y220C mutant p53. However, in the presence of recombinant FBP1, the DNA binding ability of p53 is strongly inhibited. We confirmed that FBP1 downregulates BCCIP, p21, and p53 and upregulates TCTP under radiation-induced stress. Since FBP1 is overexpressed in most HCC tumors with an HCV background, it may have a role in promoting persistent virus infection and tumorigenesis.

Importance: It is our novel finding that FUSE binding protein 1 (FBP1) strongly inhibits the function of tumor suppressor p53 and is an essential host cell factor required for HCV replication. Oncomine data analysis of a large number of samples has revealed that overexpression of FBP1 in most HCC tumors with chronic hepatitis C is significantly linked with the decreased expression level of p53. The most significant finding is that FBP1 not only physically interacts with p53 and interferes with its binding to the target DNA but also functions as a negative regulator of p53 under cellular stress. FBP1 is barely detectable in normal differentiated cells; its overexpression in HCC tumors with the CHC background suggests that FBP1 has an important role in promoting HCV infection and HCC tumors by suppressing p53.


Figures

FIG 1
FIG 1
FBP1 is specifically overexpressed in human HCC tumors with CHC background. (A) Immunohistochemistry was done on archived HCC tumors; seven had a history of chronic hepatitis (Hep) C, three had the alcoholic background, and two were cryptogenic. Based on the Edmondson and Steiner nuclear grading scheme (79), 4 of the HCC-HCV tumors were well differentiated (grade1), 2 were moderately differentiated (grade 2), and 1 was moderately to poorly differentiated (grades 2 to 3). All of the alcoholic and cryptogenic HCC were moderately differentiated grade 2 tumors. Representative pictures are shown of HCC tumors treated with a polyclonal antibody against FBP1 (left) or isotype IgG (middle). The hematoxylin-eosin (H&E) staining of the corresponding slides is shown on the right. The alcoholic and cryptogenic HCC slides show only the cancer area. (B and C) Oncomine data analysis for FBP1 and p53 expression in 19 normal human livers versus 58 cirrhotic livers and 38 HCC tumors with a CHC background (31). (D) Oncomine data analysis of FBP1 gene amplification in normal livers versus HCC liver tumors from two data sets, one from TCGA livers (TCGA 2012) and the other from Guichard livers (32).
FIG 2
FIG 2
Endogenous HCV replication in cell-free replication lysates is severely reduced in FBP1-kd cells but increased in FBP1-overexpressing MH14 cells. An aliquot of normalized replication lysates from MH14 cells in which FBP1 was either knocked down or overexpressed was examined for endogenous HCV replication activity; the radiolabeled RNA products were analyzed by denaturing agarose gel electrophoresis and visualized by autoradiography. Normalized cell-free replication lysates also were Western blotted (WB) for the expression level of FBP1, HCV NS5A, and actin. (Left) Lane 1, cured MH14 cells without HCV replicons; lane 2, control MH14 cells with HCV replicons; lane 3, FBP1-kd MH14 cells; lane 4, MH14 cells in which FBP1 was overexpressed. (Right) The percentage of endogenous replication products relative to those in controls.
FIG 3
FIG 3
FBP1 physically interacts with p53 and HCV proteins NS5B and NS5A. (A) FBP1 IP was done on RNase-treated lysates from control MH14 cells (left) or p53-kd MH14 cells (right) and Western blotted for p53, NS5A, and NS5B. Lane 1, beads only; lane 2, isotype IgG control; lane 3, IP sample; lane 4, cell lysate. (B) FBP1 IP and NS5B IP on a mixture of purified proteins pull down each other. We used 2 μg each of purified recombinant FBP1 and NS5B and carried out reciprocal IP and Western blotting for either FBP1 or NS5A. (Upper) Lanes 2 to 5, FBP1 IP immunoblotted (IB) for NS5B. (Bottom) Lanes 2 to 5, NS5B IP immunoblotted for FBP1. Lane 1, input protein controls. (C) p53 IP on the lysates from control MH14 cells. Lane 1, beads only; lane 2, isotype IgG control; lane 3, IP sample; lane 4, cell lysate. (D) Isothermal titration calorimetry of FBP1 interaction with wild-type p53 (left) and Y220C mutant p53 (right). A syringe of ITC containing purified p53 was titrated into a cell containing purified FBP1 in ITC buffer containing 20 mM sodium phosphate buffer, pH 7.8, and 150 mM NaCl at 25°C. (Top) The calorimetric data on titration of FBP1 with p53 as a function of time. (Bottom) The integrated heat per injection versus the molar ratio of p53 to FBP1. The graph corresponds to the best fit of the experimental data to a one-site model, providing a dissociation constant (37) of 14.5 nM for wild-type p53 and 21.5 nM for the Y220C mutant.
FIG 4
FIG 4
Downregulation of p53 and FBP1 have opposite effects on p21 expression and HCV replication. (A) Upregulation of p21 in FBP1-kd Huh7.5 or HepG2 cells is abolished upon downregulation of p53. Control and FBP1-kd Huh7.5 cells (upper) or HepG2 cells (lower) were transfected with p53 siRNA and grown for 48 h. The normalized cell lysates were analyzed for the expression of FBP1, p53, p21, and actin by Western blotting. Lane 1, control cells; lane 2, vector control; lane 3, FBP1-kd cells; lanes 4 and 6, cells transfected with control siRNA; lanes 5 and 7, cells transfected with p53 siRNA. (B and C) Downregulation of p53 enhanced HCV replication in control and FBP1-kd Huh7.5 cells. Control Huh7.5 cells (B) and stable FBP1-kd Huh7.5 cells (C) were transfected with p53 siRNA and, 10 h later, infected with infectious HCV-JFH1 virions and then grown further for 72 h. Cell lysates were prepared, normalized for protein concentration, and Western blotted for the expression of NS5A, FBP1, p53, p21, and actin. Another set of cells was used for isolation of total RNA for quantitative real-time RT-PCR of JFH1 HCV RNA and GAPDH mRNA. (Left) Lane 1, control; lane 2, reagent control; lane 3, siRNA control; lane 4, p53 siRNA. (Right) Fold change in JFH1 HCV RNA concentration in control and FBP1-kd Huh7.5 cells quantified by real-time RT-PCR. (D) Transient (exp) expression of p53 suppresses HCV replication in p53-kd Huh7.5 and HepG2 cells. Stable p53-kd Huh7.5 cells (left) and HepG2 cells (right) were transfected with an shRNA-resistant expression clone of p53, and 10 h later, Huh7.5 cells were infected with HCV-JFH1 virions while HepG2 cells were transfected with MH14 HCV replicon RNA. Cells were grown for 72 h; total RNA was isolated. The quantitative real-time RT-PCR for HCV RNA and mRNA levels of p53, p21, and FBP1 were carried out with GAPDH mRNA as the internal control. The Western blot of p53 expression also is shown. Lanes 1 to 4, control cells; lane 5 to 8, p53-kd cells; lanes 9 to 12, p53-kd cells in which p53 was transiently expressed.
FIG 5
FIG 5
Transactivation activity and DNA binding ability of mutant p53Y220C in Huh7.5 cells is activated by knockdown of FBP1 expression. (A) Transcription activity of mutant p53Y220C in control and FBP1-kd Huh7.5 cells under radiation-induced stress. The p21-luc reporter and pRL-SV40 plasmids were cotransfected into control, FBP1-kd, and FBP1-kd cells in which FBP1 was transiently expressed via transfection of an shRNA-resistant FBP1-expressing clone (pCIA-cmv-FBP1SHR). Forty-eight hours later, cells were irradiated with a 3-Gy dose of gamma irradiation. Luciferase activity was measured after 6 h postirradiation. Experiments were done in triplicate; results are expressed as the ratio of firefly luciferase to Renilla luciferase activities in cell lysate. Lanes 1 and 2, control cells; lanes 3 and 4, FBP1-kd cells; lanes 5 and 6, FBP1 transiently expressed in FBP1-kd cells; lanes 7 and 8, FBP1-kd cells transfected with vector alone; lanes 9 and 10, p53 kd cells. (B) The three-dimensional structure of homotetrameric p53-DNA binary complex and position of Y220. Using Maestro molecular modeling software, version 9.3.5 (Schrodinger, Inc.), we downloaded the backbone structure of the p53-DNA binary complex from PDB entry 4HJE (80). The three-dimensional crystal structure of DNA-bound p53 is displayed without any modification. The backbone of duplex DNA bound to the tetrameric p53 and the position of Y220 located far away from the bound DNA are shown. (C) Streptavidin magnetic bead DNA binding assay indicates enhanced DNA binding activity of mutant p53Y220C in the nuclear extract from FBP1-kd Huh7.5 cells. Normalized nuclear extracts from unirradiated or 3-Gy-γ-irradiated control and FBP1-kd cells were incubated with 30 bp biotinylated WAF-side DNA at 37°C. The nuclear extract from p53-kd cells was included as a negative control. DNA-protein complexes were captured on streptavidin paramagnetic beads, resolved on SDS-PAGE, and Western blotted for p53. The normalized nuclear extract also was Western blotted for FBP1. Lanes 1 to 3, unirradiated; lanes 4 to 6, γ-irradiated. (D) EMSA showing enhanced binding of 30 bp WAF-side DNA by p53Y220C in the nuclear extract from FBP1-kd Huh7.5 cells. Normalized nuclear extracts from unirradiated and 3-Gy-γ-irradiated control and FBP1-kd cells were incubated with 32P-labeled WAF-side DNA and then subjected to EMSA on 4% native polyacrylamide gel. p53-kd Huh7.5 cells were included as a negative control. Lanes 1 to 3, unirradiated; lanes 4 to 6, γ-irradiated. (E and F) Transient expression of FBP1 in FBP1-kd cells strongly inhibits p53Y220C binding to its target DNA. DNA binding activity of mutant p53 in normalized nuclear extract from unirradiated and irradiated control, FBP1-kd, and transiently FBP1 expressing FBP1-kd Huh7.5 cells was examined by streptavidin magnetic bead DNA binding assay (E) and EMSA (F). The normalized nuclear extract also was Western blotted for FBP1. Lanes 1 to 3, unirradiated; lanes 4 to 6, irradiated. (G) Transient expression of FBP1 in FBP1-kd HepG2 cells inhibits binding of wild-type p53 to its target DNA. DNA binding activity of wild-type p53 in a normalized nuclear extract from unirradiated and irradiated control, FBP1-kd, and transiently FBP1-expressing FBP1-kd HepG2 cells was examined by streptavidin magnetic bead DNA binding assay. The p53 bound to the target DNA was captured on streptavidin magnetic beads and Western blotted for p53. The normalized nuclear extract also was Western blotted for FBP1. Lanes 1 to 3 represent unirradiated control, FBP-kd, and FBP-kd cells, respectively, transiently expressing FBP1; lanes 4 to 6 represent irradiated control, FBP-kd, and FBP-kd cells, respectively, transiently expressing FBP1.
FIG 6
FIG 6
Target DNA binding affinity of recombinant wild-type p53 and mutant p53Y220C. (A) EMSA with purified wild-type p53 and mutant p53Y220C shows similar DNA binding affinity for the target DNA. A fixed concentration of 32P-labeled 30-bp WAF-side DNA was incubated with increasing concentrations of purified recombinant wild-type p53 (left) or mutant p53Y220C (right) at 37°C. The mixture was subjected to EMSA. The bound WAF-side DNA level versus the tetrameric p53 concentration was plotted using GraphPad, and the dissociation constant was determined using a nonlinear regression curve fit for one-site binding of DNA with tetrameric p53. (B) ITC of 30-bp WAF-side DNA binding to the wild-type p53 (left) and mutant p53Y220C (right) shows similar binding affinity. A syringe of ITC containing WAF-side DNA was titrated into a cell containing purified wild-type or mutant p53 in ITC buffer containing 20 mM sodium phosphate buffer, pH 7.8, and 150 mM NaCl at 37°C. (Top) The calorimetric data of titration of p53 with DNA as a function of time. (Bottom) The integrated heat per injection versus the molar ratio of tetrameric p53 to DNA. The graph corresponds to the best fit of the experimental data to the one-site model, providing a dissociation constant (37) of 5.5 nM for the wild-type p53 and 7.2 nM for the mutant p53Y220C. (C) Inhibition of DNA binding activity of wild-type p53 by recombinant FBP1. The purified recombinant p53 (7 nM) was incubated with increasing concentrations of FBP1 (25 to 100 nM) in a final volume of 20 μl. After 30 min of incubation at room temperature, a fixed concentration of 32P-labeled 30-bp WAF-side DNA (40,000 cpm) was added; the mixture was incubated for 30 min at 37°C. The p53-DNA complexes were resolved by EMSA. Lane 1, p53 binding to DNA in the absence of FBP1; lanes 2 through 5, p53 binding to DNA in the presence of 25, 50, 75, and 100 nM recombinant FBP1. (D) Binding of FBP1 alone to 32P-labeled WAF-side DNA is not significant. Lanes 1 through 4, increasing concentrations of FBP1 (25 to 100 nM) were incubated at room temperature with 32P-labeled WAF-side DNA (40,000 cpm) in a final volume of 20 μl for 30 min. The bound and unbound DNA were resolved by EMSA. (E) EMSA with a nontarget 32P-labeled 30-bp HIV-1 U5 PBS DNA was used to determine the target specificity of wild-type p53 and mutant p53Y220C.
FIG 7
FIG 7
FBP1 promotes HCV replication by regulating p53 and its regulatory proteins, TCTP and BCCIP. (A) FBP1 upregulates TCTP while it downregulates the expression of p53, p21, and BCCIP under cellular stress. The control and FBP1-kd Huh7.5 cells were transfected with JFH1-HCV virus; 72 h later, cells were irradiated with 3 Gy gamma irradiation and grown for the indicated times, and their cell lysates were examined for the expression of FBP1, p53, p21, BCCIP, TCTP, and NS5A by Western blotting. Lanes 1 to 4 (control Huh7.5 cells) and lanes 5 to 8 (FBP1-kd Huh7.5 cells) show results after growth for 0, 2, 4, and 8 h postirradiation. (B) Fold change in HCV RNA and mRNA level of FBP1, p53, p21, BCCIP, and TCTP in control (top) and FBP1-kd (bottom) Huh7.5 cells. Quantitative RT-PCR on total RNA isolated from another set of cells in the same experiment was done to determine relative fold changes in mRNA levels of FBP1, p53, p21, BCCIP, TCTP, and HCV RNA at 0, 2, 4, and 8 h postirradiation. (C, left) Control Huh7.5 cells knocked down for either p53Y220C or BCCIP are highly permissive to HCV replication. Lane 1, control cells; lane 2, FBP1-kd cells; lane 3, p53-kd cells; lane 4, BCCIP-kd cells. (Right) HCV replication in FBP1-kd Huh7.5 cells is restored by downregulation of either p53 or BCCIP. Lane 1, untransfected control Huh7.5 cells; lanes 2 to 4, FBP1-kd cells were transfected with control siRNA, p53-siRNA, and BCCIP-siRNA, respectively. (D, left) Downregulation of p53 or BCCIP enhances HCV replication in control HepG2/CD81/miR122 cells. HepG2 cells expressing CD81 and miR122 were transfected with either p53 siRNA or BCCIP siRNA, and 12 h later they were infected with JFH1 HCV virions. Cells were grown for 72 h and analyzed for HCV RNA level by quantitative real-time PCR. Lane 1, control cells; lane 2, FBP1-kd cells; lanes 3 and 4, cells transfected with p53-siRNA and BCCIP-siRNA, respectively. (Right) Downregulation of p53 or BCCIP restored HCV replication in FBP1-kd HepG2/CD81/miR122 cells. FBP1-kd HepG2 cells expressing CD81 and miR122 were transfected with p53-siRNA or BCCIP-siRNA. After 12 h posttransfection, cells were infected with JFH1 HCV and grown for 72 h. Total RNA was isolated, and quantitative real-time PCR determined the level of HCV RNA. Lane 1, untransfected control HepG2 cells; lanes 2 to 4, FBP1-kd cells were transfected with control siRNA, p53-siRNA, and BCCIP-siRNA, respectively. (E) The level of HCV replication in highly permissive p53-kd or BCCIP-kd cells is further increased by overexpression (overexp) of FBP1. The FBP1 overexpression plasmid (pCIA-CMV-FBP) was transfected into control, p53-kd, and BCCIP-kd Huh7.5 cells; 10 h later cells were infected with HCV-JFH1 virions. The cells transfected with vector alone were used as controls. The cells were grown for 72 h, and levels of HCV RNA were determined by quantitative RT-PCR. The FBP1 expression in cells was examined by Western blotting of the normalized cell lysates. Lanes 2, 4, and 6 are control, p53-kd, and BCCIP-kd cells, respectively, in which FBP1 was overexpressed. Lanes 1, 3, and 5 are the respective vector controls. (F) The cBioPortal coexpression analysis of FBP1 and p53-inducible gene TP53TG1. The cBioPortal coexpression analysis was done on data from 205 HCC tumors (TCGA, Provisional), indicating an inverse correlation between the expression of FBP1 and the p53-inducible gene, TP53TG1.
FIG 8
FIG 8
Migration of FBP1-kd Huh7.5 cells is drastically reduced. (A) Wound-healing assay with control and FBP-kd cells. Cells grown to 100% confluence were starved by restricting FBS in the medium to 0.1% overnight. A wound-like simulation was done by making a scratch across each well. Cells then were supplemented with medium with 10% FBS. Images were taken at the indicated times (left), and the areas covered by the scratches were quantified by ImageJ software (right). AU, arbitrary units. (B) Real-time migration dynamics also indicated a drastic reduction in the migration of FBP1-kd cells. We used the RTCA DP Xcelligence system to measure the real-time migration of control and FBP1-kd Huh7.5 cells (30). Migration is shown as a change in delta cell index versus time. (C) Expression of cell migration markers in control and FBP1-kd cells. Control and FBP1-kd cells were grown to 50% confluence, starved overnight in 0.1% FBS, and then supplemented with 10% FBS. Cell were grown further for 32 h and lysed, and cell lysates were Western blotted for cortactin, p130Cas, and actin (lanes 1 and 2). To detect the level of the phosphorylated form of cortactin and p130Cas, we carried out IP using antibody against cortactin and p130Cas and immunoblotted them for total cortactin or p130Cas, as well as their phosphorylated forms, using antibody against phosphotyrosine (lanes 3 and 4).
FIG 9
FIG 9
Colocalization of FBP1-p53 and FBP1-BCCIP and cellular distribution of p21 in control and FBP1-kd cells. Huh7.5 cells were grown on chamber slides and treated with goat anti-FBP1 antibody and Alexa 568-labeled secondary antibody (red), treated with mouse anti-p53 antibody (A) or mouse anti-BCCIP antibody (B), and then treated with Alexa 488-labeled secondary antibody (green). DAPI was used to stain the nuclei (blue). Cells were observed individually for FBP1, BCCIP, and p53 localization by a Nikon A1R confocal microscope. (C) The cellular distribution of p21 in control and FBP1-kd HepG2 cells. (Left) Distribution of p21 in the nuclear (N) and cytoplasmic (C) fractions of control and FBP1-kd HepG2 cells. Nuclear and cytoplasmic fractions from control and FBP1-kd cells were prepared and Western blotted for p21. PARP and tubulin also were Western blotted as specific markers for the nucleus and cytoplasm, respectively. (Right) Control and FBP-kd HepG2 cells were grown on a chamber slide for 24 h, fixed, and treated with anti-p21 antibody and Alexa 568-labeled secondary antibody (red). DAPI was used to stain the nuclei. The cellular distribution of p21 was observed under a confocal microscope.

Similar articles

Cited by

References

    1. Choo QL, Weiner AJ, Overby LR, Kuo G, Houghton M, Bradley DW. 1990. Hepatitis C virus: the major causative agent of viral non-A, non-B hepatitis. Br Med Bull 46:423–441. - PubMed
    1. Denniston MM, Jiles RB, Drobeniuc J, Klevens RM, Ward JW, McQuillan GM, Holmberg SD. 2014. Chronic hepatitis C virus infection in the United States, National Health and Nutrition Examination Survey 2003 to 2010. Ann Int Med 160:293–300. doi:10.7326/M13-1133. - DOI - PMC - PubMed
    1. Mohd Hanafiah K, Groeger J, Flaxman AD, Wiersma ST. 2013. Global epidemiology of hepatitis C virus infection: new estimates of age-specific antibody to HCV seroprevalence. Hepatology 57:1333–1342. doi:10.1002/hep.26141. - DOI - PubMed
    1. Denniston MM, Klevens RM, McQuillan GM, Jiles RB. 2012. Awareness of infection, knowledge of hepatitis C, and medical follow-up among individuals testing positive for hepatitis C: National Health and Nutrition Examination Survey 2001-2008. Hepatology 55:1652–1661. doi:10.1002/hep.25556. - DOI - PMC - PubMed
    1. Liu X, Wilcken R, Joerger AC, Chuckowree IS, Amin J, Spencer J, Fersht AR. 2013. Small molecule induced reactivation of mutant p53 in cancer cells. Nucleic Acids Res 41:6034–6044. doi:10.1093/nar/gkt305. - DOI - PMC - PubMed

Publication types

MeSH terms

Associated data