Comparative Study
. 2015 Aug;89(15):7955-69.
doi: 10.1128/JVI.00909-15. Epub 2015 May 20.

Caribbean and La Réunion Chikungunya Virus Isolates Differ in Their Capacity To Induce Proinflammatory Th1 and NK Cell Responses and Acute Joint Pathology

Affiliations
Comparative Study

Caribbean and La Réunion Chikungunya Virus Isolates Differ in Their Capacity To Induce Proinflammatory Th1 and NK Cell Responses and Acute Joint Pathology

Teck-Hui Teo et al. J Virol. 2015 Aug.

Abstract

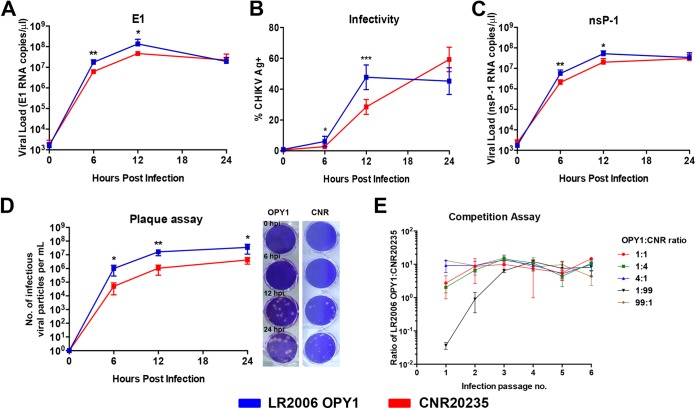
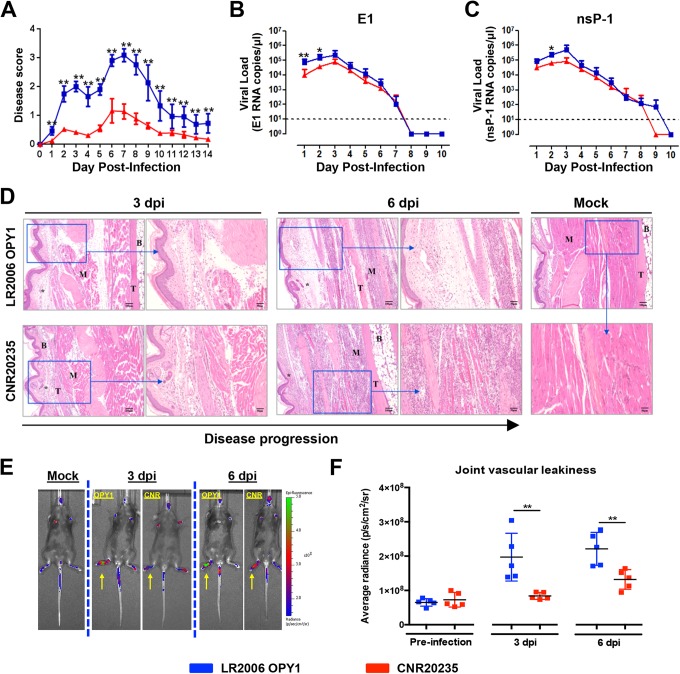
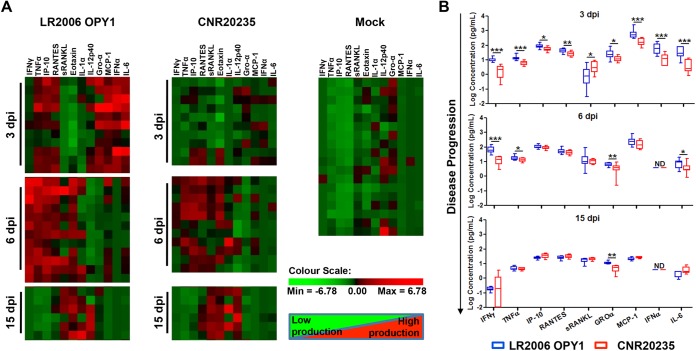
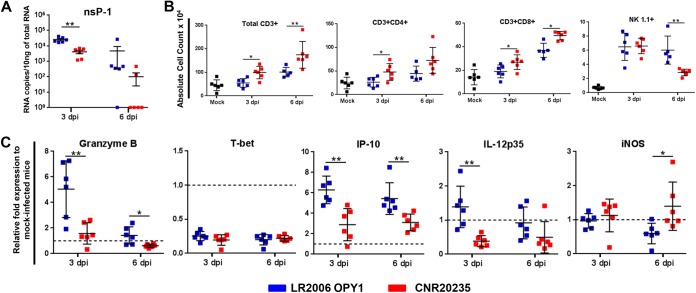
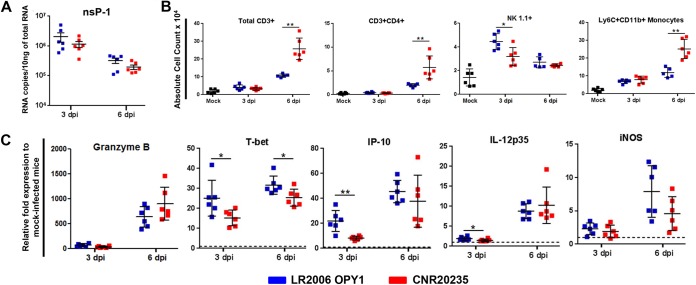
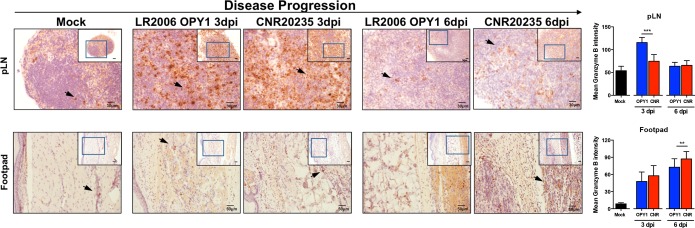
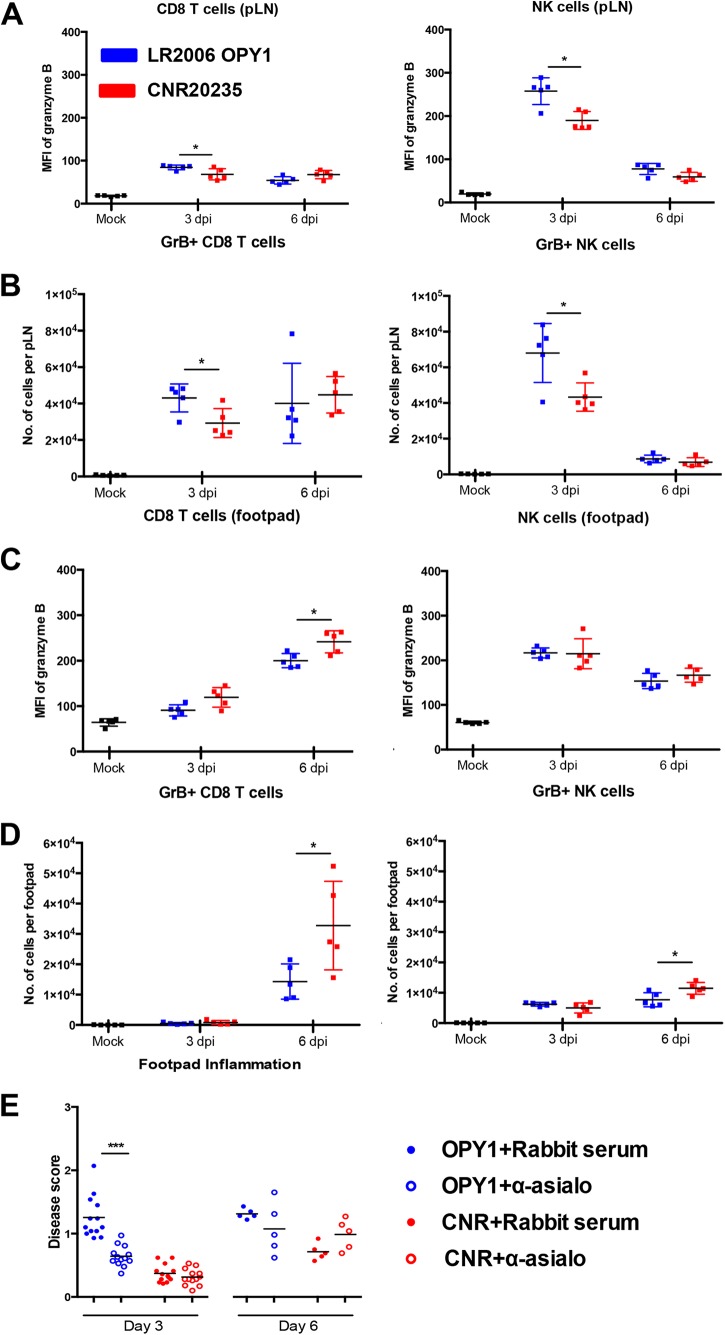
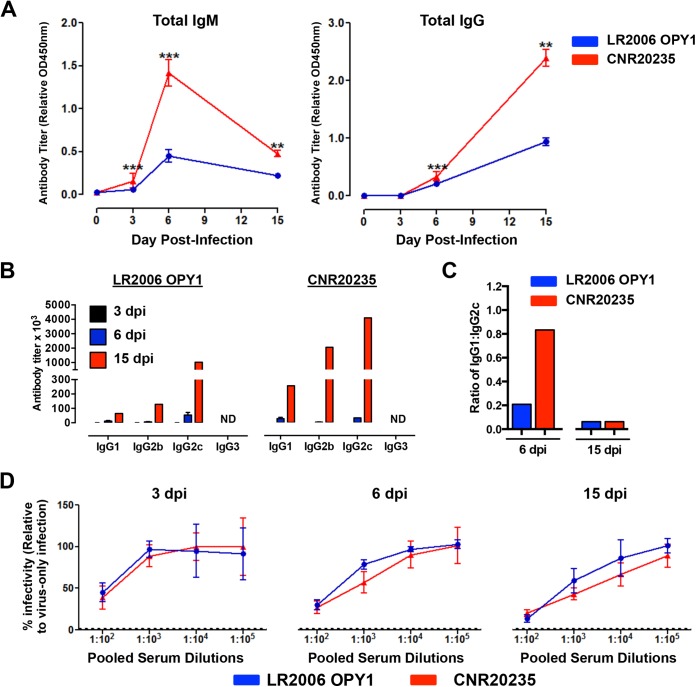
Chikungunya virus (CHIKV) is a mosquito-borne arthralgic alphavirus that has garnered international attention as an important emerging pathogen since 2005. More recently, it invaded the Caribbean islands and the Western Hemisphere. Intriguingly, the current CHIKV outbreak in the Caribbean is caused by the Asian CHIKV genotype, which differs from the La Réunion LR2006 OPY1 isolate belonging to the Indian Ocean lineage. Here, we adopted a systematic and comparative approach against LR2006 OPY1 to characterize the pathogenicity of the Caribbean CNR20235 isolate and consequential host immune responses in mice. Ex vivo infection using primary mouse tail fibroblasts revealed a weaker replication efficiency by CNR20235 isolate. In the CHIKV mouse model, CNR20235 infection induced an enervated joint pathology characterized by moderate edema and swelling, independent of mononuclear cell infiltration. Based on systemic cytokine analysis, localized immunophenotyping, and gene expression profiles in the popliteal lymph node and inflamed joints, two pathogenic phases were defined for CHIKV infection: early acute (2 to 3 days postinfection [dpi]) and late acute (6 to 8 dpi). Reduced joint pathology during early acute phase of CNR20235 infection was associated with a weaker proinflammatory Th1 response and natural killer (NK) cell activity. The pathological role of NK cells was further demonstrated as depletion of NK cells reduced joint pathology in LR2006 OPY1. Taken together, this study provides evidence that the Caribbean CNR20235 isolate has an enfeebled replication and induces a less pathogenic response in the mammalian host.

Importance: The introduction of CHIKV in the Americas has heightened the risk of large-scale outbreaks due to the close proximity between the United States and the Caribbean. The immunopathogenicity of the circulating Caribbean CHIKV isolate was explored, where it was demonstrated to exhibit reduced infectivity resulting in a weakened joint pathology. Analysis of serum cytokine levels, localized immunophenotyping, and gene expression profiles in the organs revealed that a limited Th1 response and reduced NK cells activity could underlie the reduced pathology in the host. Interestingly, higher asymptomatic infections were observed in the Caribbean compared to the La Réunion outbreaks in 2005 and 2006. This is the first study that showed an association between key proinflammatory factors and pathology-mediating leukocytes with a less severe pathological outcome in Caribbean CHIKV infection. Given the limited information regarding the sequela of Caribbean CHIKV infection, our study is timely and will aid the understanding of this increasingly important disease.


Figures

FIG 1
FIG 1
In vitro infection kinetics of LR2006 OPY1 and CNR20235. (A to D) Time course-dependent infection kinetics were examined ex vivo in WT C57BL/6 MTFs. Cells were infected with LR2006 OPY1 and CNR20235 at an MOI of 1 with E1 viral load (A), infectivity (B), nsP1 viral load (C), and plaque assay with infectious viral particles (D) tracked over 24 h (n = 5 per group). Representative images of LR2006 OPY1 and CNR20235 plaques obtained at 10−5 and 10−3 dilution, respectively, are shown. The data are presented as means ± the SD from two independent experiments (two-tailed Mann-Whitney U test). **, P = 0.079 (6 hpi, E1 viral load); *, P = 0.0317 (12 hpi, E1 viral load); *, P = 0.0159 (6 hpi, infectivity); **, P = 0.0079 (12 hpi, infectivity); **, P = 0.0079 (6 hpi, nsP1 viral load); *, P = 0.0159 (12 hpi, nsP1 viral load); *, P = 0.0159 (6 hpi, plaque assay); **, P = 0.0079 (12 hpi, plaque assay); *, P = 0.0159 (24 hpi, plaque assay). (E) Competition infection with LR2006 OPY1 and CNR20235 in Vero E6 cells at various initial virus ratios of LR2006 OPY1 to CNR20235 (1:1, 1:4, 4:1, 1:99, and 99:1) over six passages (n = 3 for all ratios). CHIKV isolate-specific nsP1 viral RNA copies were quantified, and graphs were plotted as the ratio of LR2006 OPY1 to CNR20235 nsP1 copies.
FIG 2
FIG 2
Differential pathological outcomes induced by LR2006 OPY1 and CNR20235 CHIKV infections in mice. Three-week-old WT C57BL/6 female mice were infected with LR2006 OPY1 or CNR20235 (106 TCID50) (n = 6 per group) by joint footpad inoculation. (A) Disease severity was assessed and scored. Viremia was determined by qRT-PCR targeting for the E1 (B) and negative-sense (C) nsP1 genes. Dotted line indicates limit of detection. All data are presented as mean ± the SD of two independent experiments (two-tailed Mann-Whitney U test). For the disease scores: **, P = 0.002 (1 dpi); **, P = 0.002 (2 dpi); **, P = 0.005 (3 dpi); **, P = 0.002 (4 dpi); **, P = 0.005 (5 dpi); **, P = 0.002 (6 to 10 dpi); **, P = 0.005 (11 dpi); **, P = 0.008 (12 dpi); **, P = 0.002 (13 dpi); **, P = 0.005 (14 dpi). For E1 viremia: **, P = 0.008 (1 dpi); *, P = 0.015 (2 dpi). For nsP1 viremia: *, P = 0.015 (2 dpi). (D) CNR20235 infection triggers less edema but more cellular infiltration than LR2006 OPY1 in mice. Histological analysis of CHIKV-inoculated joint footpad samples from mice by H&E staining at 3 and 6 dpi. Boxed regions are shown at the higher magnifications indicated on the right. *, Edema; B, bone; M, muscle; T, tendon. The images presented are representative of three mice per group from two independent experiments. (E and F) Representative images (E) and quantification of vascular leakiness in the inflamed joints (F) of LR2006 OPY1 (n = 5)- and CNR20235 (n = 5)-infected mice. The data were analyzed by a two-tailed Mann-Whitney U test (**, P = 0.0079 [3 dpi]; **, P = 0.0079 [6 dpi]). All representative images were taken after 2 s of exposure, and the yellow arrows in panel E indicate inflamed joints.
FIG 3
FIG 3
CNR20235 triggers a milder host inflammatory response than LR2006 OPY1 during the acute phase of disease. Three-week-old WT C57BL/6 female mice were infected with LR2006 OPY1 or CNR20235 at 106 TCID50 (n = minimum of 6 mice per group) by joint footpad inoculation. The serum levels of 12 immune mediators at 3, 6, and 15 dpi were quantified by using a microbead-based immunoassay. (A) Patterns of immune mediators shown by two-way hierarchical clustering. Each colored cell represents the relative levels of expression of a particular cytokine in a mouse. Green indicates low production, and red indicates high production. (B) Box-and-whisker plots of serum IFN-γ, TNF-α, IP-10, RANTES, sRANKL, Groα, MCP-1, IFN-α, and IL-6 levels in LR2006 OPY1- and CNR20235-infected mice at 3, 6, and 15 dpi (two-tailed Mann-Whitney U test). ***, P = 0.0001 (3 dpi, IFN-γ); ***, P = 0.0002 (3 dpi, TNF-α); *, P = 0.010 (3 dpi, IP-10); **, P = 0.006 (3 dpi, RANTES); *, P = 0.015 (3 dpi, sRANKL); *, P = 0.012 (3 dpi, GROα); ***, P = 0.0004 (3 dpi, MCP-1); *, P = 0.0008 (3 dpi, IFN-α); ***, P = 0.0008 (3 dpi, IL-6); ***, P = 0.0001 (6 dpi, IFN-γ); *, P = 0.021 (6 dpi, TNF-α); **, P = 0.007 (6 dpi, GROα); *, P = 0.030 (6 dpi, IL-6); **, P = 0.002 (15 dpi, GROα). ND, below detection limit.
FIG 4
FIG 4
Differential host immune response induced by LR2006 OPY1 and CNR20235 in the pLN. Three-week-old WT C57BL/6 female mice were infected with LR2006 OPY1 or CNR20235 at 106 TCID50 (n = minimum 6 mice per group) by joint footpad inoculation. (A) At 3 and 6 dpi, pLN was harvested, and the viral load was determined by qRT-PCR targeting for negative-sense nsP1 gene. The data are presented as the means ± the SD of two independent experiments (two-tailed Mann-Whitney U test). **, P = 0.002 (3 dpi). (B) Cells from the pLN were labeled for CD45, CD3, CD4, CD8, CD11b, Ly6G, and NK1.1. The absolute cell counts of each immune cell subset were calculated based on the total numbers of live cells determined before labeling. The data are presented as the means ± the SD of two independent experiments (two-tailed Mann-Whitney U test). *, P = 0.015 (3 dpi, total CD3+); **, P = 0.008 (6 dpi, total CD3+); *, P = 0.026 (3 dpi, CD3+ CD4+); *, P = 0.041 (3 dpi, CD3+ CD8+); *, P = 0.017 (6 dpi, CD3+ CD8+); **, P = 0.004 (6 dpi, NK1.1+). (C) Gene expression levels of granzyme B, T-bet, IP-10, IL-12p35, and iNOS in the pLN. The level of gene expression was expressed as the fold change compared to mock-infected mice (n = 6) after normalization to GAPDH (glyceraldehyde-3-phosphate dehydrogenase). The data are representative of two independent experiments and are presented as means ± the SD (two-tailed Mann-Whitney U test). **, P = 0.008 (3 dpi, granzyme B); *, P = 0.015 (6 dpi, granzyme B); **, P = 0.004 (3 dpi, IP-10); **, P = 0.002 (6 dpi, IP-10); **, P = 0.002 (3 dpi, IL-12p35); *, P = 0.015 (6 dpi, iNOS).
FIG 5
FIG 5
Differential host immune response induced by LR2006 OPY1 and CNR20235 in inflamed joint footpad. Three-week-old WT C57BL/6 female mice were infected with LR2006 OPY1 or CNR20235 at 106 TCID50 (n = minimum 6 mice per group) by joint footpad inoculation. (A) At 3 and 6 dpi, CHIKV-inoculated footpad was harvested, and the viral load was determined by qRT-PCR targeting for negative-sense nsP1 gene. The data are presented as means ± the SD of two independent experiments. Comparison at each time point was performed using a two-tailed Mann-Whitney U test. (B) Cells from each CHIKV-inoculated footpad were labeled for CD45, CD3, CD4, CD8, CD11b, Ly6G, Ly6C, and NK1.1. The absolute cell counts of each immune cell subset were calculated based on the total number of live cells determined before labeling. The data are presented as means ± the SD of two independent experiments (two-tailed Mann-Whitney U test). **, P = 0.004 (6 dpi, total CD3+); **, P = 0.004 (6 dpi, CD3+ CD4+); **, P = 0.015 (3 dpi, NK1.1+); **, P = 0.004 (6 dpi, CD11b+ Ly6C+ monocytes). (C) Gene expression level of granzyme B, T-bet, IP-10, IL-12p35, and iNOS in CHIKV-inoculated footpad. The level of gene expression was expressed as the fold change compared to mock-infected mice (n = 6) after normalization to GAPDH. The data are representative of two independent experiments and presented as means ± the SD (two-tailed Mann-Whitney U test). *, P = 0.026 (3 dpi, T-bet); *, P = 0.026 (6 dpi, T-bet); **, P = 0.004 (3 dpi, IP-10); *, P = 0.041 (3 dpi, IL-12p35).
FIG 6
FIG 6
Histological assessment of granzyme B expression in the pLN and joint footpads of LR2006 OPY1- and CNR20235-infected mice. Three-week-old WT C57BL/6 female mice were infected with LR2006 OPY1 or CNR20235 at 106 TCID50 (n = 3 mice per group) by joint footpad inoculation. Histological analysis of pLN and CHIKV-inoculated footpad by labeling with anti-granzyme B antibody at 3 and 6 dpi was performed. The images in the boxed regions were taken at ×200 magnification within the inset images, which were taken at ×100 magnification. Black arrowheads indicate positively stained cells. For the pLNs, the scale bars represent 30 and 50 μm for the main and inset images, respectively. For the footpads, the scale bars represent 50 and 100 μm for the main and inset images, respectively. The images presented are representative of three mice per group from two independent experiments. The mean granzyme B intensity in positively stained cells (n = 20) was quantified from photos taken at ×200 magnification using ImageJ and is presented as a histogram (two-tailed Mann Whitney U test). ***, P < 0.0001 (3 dpi, pLN); **, P = 0.0018 (6 dpi, footpad).
FIG 7
FIG 7
Early acute NK activation in LR2006 OPY1 mediates joint pathology. Three-week-old WT C57BL/6 female mice were infected with LR2006 OPY1 or CNR20235 at 106 TCID50 (n = minimum 5 mice per group) by joint footpad inoculation. (A and C) Mean fluorescence intensity (MFI) representing granzyme B expression in CD8 and NK cells in pLNs (A) and footpads (C) in CHIKV infection (two-tailed Mann-Whitney U test). *, P = 0.0476 (pLN, 3 dpi, CD8); *, P = 0.0317 (pLN, 3 dpi, NK); *, P = 0.0476 (footpad, 6 dpi, CD8). (B and D) Absolute counts of granzyme B+ CD8 and NK cells in pLNs (B) and footpads (D) in CHIKV infection (two-tailed Mann-Whitney U test). *, P = 0.0317 (pLN, 3 dpi, CD8); *, P = 0.0317 (pLN, 3 dpi, NK); *, P = 0.0317 (footpad, 6 dpi, CD8); *, P = 0.0317 (footpad, 6 dpi, NK). NK cells were depleted from mice using α-asialo-GM1 antibody, and equal amounts of rabbit serum were given for controls. (E) Disease scores at 3 and 6 dpi in CHIKV infection (two-tailed Mann-Whitney U test). **, P = 0.0079 (nsP1, day 6); ***, P < 0.0001 (disease score, day 6).
FIG 8
FIG 8
CHIKV-specific antibody induction during CNR20235 and LR2006 OPY1 infection. Three-week-old WT C57BL/6 female mice were infected with LR2006 OPY1 or CNR20235 at 106 TCID50 (n = 6 to 18 per group) by joint footpad inoculation. (A) The total CHIKV-specific IgM and IgG levels were determined from serum samples collected at 0, 3, 6, and 15 dpi at dilutions of 1:100 and 1:2,000, respectively, using purified CHIKV virion-based ELISA. Data were obtained from three independent experiments and are presented as the mean relative optical density at 450 nm (OD450) ± the SD after subtracting the background OD450 (two-tailed Mann-Whitney U test). ***, P = 0.0008 (3 dpi, IgM); ***, P = 0.0001 (6 dpi, IgM); **, P = 0.004 (15 dpi, IgM); ***, P = 0.0001 (6 dpi, IgG); **, P = 0.004 (15 dpi, IgG). (B) The levels of CHIKV-specific IgG1, IgG2b, IgG2c, and IgG3 were determined in pooled sera collected at 3, 6, and 15 dpi using a purified CHIKV virion-based ELISA. ND, below the detection limit. The antibody titer of each isotype was determined from the highest serum dilution with the same detection limit as naive mice (n = 6). (C) Ratio of IgG1 to IgG2c determined from CHIKV-specific antibody titer. An assay was performed in duplicate, and the results are presented as the mean from three independent experiments. (D) Neutralizing capacity of pooled sera collected at 3, 6, and 15 dpi. Pooled sera from three independent experiments (n = 6 to 18 per group) were diluted from 1:102 to 1:105 and mixed with CHIKV (MOI of 10) for 2 h before infection of HEK293T cells for 6 h. The assays were performed in quintuplicate, and data are expressed relative to samples infected with virus only without sera. The dotted line indicates the detection limit of the assay determined from mock-infected samples. Data are presented as means ± the SD.

References

    1. Weaver SC. 2006. Evolutionary influences in arboviral disease. Curr Top Microbiol Immunol 299:285–314. - PMC - PubMed
    1. Ng LC, Hapuarachchi HC. 2010. Tracing the path of Chikungunya virus–evolution and adaptation. Infect Genet Evol 10:876–885. doi:10.1016/j.meegid.2010.07.012. - DOI - PubMed
    1. Schwartz O, Albert ML. 2010. Biology and pathogenesis of Chikungunya virus. Nat Rev Microbiol 8:491–500. doi:10.1038/nrmicro2368. - DOI - PubMed
    1. Powers AM, Logue CH. 2007. Changing patterns of Chikungunya virus: re-emergence of a zoonotic arbovirus. J Gen Virol 88:2363–2377. doi:10.1099/vir.0.82858-0. - DOI - PubMed
    1. Sergon K, Njuguna C, Kalani R, Ofula V, Onyango C, Konongoi LS, Bedno S, Burke H, Dumilla AM, Konde J, Njenga MK, Sang R, Breiman RF. 2008. Seroprevalence of Chikungunya virus (CHIKV) infection on Lamu Island, Kenya, October 2004. Am J Trop Med Hyg 78:333–337. - PubMed

Publication types

MeSH terms