. 2015 Aug;89(15):7861-73.
doi: 10.1128/JVI.00794-15. Epub 2015 May 20.

Phosphatidylinositol-(4,5)-Bisphosphate Acyl Chains Differentiate Membrane Binding of HIV-1 Gag from That of the Phospholipase Cδ1 Pleckstrin Homology Domain

Affiliations

Phosphatidylinositol-(4,5)-Bisphosphate Acyl Chains Differentiate Membrane Binding of HIV-1 Gag from That of the Phospholipase Cδ1 Pleckstrin Homology Domain

Balaji Olety et al. J Virol. 2015 Aug.

Abstract

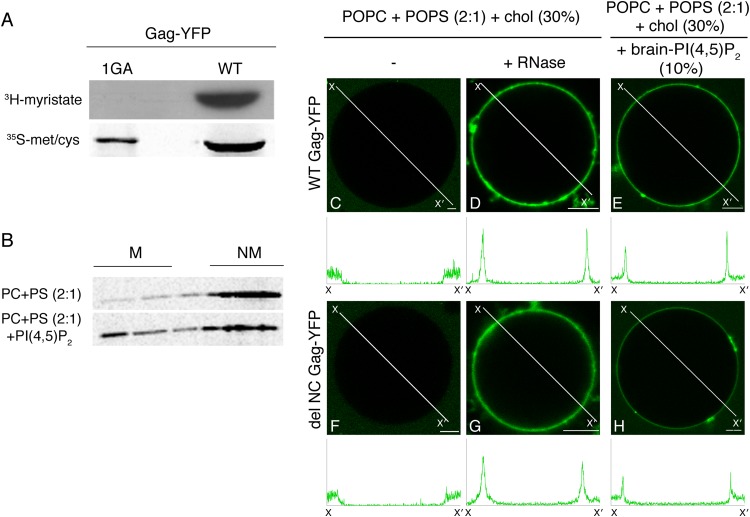
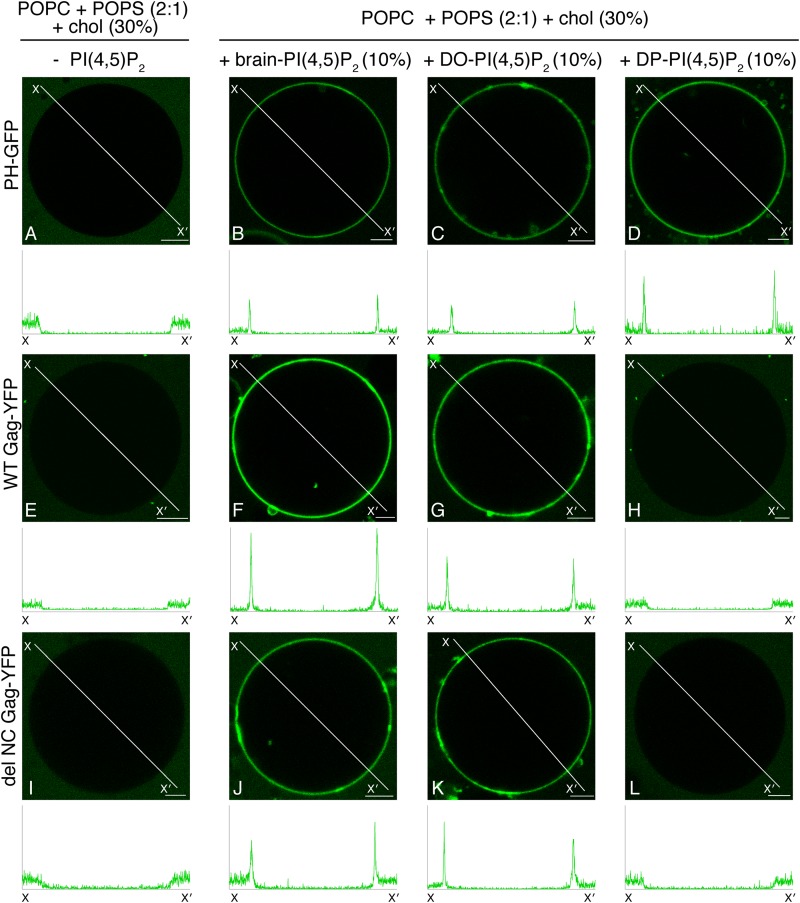
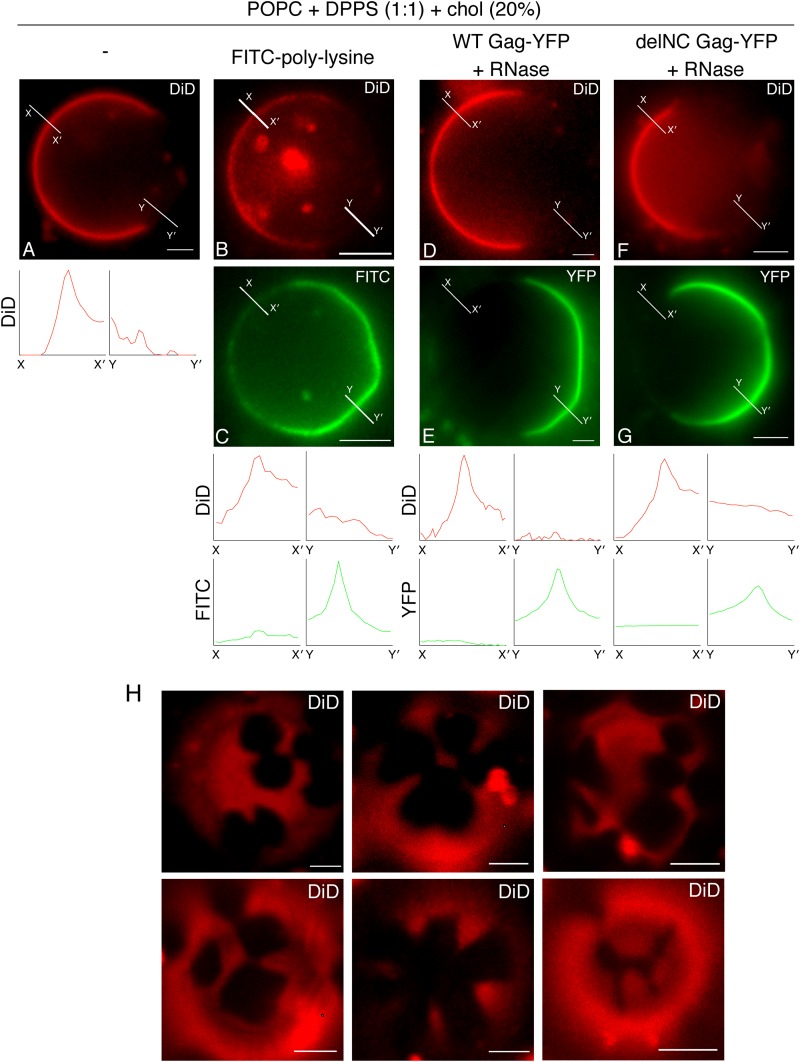
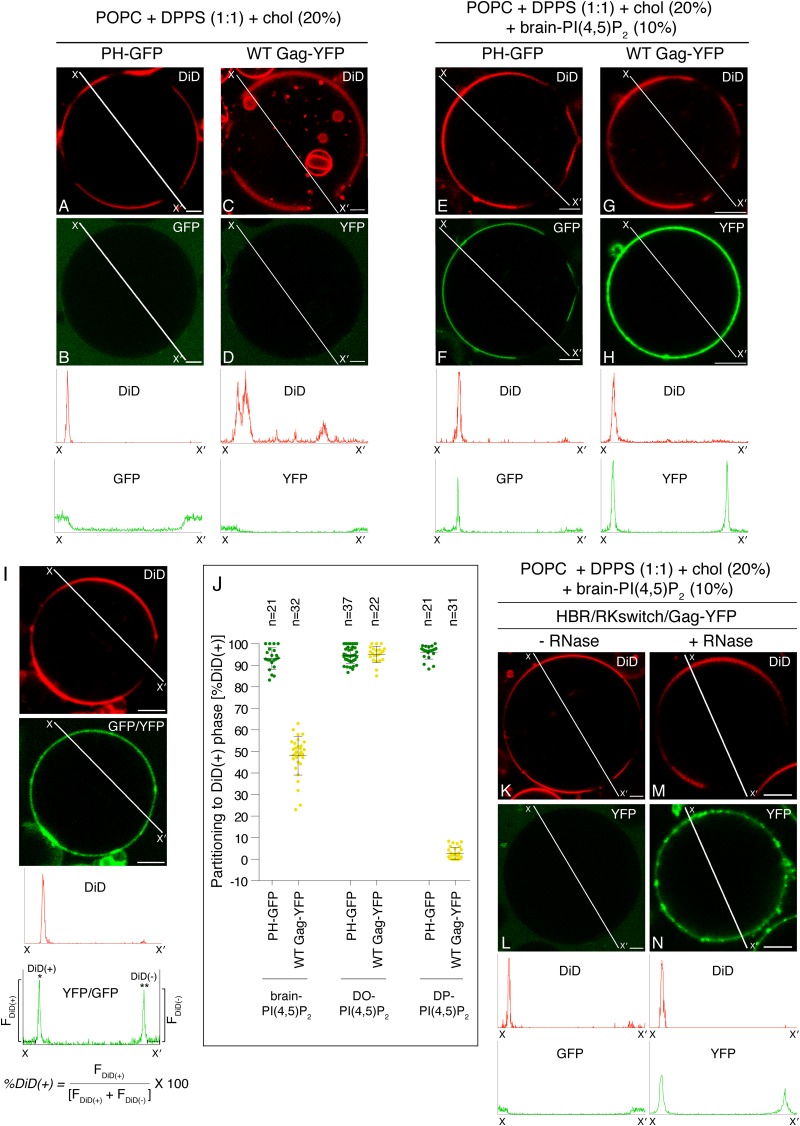
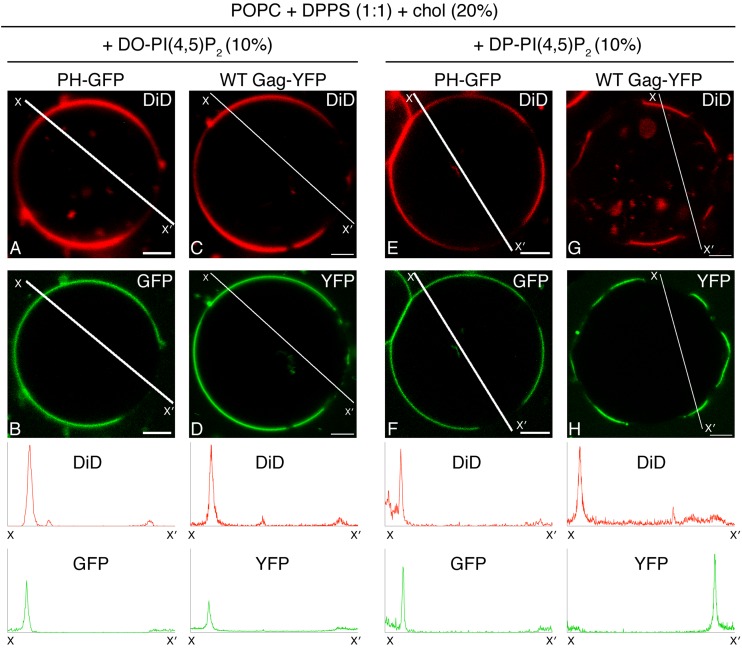
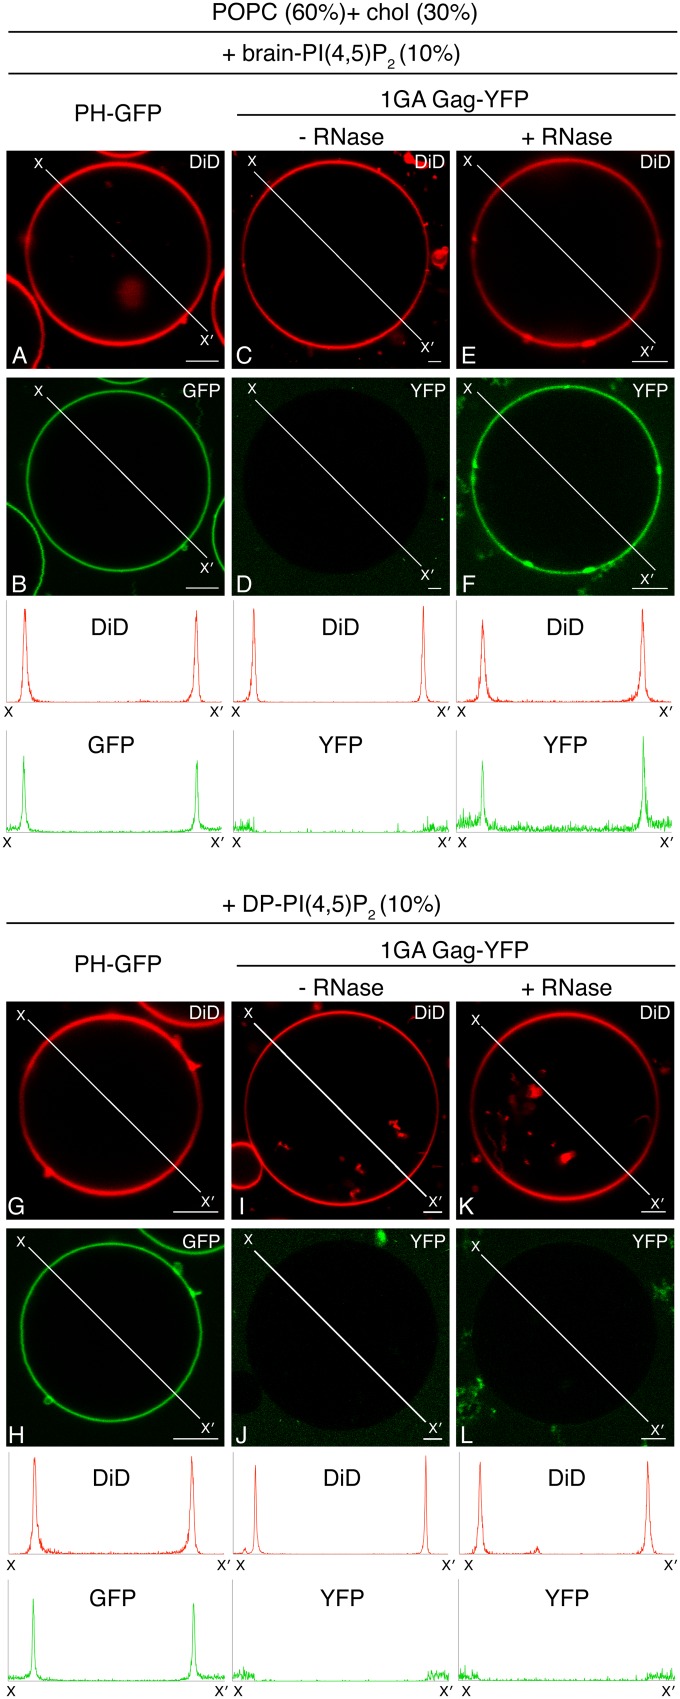
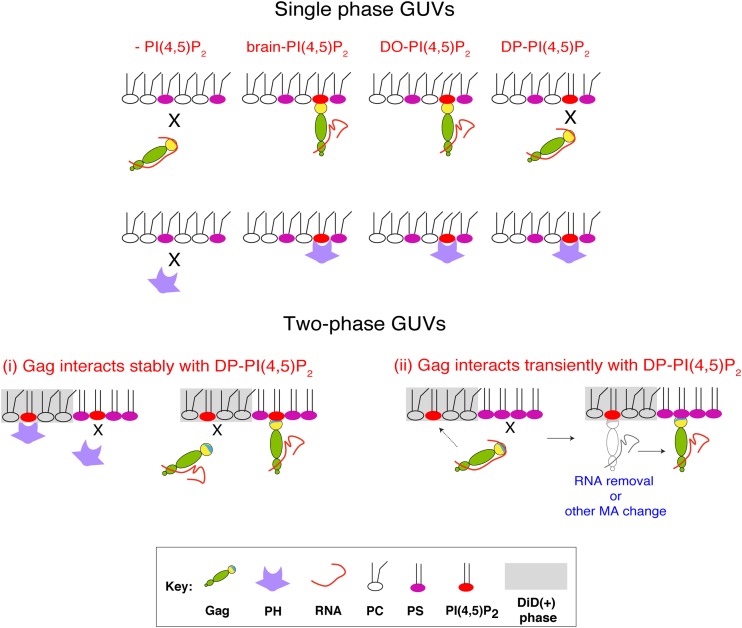
HIV-1 Gag, which drives virion assembly, interacts with a plasma membrane (PM)-specific phosphoinositide, phosphatidylinositol-(4,5)-bisphosphate [PI(4,5)P2]. While cellular acidic phospholipid-binding proteins/domains, such as the PI(4,5)P2-specific pleckstrin homology domain of phospholipase Cδ1 (PHPLCδ1), mediate headgroup-specific interactions with corresponding phospholipids, the exact nature of the Gag-PI(4,5)P2 interaction remains undetermined. In this study, we used giant unilamellar vesicles (GUVs) to examine how PI(4,5)P2 with unsaturated or saturated acyl chains affect membrane binding of PHPLCδ1 and Gag. Both unsaturated dioleoyl-PI(4,5)P2 [DO-PI(4,5)P2] and saturated dipalmitoyl-PI(4,5)P2 [DP-PI(4,5)P2] successfully recruited PHPLCδ1 to membranes of single-phase GUVs. In contrast, DO-PI(4,5)P2 but not DP-PI(4,5)P2 recruited Gag to GUVs, indicating that PI(4,5)P2 acyl chains contribute to stable membrane binding of Gag. GUVs containing PI(4,5)P2, cholesterol, and dipalmitoyl phosphatidylserine separated into two coexisting phases: one was a liquid phase, and the other appeared to be a phosphatidylserine-enriched gel phase. In these vesicles, the liquid phase recruited PHPLCδ1 regardless of PI(4,5)P2 acyl chains. Likewise, Gag bound to the liquid phase when PI(4,5)P2 had DO-acyl chains. DP-PI(4,5)P2-containing GUVs showed no detectable Gag binding to the liquid phase. Unexpectedly, however, DP-PI(4,5)P2 still promoted recruitment of Gag, but not PHPLCδ1, to the dipalmitoyl-phosphatidylserine-enriched gel phase of these GUVs. Altogether, these results revealed different roles for PI(4,5)P2 acyl chains in membrane binding of two PI(4,5)P2-binding proteins, Gag and PHPLCδ1. Notably, we observed that nonmyristylated Gag retains the preference for PI(4,5)P2 containing an unsaturated acyl chain over DP-PI(4,5)P2, suggesting that Gag sensitivity to PI(4,5)P2 acyl chain saturation is determined directly by the matrix-PI(4,5)P2 interaction, rather than indirectly by a myristate-dependent mechanism.

Importance: Binding of HIV-1 Gag to the plasma membrane is promoted by its interaction with a plasma membrane-localized phospholipid, PI(4,5)P2. Many cellular proteins are also recruited to the plasma membrane via PI(4,5)P2-interacting domains represented by PHPLCδ1. However, differences and/or similarities between these host proteins and viral Gag protein in the nature of their PI(4,5)P2 interactions, especially in the context of membrane binding, remain to be determined. Using a novel giant unilamellar vesicle-based system, we found that PI(4,5)P2 with an unsaturated acyl chain recruited PHPLCδ1 and Gag similarly, whereas PI(4,5)P2 with saturated acyl chains either recruited PHPLCδ1 but not Gag or sorted these proteins to different phases of vesicles. To our knowledge, this is the first study to show that PI(4,5)P2 acyl chains differentially modulate membrane binding of PI(4,5)P2-binding proteins. Since Gag membrane binding is essential for progeny virion production, the PI(4,5)P2 acyl chain property may serve as a potential target for anti-HIV therapeutic strategies.


Figures

FIG 1
FIG 1
Either RNA removal or the presence of PI(4,5)P2 in membranes promotes binding of Gag to POPS-based GUVs. (A) Myristoylation of WT and 1GA Gag-YFP synthesized in vitro using wheat germ lysate was examined as described in Materials and Methods. (B) Liposome-binding assays were performed to confirm that WT Gag-YFP synthesized in wheat germ lysates binds liposomes in a PI(4,5)P2-dependent manner, as has been observed for Gag synthesized in rabbit reticulocyte lysates. Wheat germ lysates containing WT Gag-YFP were mixed with liposomes of the indicated compositions, and membrane-bound (M) and non-membrane-bound (NM) proteins were fractionated by sucrose gradient flotation centrifugation performed as described in Materials and Methods. Following centrifugation, a total of five fractions were collected from the top of the gradient, and the proteins were separated by SDS-PAGE followed by phosphorimager analysis. (C to H) Wheat germ lysates containing either WT Gag-YFP (C to E) or delNC Gag-YFP (F to H) were mixed with GUVs composed of the indicated sets of lipids. Lipid ratios used were as follows: POPC:POPS:chol, 46.6:23.3:30 (C, D, F, and G); POPC:POPS:chol:PI(4,5)P2, 40:20:30:10 (E and H). Images were acquired using a confocal microscope. Binding of WT Gag-YFP (C and D) or delNC Gag-YFP (F and G) to POPC+POPS+chol GUVs was examined without (C and F) or with addition of RNase (final concentration, 10 μg/μl) (D and G). Binding of either WT Gag-YFP (E) or delNC Gag-YFP (H) to POPC+POPS+chol+brain-PI(4,5)P2 GUVs was examined as described above. Representative images from at least 3 independent experiments are shown. Fluorescence intensity profiles along the lines drawn to cross over opposite sides of GUVs (X to X′) are shown below the images. Bar, 5 μm.
FIG 2
FIG 2
Brain-PI(4,5)P2 and DO-PI(4,5)P2, but not DP-PI(4,5)P2, promote stable binding of Gag to POPS-based GUVs. Binding of either PH-GFP (A to D), WT Gag-YFP (E to H), or delNC Gag-YFP (I to L) to GUVs containing no PI(4,5)P2 (A, E, and I), brain-PI(4,5)P2 (B, F, and J), DO-PI(4,5)P2 (C, G, and K), or DP-PI(4,5)P2 (D, H, and L) was examined in the context of POPC+POPS+chol GUVs, as in Fig. 1. Lipid ratios used were as follows: POPC:POPS:chol, 46.6:23.3:30 (A, E, and I); POPC:POPS:chol:PI(4,5)P2, 40:20:30:10 (B to D, F, G, and J to L). Representative images from at least 3 independent experiments are shown. Fluorescence intensity profiles along the lines drawn to cross over opposite sides of GUVs (X to X′) are shown below images. PH-GFP and WT and delNC Gag-YFP were imaged using the same confocal microscopy settings, and their line profiles are shown on the same y axis scale. Bar, 5 μm.
FIG 3
FIG 3
In the absence of PI(4,5)P2, Gag binds to the DPPS-enriched DiD(−) phase after RNase treatment. (A) An example of an epifluorescence image of POPC+DPPS+chol+DiD GUVs containing DiD(+) and DiD(−) phases. (C) Binding of FITC-polylysine to POPC+DPPS+chol GUVs. (E and G) Binding of either WT Gag-YFP (E) or delNC Gag-YFP (G) to POPC+DPPS+chol GUVs was examined after RNase treatment. (B, D, and F) Corresponding images of DiD. The lipid ratio used was as follows: POPC:DPPS:chol, 40:40:20. Representative images from at least 3 independent experiments are shown. Fluorescence intensity profiles of DiD (red) and FITC or YFP (green) along the short lines drawn to cross over DiD(+) (X to X′) and DiD(−) (Y to Y′) regions of GUVs are shown below the images. (H) Six examples of confocal images of the top surface of POPC+DPPS+chol GUVs (POPC:DPPS:chol, 40:40:20) containing DiD are shown. Note that these two-phase GUVs displayed irregularly shaped DiD(−) phases. Bar, 5 μm.
FIG 4
FIG 4
Gag-YFP and PH-GFP distribute differently in DPPS-containing two-phase GUVs in the presence of brain-PI(4,5)P2. (A to H) POPC+DPPS+chol (A to D) and POPC+DPPS+chol+brain-PI(4,5)P2 (E to H) GUVs were examined for binding of PH-GFP (B and F) and WT Gag-YFP (D and H) by using confocal microscopy. PH-GFP and WT Gag-YFP were imaged using the same microscopy settings. Corresponding images of DiD are shown in panels A, C, E, and G. Representative images from at least 3 independent experiments are shown. Fluorescence intensity profiles of PH-GFP and Gag-YFP along the lines drawn to cross over DiD(+) and DiD(−) sides of GUVs (X to X′) are shown below the images in the same y axis scale. (I) The method for calculating partitioning of GFP or YFP signals to the DiD(+) phase is illustrated. Examples of confocal images of DiD and GFP or YFP (Gag-YFP in this example) associated with a two-phase GUV [containing brain-PI(4,5)P2 in this example] are shown in the top two panels. The intensity profiles of DiD (red) and GFP/YFP (green) along the line crossing DiD(+) and DiD(−) phases (X to X′) are shown below the images. Average intensity values along the 3-μm segments of the line outside the DiD(+) and DiD(−) phases (indicated by short broken lines on the intensity profile plot) were subtracted from DiD(+) (*) and DiD(−) (**) peak intensity values to obtain FDiD(+) and FDiD(−), respectively. These values were used to calculate partitioning to the DiD(+) phase [%DiD(+)] using the relation shown below the profile plot. (J) Partitioning of PH-GFP (green) or WT Gag-YFP (yellow) to the DiD(+) phase in POPC+DPPS+chol GUVs containing brain-, DO-, or DP-PI(4,5)P2 were quantified for each GUV as described in Materials and Methods and for panel I. Means ± standard deviations are also shown. n, the number of GUVs analyzed under each condition. (K to N) Binding of the HBR/RKswitch Gag-YFP to POPC+DPPS+chol+brain-PI(4,5)P2 GUVs was examined without (L) or with (N) RNase treatment. Corresponding images of DiD are shown in panels K and M. Representative images from at least 3 independent experiments are shown. Fluorescent intensity profiles of DiD (red) and Gag-YFP (green) along the lines drawn as described above are shown below the images. Bar, 5 μm. Lipid ratios used were as follows: POPC:DPPS:chol, 40:40:20 (A to D); POPC:DPPS:chol:PI(4,5)P2, 35:35:20:10 (E to H and K to N).
FIG 5
FIG 5
DP-PI(4,5)P2, but not DO-PI(4,5)P2, directs PH-GFP and WT Gag-YFP to different phases in two-phase GUVs. Binding of PH-GFP (B and F) and WT Gag-YFP (D and H) to POPC+DPPS+chol+DO-PI(4,5)P2 (A to D) and POPC+DPPS+chol-DP+DP-PI(4,5)P2 (E to H) GUVs was examined using confocal microscopy. PH-GFP and WT Gag-YFP were imaged using the same microscopy settings. (A, C, E, and G) Corresponding images of DiD. Representative images from at least 3 independent experiments are shown. Fluorescence intensity profiles of DiD (red) and PH-GFP or Gag-YFP (green) along the lines drawn to cross over DiD(+) and DiD(−) sides of GUVs (X to X′) are shown below the images. The intensity profiles for PH-GFP and Gag-YFP are shown on the same y axis scale. Partitioning of PH-GFP and WT Gag-YFP to the DiD(+) phase in POPC+DPPS+chol GUVs containing either DO or DP PI(4,5)P2 was quantified, and the results were included in Fig. 4J. Bar, 5 μm. The lipid ratio used was as follows: POPC:DPPS:chol:PI(4,5)P2, 35:35:20:10.
FIG 6
FIG 6
RNase-treated 1GA Gag-YFP binds to GUVs containing brain-PI(4,5)P2 but not DP-PI(4,5)P2 as a sole acidic lipid. Binding of PH-GFP (B and H), 1GA Gag-YFP (D and J), and RNase-treated 1GA Gag-YFP (F and L) to either POPC+chol+brain-PI(4,5)P2 (B, D, and F) or POPC+chol+DP-PI(4,5)P2 (H, J, and L) GUVs were examined using confocal microscopy. PH-GFP and 1GA Gag-YFP were imaged using the same microscopy settings. Corresponding images of DiD are shown in panels A, C, E, G, I, and K. Representative images from at least 3 independent experiments are shown. Fluorescence intensity profiles of DiD (red) and PH-GFP or Gag-YFP (green) along the lines drawn to cross over opposite sides of GUVs (X to X′) are shown below. The intensity profiles for PH-GFP and Gag-YFP are shown on the same y axis scale. The lipid ratio used was as follows: POPC:chol:PI(4,5)P2, 60:30:10. Bar, 5 μm.
FIG 7
FIG 7
Acyl chains of PI(4,5)P2 differentially affect membrane binding of Gag and PH-GFP. Schematic representation of Gag and PH-GFP binding to single-phase GUVs (top) and two-phase GUVs (bottom) with different acyl chain variants of PI(4,5)P2 are illustrated. In the bottom panel, two mutually nonexclusive potential mechanisms by which DP-PI(4,5)P2 mediates membrane binding of Gag in two-phase GUVs are depicted. For mechanism i, DP-PI(4,5)P2 in the DiD(−) phase supports stable membrane binding of Gag but not PH-GFP. Conversely, DP-PI(4,5)P2 in the DiD(+) phase supports stable membrane binding of PH-GFP but not Gag. For mechanism ii, DP-PI(4,5)P2 interacts with Gag only transiently, which enables Gag to bind DPPS in the DiD(−) phase. While not depicted, the same process can take place when DP-PI(4,5)P2 is also in the DiD(−) phase. Again, DP-PI(4,5)P2 in the DiD(+) phase, but not in the DiD(−) phase, supports stable binding of PH-GFP (not depicted).

Similar articles

Cited by

References

    1. Lemmon MA. 2008. Membrane recognition by phospholipid-binding domains. Nat Rev Mol Cell Biol 9:99–111. doi:10.1038/nrm2328. - DOI - PubMed
    1. Ono A, Ablan SD, Lockett SJ, Nagashima K, Freed EO. 2004. Phosphatidylinositol (4,5) bisphosphate regulates HIV-1 Gag targeting to the plasma membrane. Proc Natl Acad Sci U S A 101:14889–14894. doi:10.1073/pnas.0405596101. - DOI - PMC - PubMed
    1. Chukkapalli V, Hogue IB, Boyko V, Hu WS, Ono A. 2008. Interaction between the human immunodeficiency virus type 1 Gag matrix domain and phosphatidylinositol-(4,5)-bisphosphate is essential for efficient gag membrane binding. J Virol 82:2405–2417. doi:10.1128/JVI.01614-07. - DOI - PMC - PubMed
    1. Saad JS, Miller J, Tai J, Kim A, Ghanam RH, Summers MF. 2006. Structural basis for targeting HIV-1 Gag proteins to the plasma membrane for virus assembly. Proc Natl Acad Sci U S A 103:11364–11369. doi:10.1073/pnas.0602818103. - DOI - PMC - PubMed
    1. Shkriabai N, Datta SA, Zhao Z, Hess S, Rein A, Kvaratskhelia M. 2006. Interactions of HIV-1 Gag with assembly cofactors. Biochemistry 45:4077–4083. doi:10.1021/bi052308e. - DOI - PubMed

Publication types

MeSH terms

Substances