

Repeated Low-Dose Influenza Virus Infection Causes Severe Disease in Mice: a Model for Vaccine Evaluation
- PMID: 25995265
- PMCID: PMC4505666
- DOI: 10.1128/JVI.00976-15
Repeated Low-Dose Influenza Virus Infection Causes Severe Disease in Mice: a Model for Vaccine Evaluation
Abstract
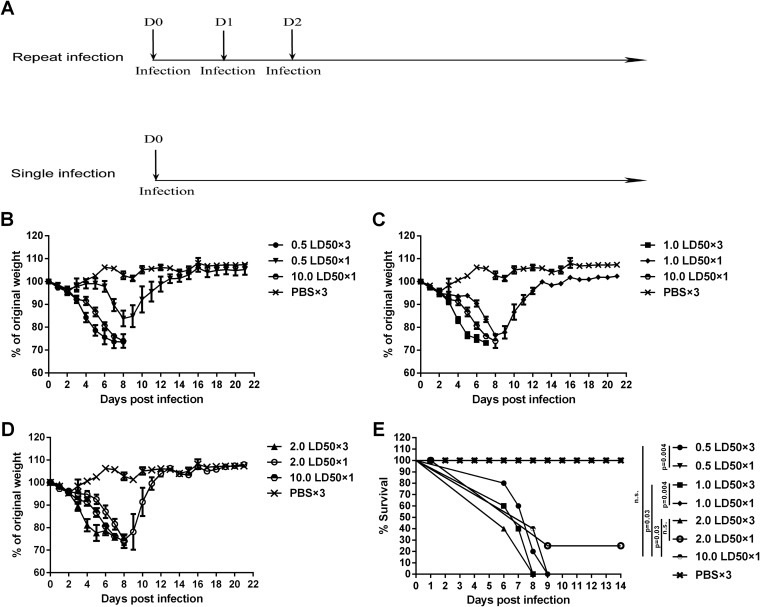
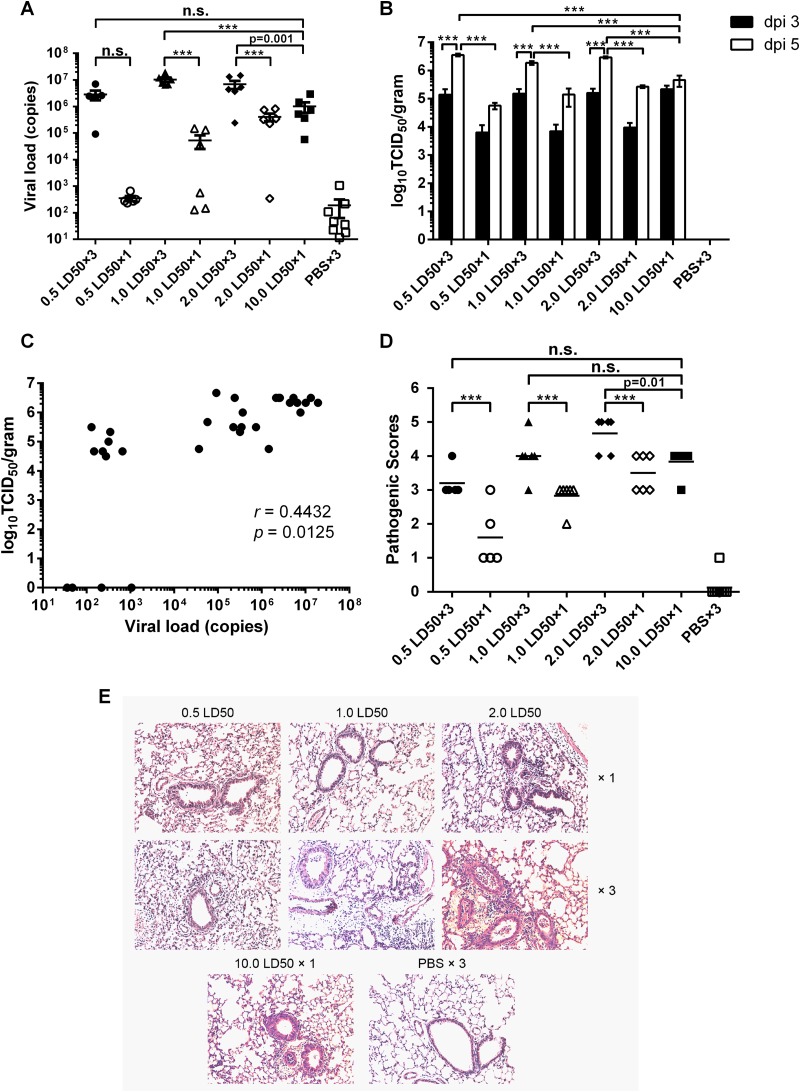
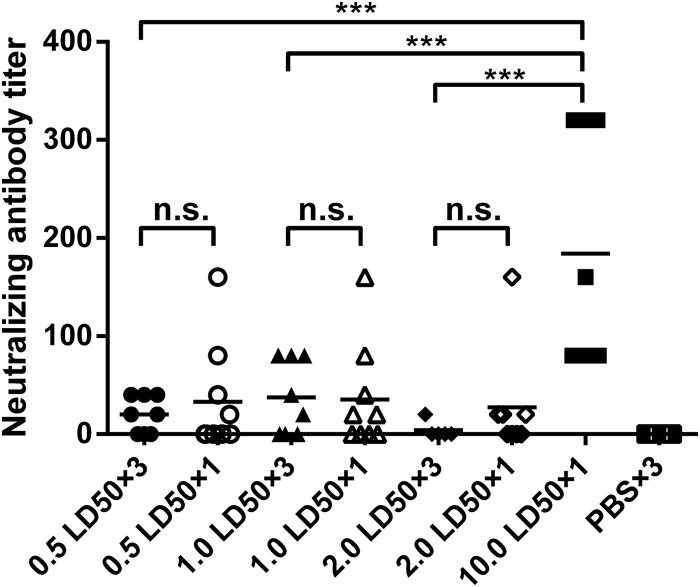
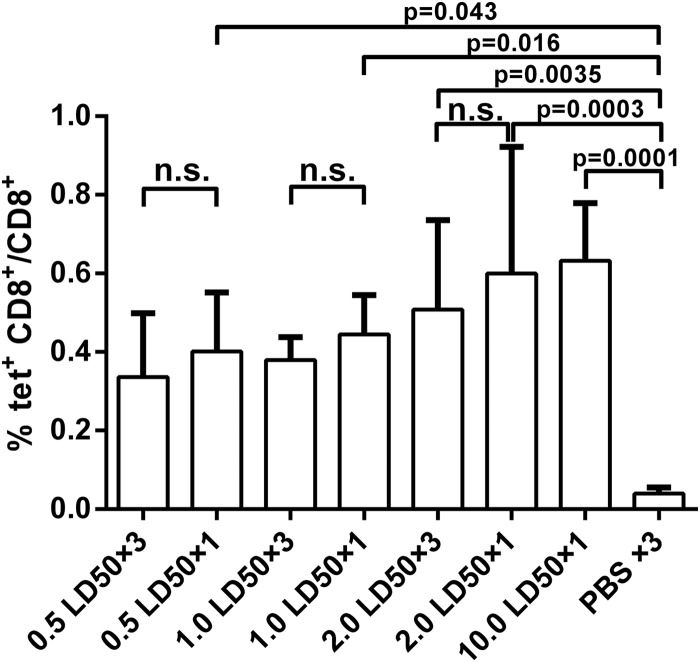
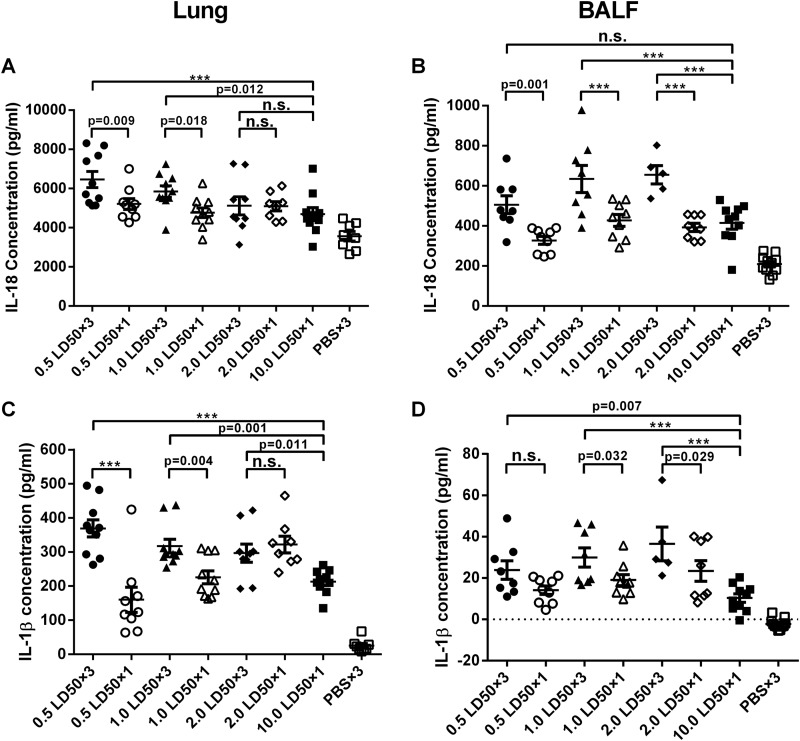
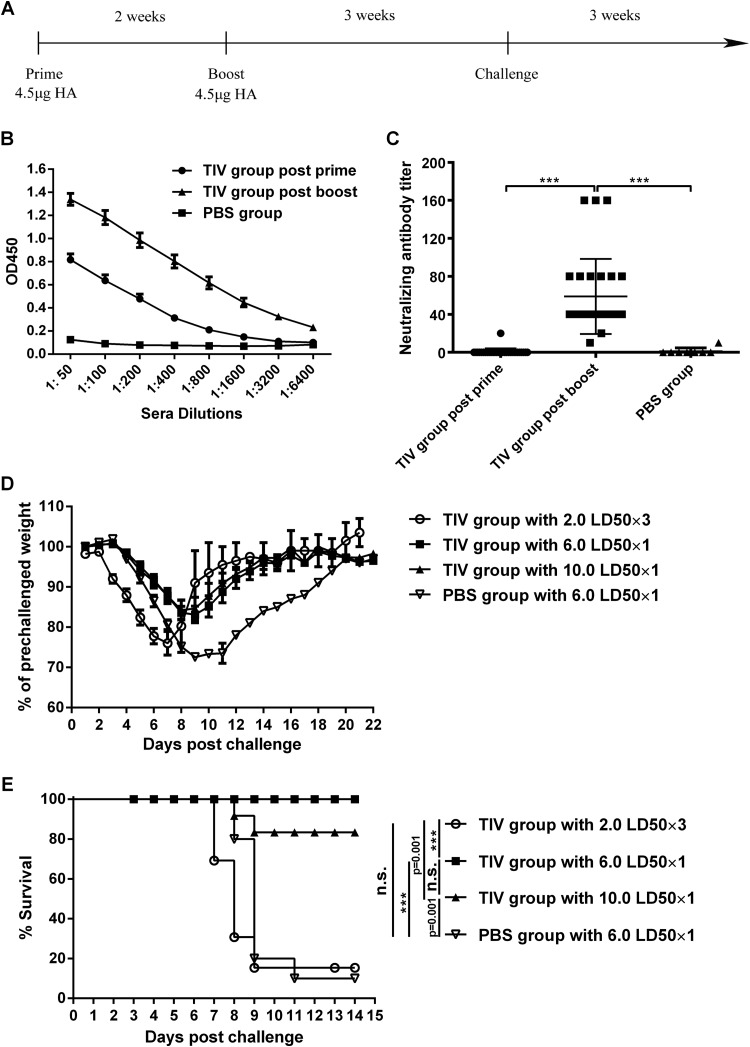
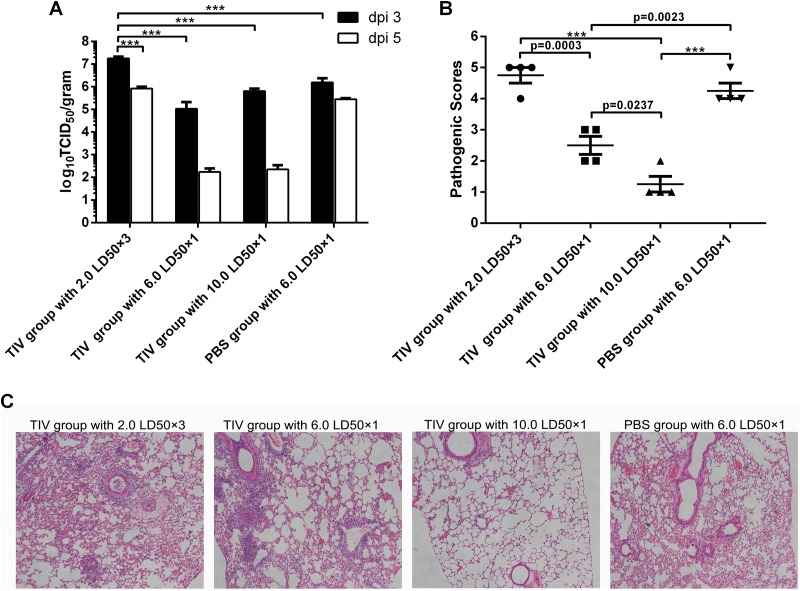
Influenza infection causes severe disease and death in humans. In traditional vaccine research and development, a single high-dose virus challenge of animals is used to evaluate vaccine efficacy. This type of challenge model may have limitations. In the present study, we developed a novel challenge model by infecting mice repeatedly in short intervals with low doses of influenza A virus. Our results show that compared to a single high-dose infection, mice that received repeated low-dose challenges showed earlier morbidity and mortality and more severe disease. They developed higher vial loads, more severe lung pathology, and greater inflammatory responses and generated only limited influenza A virus-specific B and T cell responses. A commercial trivalent influenza vaccine protected mice against a single high and lethal dose of influenza A virus but was ineffective against repeated low-dose virus challenges. Overall, our data show that the repeated low-dose influenza A virus infection mouse model is more stringent and may thus be more suitable to select for highly efficacious influenza vaccines.
Importance: Influenza epidemics and pandemics pose serious threats to public health. Animal models are crucial for evaluating the efficacy of influenza vaccines. Traditional models based on a single high-dose virus challenge may have limitations. Here, we describe a new mouse model based on repeated low-dose influenza A virus challenges given within a short period. Repeated low-dose challenges caused more severe disease in mice, associated with higher viral loads and increased lung inflammation and reduced influenza A virus-specific B and T cell responses. A commercial influenza vaccine that was shown to protect mice from high-dose challenge was ineffective against repeated low-dose challenges. Overall, our results show that the low-dose repeated-challenge model is more stringent and may therefore be better suited for preclinical vaccine efficacy studies.
Copyright © 2015, American Society for Microbiology. All Rights Reserved.
Figures
Similar articles
-
Broadly protective immunity against divergent influenza viruses by oral co-administration of Lactococcus lactis expressing nucleoprotein adjuvanted with cholera toxin B subunit in mice.Microb Cell Fact. 2015 Aug 5;14:111. doi: 10.1186/s12934-015-0287-4. Microb Cell Fact. 2015. PMID: 26242406 Free PMC article.
-
Protective efficacy of an H1N1 cold-adapted live vaccine against the 2009 pandemic H1N1, seasonal H1N1, and H5N1 influenza viruses in mice.Antiviral Res. 2012 Mar;93(3):346-53. doi: 10.1016/j.antiviral.2012.01.001. Epub 2012 Jan 18. Antiviral Res. 2012. PMID: 22281419
-
Generation and evaluation of the trivalent inactivated reassortant vaccine using human, avian, and swine influenza A viruses.Vaccine. 2008 Jun 2;26(23):2912-8. doi: 10.1016/j.vaccine.2008.03.048. Epub 2008 Apr 11. Vaccine. 2008. PMID: 18448208
-
Impact of Obesity on Influenza A Virus Pathogenesis, Immune Response, and Evolution.Front Immunol. 2019 May 10;10:1071. doi: 10.3389/fimmu.2019.01071. eCollection 2019. Front Immunol. 2019. PMID: 31134099 Free PMC article. Review.
-
From virus to inflammation, how influenza promotes lung damage.J Leukoc Biol. 2021 Jul;110(1):115-122. doi: 10.1002/JLB.4RU0820-232R. Epub 2020 Sep 8. J Leukoc Biol. 2021. PMID: 32895987 Free PMC article. Review.
Cited by
-
Host Responses to Pathogen Priming in a Natural Songbird Host.Ecohealth. 2017 Dec;14(4):793-804. doi: 10.1007/s10393-017-1261-x. Epub 2017 Aug 1. Ecohealth. 2017. PMID: 28766063 Free PMC article.
-
One HA stalk topping multiple heads as a novel influenza vaccine.Emerg Microbes Infect. 2024 Dec;13(1):2290838. doi: 10.1080/22221751.2023.2290838. Epub 2024 Jan 22. Emerg Microbes Infect. 2024. PMID: 38044872 Free PMC article.
-
N-terminal Myristoylation Enhanced the Antimicrobial Activity of Antimicrobial Peptide PMAP-36PW.Front Cell Infect Microbiol. 2020 Aug 27;10:450. doi: 10.3389/fcimb.2020.00450. eCollection 2020. Front Cell Infect Microbiol. 2020. PMID: 32984074 Free PMC article.
-
[Position Paper of the German Respiratory Society (DGP) on the Impact of Community Masks on Self-Protection and Protection of Others in Regard to Aerogen Transmitted Diseases].Pneumologie. 2020 Jun;74(6):331-336. doi: 10.1055/a-1175-8578. Epub 2020 May 20. Pneumologie. 2020. PMID: 32434252 Free PMC article. German. No abstract available.
-
LRCH1 deficiency enhances LAT signalosome formation and CD8+ T cell responses against tumors and pathogens.Proc Natl Acad Sci U S A. 2020 Aug 11;117(32):19388-19398. doi: 10.1073/pnas.2000970117. Epub 2020 Jul 29. Proc Natl Acad Sci U S A. 2020. PMID: 32727906 Free PMC article.
References
Publication types
MeSH terms
Substances
LinkOut - more resources
Full Text Sources
Medical
