. 2015 Jul;114(1):662-76.
doi: 10.1152/jn.00144.2015. Epub 2015 May 20.

A hard-wired priority map in the superior colliculus shaped by asymmetric inhibitory circuitry

Affiliations

A hard-wired priority map in the superior colliculus shaped by asymmetric inhibitory circuitry

Peter O Bayguinov et al. J Neurophysiol. 2015 Jul.

Abstract

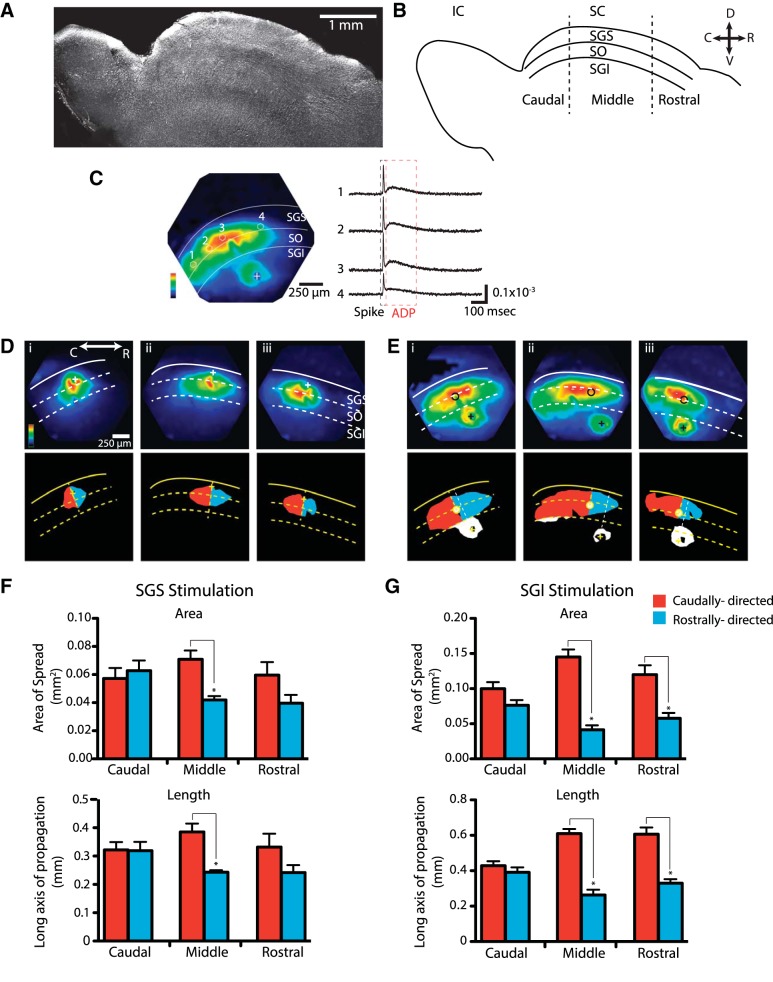
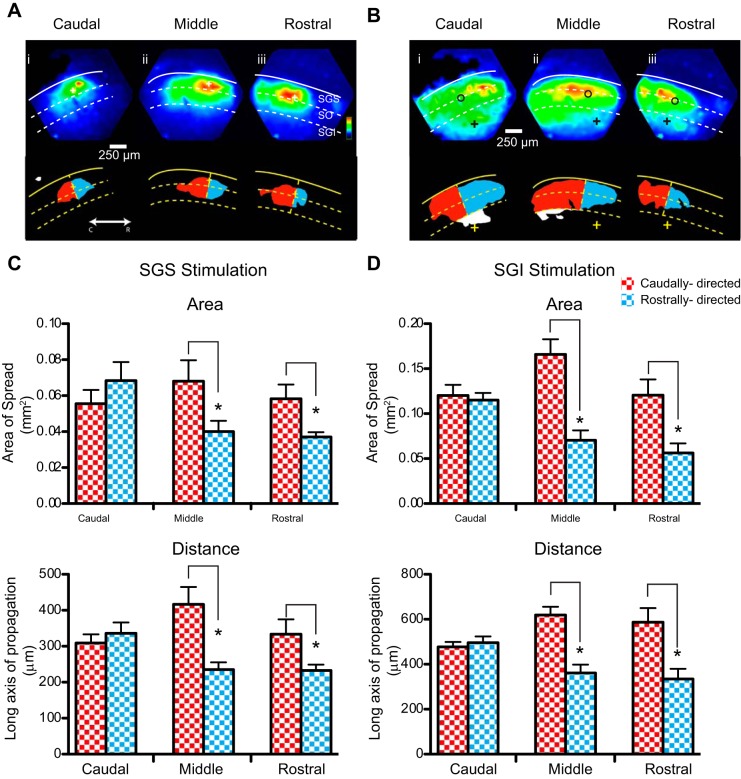
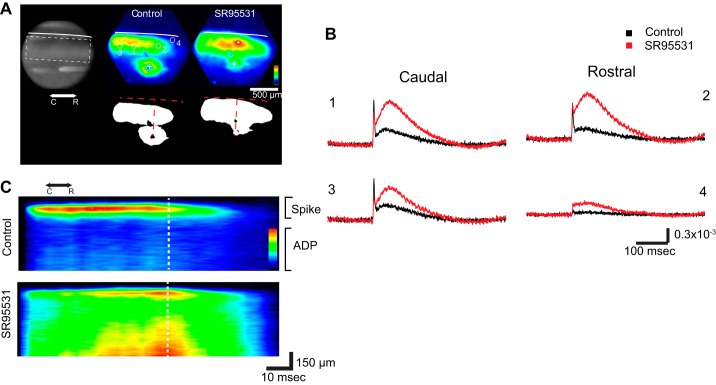
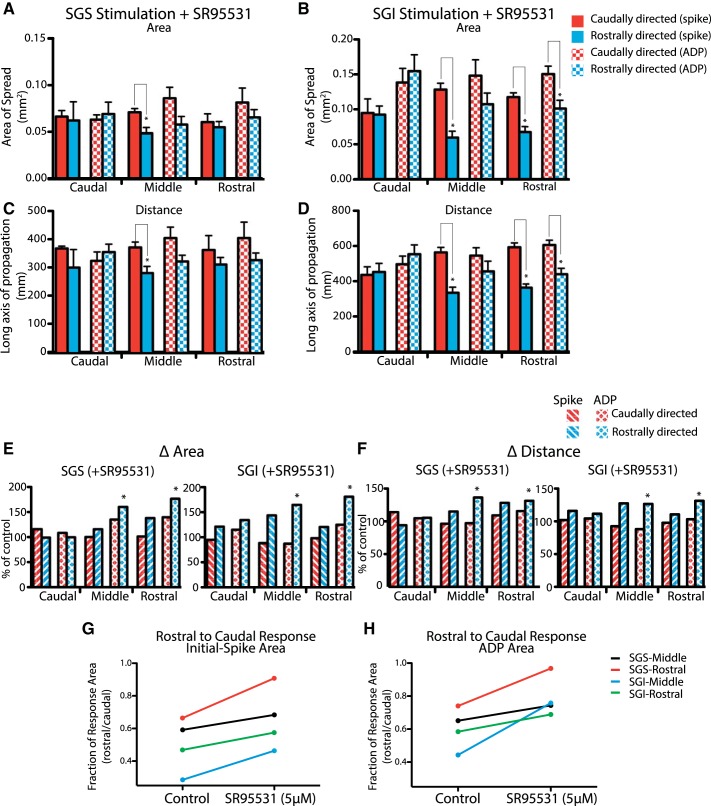
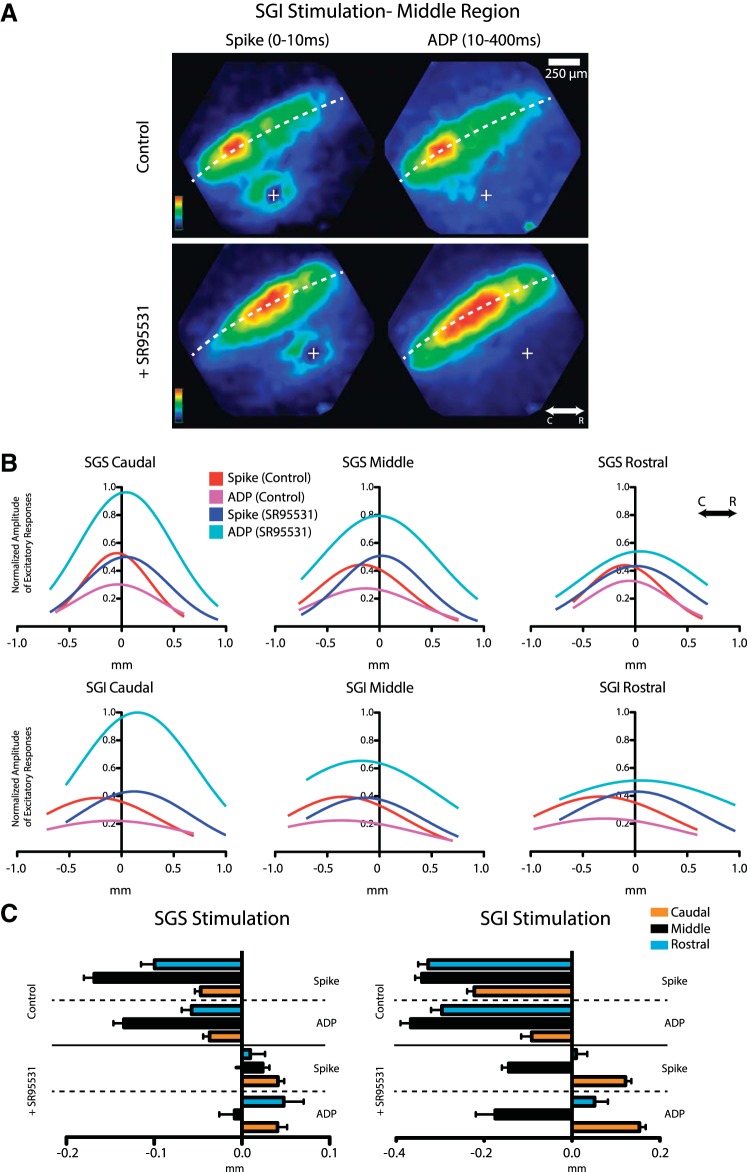
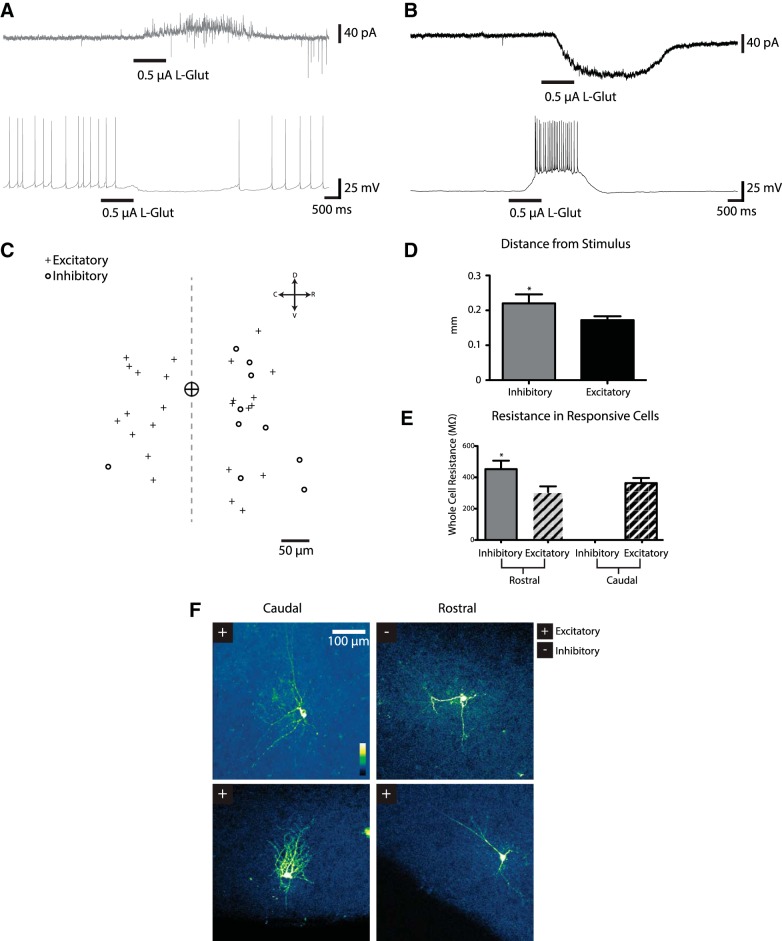
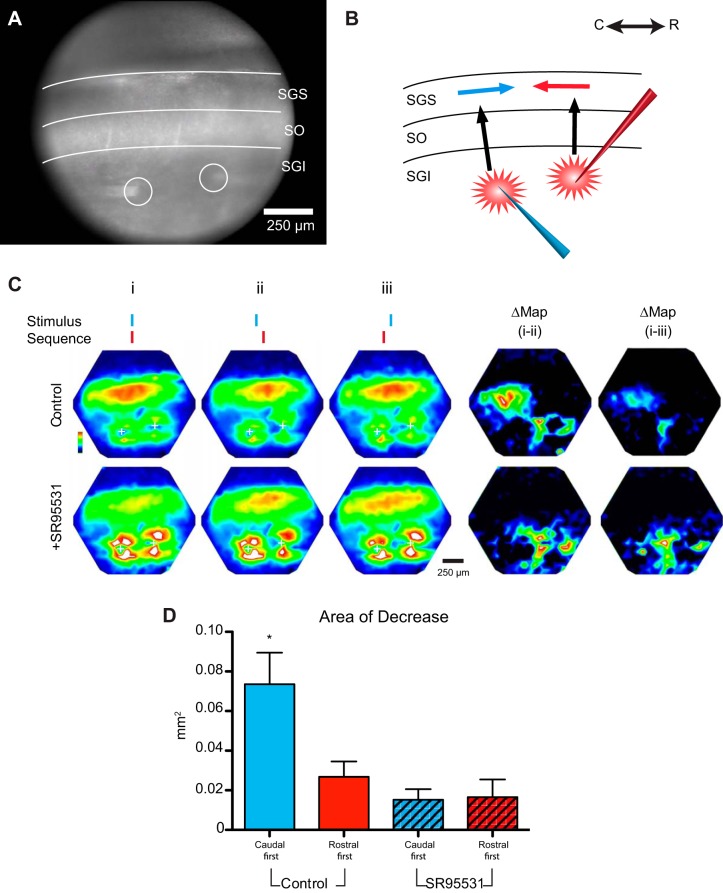
The mammalian superior colliculus (SC) is a laminar midbrain structure that translates visual signals into commands to shift the focus of attention and gaze. The SC plays an integral role in selecting targets and ultimately generating rapid eye movements to those targets. In all mammals studied to date, neurons in the SC are arranged topographically such that the location of visual stimuli and the endpoints of orienting movements form organized maps in superficial and deeper layers, respectively. The organization of these maps is thought to underlie attentional priority by assessing which regions of the visual field contain behaviorally relevant information. Using voltage imaging and patch-clamp recordings in parasagittal SC slices from the rat, we found the synaptic circuitry of the visuosensory map in the SC imposes a strong bias. Voltage imaging of responses to electrical stimulation revealed more spread in the caudal direction than the rostral direction. Pharmacological experiments demonstrated that this asymmetry arises from GABAA receptor activation rostral to the site of stimulation. Patch-clamp recordings confirmed this rostrally directed inhibitory circuit and showed that it is contained within the visuosensory layers of the SC. Stimulation of two sites showed that initial stimulation of a caudal site can take priority over subsequent stimulation of a rostral site. Taken together, our data indicate that the circuitry of the visuosensory SC is hard-wired to give higher priority to more peripheral targets, and this property is conferred by a uniquely structured, dedicated inhibitory circuit.

Keywords: electrophysiology; eye movements; motor layers; rat; rodent brain slice; superficial layers; vision; visual spatial attention; voltage imaging.


Figures

Fig. 1.
Fig. 1.
Asymmetric spread of responses in parasagittal superior colliculus (SC) slices. A: low-magnification gradient-contrast micrograph of a rat parasagittal slice. B: schematic of a parasagittal slice shows the caudal (C), middle, and rostral (R) subdivisions of the SC highlighted here, separated by dashed lines. Layers of the SC are demarcated and labeled as: SGS, stratum griseum superficiale; SO, stratum opticum; SGI, stratum griseum intermediale; and IC, inferior colliculus. The SO and SGS constitute the visuosensory layers. D, dorsal; V, ventral. C, left: maximal amplitude map of voltage imaging responses evoked by electrical stimulation in the SGI. Response amplitude was normalized to the maximum in the field of view and scaled to 1 according to the color bar in the lower left corner. “+” Indicates the site of stimulation. Right: traces from individual photodiodes, as labeled on the map, reveal the 2-component response, an initial spike (black dashed box) and a subsequent afterdepolarization (ADP; red dashed box). D: maps from voltage imaging of responses evoked by electrical stimulation of the SGS at caudal (i), middle (ii), and rostral (iii) locations (see B). Maps were normalized as described in C. Outline images below were created using a threshold of 50%. Yellow dashed lines perpendicular to the dorsal surface through the site of stimulation (indicated with a +) subdivided the slice as rostral and caudal. Red fills show the spread in the caudal direction from the normal line; blue fills show the rostral spread. E: response maps as in D but to electrical stimulation in the SGI in caudal (i), middle (ii), and rostral (iii) regions. The site in the SGS with shortest latency responses (SGI stimulation) are indicated by a circle. Stimulus 100 μA, 200 μs. The yellow dashed line perpendicular to the dorsal surface runs through the site of stimulation, as in D, and the white dashed line perpendicular to the dorsal surface runs through the site of onset of responses in the sensory layers. F: using the line normal to the slice surface through the site of stimulation, areas and distances to the left (caudally directed; red) and right (rostrally directed; blue) were calculated for the threshold maps in D for stimulation in the SGS. Areas (above) and distances (below) illustrate the symmetry of response spread in the caudal region and asymmetry in the middle region. The differences between rostrally directed and caudally directed spread in the rostral region were not statistically significant. G: as in F but with SGI stimulation. Responses spread symmetrically in the caudal region, but in the middle and rostral regions responses showed a clear and statistically significant asymmetry. *P < 0.05.
Fig. 2.
Fig. 2.
Asymmetric spread of ADP excitatory component in parasagittal SC slices. A: maximal projection maps of voltage imaging data obtained 10–200 ms following superficial layer stimulus in the caudal (i), middle (ii), and rostral (iii) SC regions. Corresponding 50% thresholded images are shown below the maximal projections and indicate caudal (red) and rostral (blue) spread from the origin of the stimulus (+). B: maximal projections of voltage imaging data of the ADP following motor layer stimulation in the caudal (i), middle (ii), and rostral (iii) regions. Fifty percent thresholded images are shown below and indicate caudal (red) and rostral (blue) spread from the site of initial response in the superficial layers (open circle). C: areas (top) and distance of long axis of propagation (bottom) of the ADP in the caudal (red checker) and rostral (blue checker) direction in response to superficial layer stimulation in the caudal, middle, and rostral regions. D: spread of ADP, as in C, in response to motor layer stimulation. *P < 0.05.
Fig. 3.
Fig. 3.
Role of GABAA receptors in directing signal spread. A, left: charge-coupled device (CCD) image of an SC slice with a stimulating electrode in the middle region of the SGI. Right: color maps of maximal response (above) and 50% thresholded image (below) before (Control) and after SR-95531 application. Control responses show a greater caudally directed spread, and this asymmetry was reduced by the drug. The approximately horizontal white (above) and red (below) dashed curves represent the dorsal surface of the slice. The approximately vertical dashed line represents the perpendicular from the slice surface through the stimulus site. B: optical traces from locations rostral and caudal to the site of stimulation show responses to electrical stimulation before (black) and after application of the GABAA receptor antagonist SR-95531 (5 μM). Locations 1 and 2 are near the site of stimulation (approximately 150–200 μm), and locations 3 and 4 are more distant (∼500 μm). Note the large increase in ADP amplitude following drug application. C: spatiotemporal maps with average amplitude within the region of interest (dashed rectangle in the CCD image in A) encoded as color and plotted against distance from the site of stimulation (vertical dashed white line) as the x-axis and time as the y-axis. These maps show the shift in response profile from a peak caudal to the site of stimulation to a peak more central with an increase in rostrally directed spread. The map also shows the spatial register between the initial spike and ADP as well as the substantial increase in the ADP following SR-95531 application.
Fig. 4.
Fig. 4.
GABAA receptors and asymmetry. Spread in the rostral and caudal directions of the initial spike and ADP in the presence of SR-95531. Asymmetry is represented by the relative areas within the 50% response contour falling to the caudal or rostral side of the perpendicular line. Red, caudal spread (spike); blue, rostral spread (spike); red checkers, caudal spread (ADP); blue checkers, rostral spread (ADP). A and B: areas of responses to SGS stimulation (A) and SGI stimulation (B). C and D: distance of spread in response to SGS stimulation (C) and SGI stimulation (D). E: relative increase in the area of responses following SR-95531 application in the caudal spike (red-striped), rostral spike (blue-striped), caudal ADP (red diamond), and rostral ADP (blue diamond) with stimulation in the SGS (left) or SGI (right). F: same analysis as in E, for the changes in distance of spread. G: ratio of rostral to caudal responses of the initial spike area before and after SR-95531 application. H: ratio of rostral to caudal responses of the ADP area before and after SR-95531 application. *P < 0.05.
Fig. 5.
Fig. 5.
Spread of initial spike and ADP. A: representative response amplitude maps of the initial spike (left column) and the ADP (right column) before (top) and after (bottom) application of SR-95531 following SGI stimulation in the middle region. The dashed white line traces the middle of the SGS, which was used to track the distance of spread plotted in B. B: distributions of initial spike and ADP amplitude represented by Gaussian fits in response to SGS and SGI stimulation in the caudal, middle, and rostral regions. X-axis origin represents the line perpendicular to the dorsal surface through the site of stimulation with negative x-values representing caudal and positive representing rostral. C: mean values of the position of the maximal initial spike and ADP from the Gaussian fits in B. N = 9.
Fig. 6.
Fig. 6.
Single-neuron responses to glutamate. Patch-clamp recordings from neurons show responses to l-glutamate (1 M) iontophoresis at sites rostral or caudal to the neuron under recording. A: a neuron receiving inhibitory inputs from a stimulation site caudal to the cell under recording. Top trace shows current in a cell voltage-clamped at −50 mV. Glutamate (L-Glut) iontophoresis (0.5 μA, 1 s) elicited an outward current. Bottom trace shows the same cell under current-clamp (holding current adjusted to bring the neuron to −45 mV), displaying spontaneous spikes that were abolished by glutamate. B: a neuron displaying excitatory synaptic responses when glutamate was applied to a rostral location. Top trace: current from a cell voltage-clamped at −70 mV. Glutamate elicited inward synaptic currents. Bottom trace: voltage under current-clamp (adjusted to −55 mV). Glutamate elicited a depolarization. C: spatial distribution of responsive cells with respect to the site of glutamate application. Distances for cells receiving excitatory (pluses) and inhibitory (open circles) synaptic inputs were plotted. Sites left of the origin represent glutamate application to a rostral location, whereas sites right of the origin represent glutamate application to a caudal location. All neurons recorded from were in the SGS. D: distance from the stimulus site to neurons displaying inhibitory or excitatory responses. Analysis includes neurons from both the rostral and the caudal side of a stimulus. E: mean whole cell resistances of neurons displaying excitatory and inhibitory responses. Neurons with excitatory responses from caudal and rostral sites had the same resistance. Neurons receiving inhibitory inputs from a rostral site had a higher resistance than neurons receiving excitatory inputs from a rostral site. F: morphology of neurons receiving excitatory (+) and inhibitory (−) responses on each side of the stimulus revealed with Lucifer yellow in a 2-photon microscope. *P < 0.05.
Fig. 7.
Fig. 7.
Rostrally directed inhibition impedes spread of responses to delayed stimulation at a 2nd site. CCD image (A) and schematic (B) of the dual-site stimulation experiments are shown. Electrical stimulation was applied either to both sites in the SGI simultaneously or with 5- to 10-ms offsets. C: simultaneous stimulation (i) in the SGI produced a caudally propagating response from the rostral (right) stimulation site. ii: Stimulating the caudal site 5 ms before the rostral site impeded the caudal propagation and reduced responses to the 2nd stimulus. iii: Applying the caudal stimulus 5 ms after the rostral stimulus did not diminish responses. The difference map (Δ) between simultaneous and caudal-first stimulation shows a zone of inhibition near the rostral site, whereas the Δ map on the right shows no effect of caudal-first stimulation. Application of SR-95531 (5 μM) abolished this inhibition, and temporal offsets resulted in no discernible changes in the amplitude and extent of caudally directed propagation. D: area of Δ map (within 50% threshold contour) in control (blue) following the application of SR-95531 (blue striped bar; N = 7; P = 0.0028) in caudal-first experiments. Areas of Δ maps of rostral-first experiments are shown for control (red) and following SR-95531 application (red stripped bar; N = 5; P = 0.41). *P < 0.05.

References

    1. Baluch F, Itti L. Mechanisms of top-down attention. Trends Neurosci 34: 210–224, 2011. - PubMed
    1. Basso MA, Wurtz RH. Modulation of neuronal activity in superior colliculus by changes in target probability. J Neurosci 18: 7519–7534, 1998. - PMC - PubMed
    1. Behan M, Appell PP. Intrinsic circuitry in the cat superior colliculus: projections from the superficial layers. J Comp Neurol 315: 230–243, 1992. - PubMed
    1. Binns KE, Salt TE. Different roles for GABAA and GABAB receptors in visual processing in the rat superior colliculus. J Physiol 504: 629–639, 1997. - PMC - PubMed
    1. Bisley JW. The neural basis of visual attention. J Physiol 589: 49–57, 2011. - PMC - PubMed

Publication types

MeSH terms

LinkOut - more resources