. 2015 Jul;114(1):608-23.
doi: 10.1152/jn.00628.2014. Epub 2015 May 20.

Cell type- and activity-dependent extracellular correlates of intracellular spiking

Affiliations

Cell type- and activity-dependent extracellular correlates of intracellular spiking

Costas A Anastassiou et al. J Neurophysiol. 2015 Jul.

Abstract

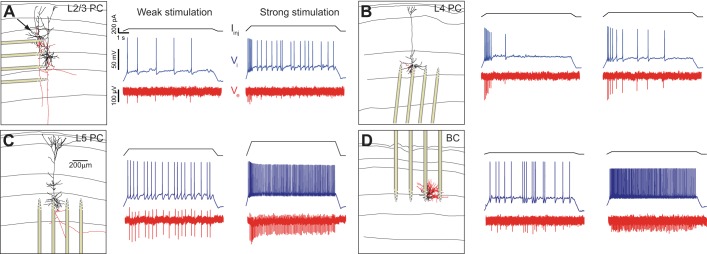
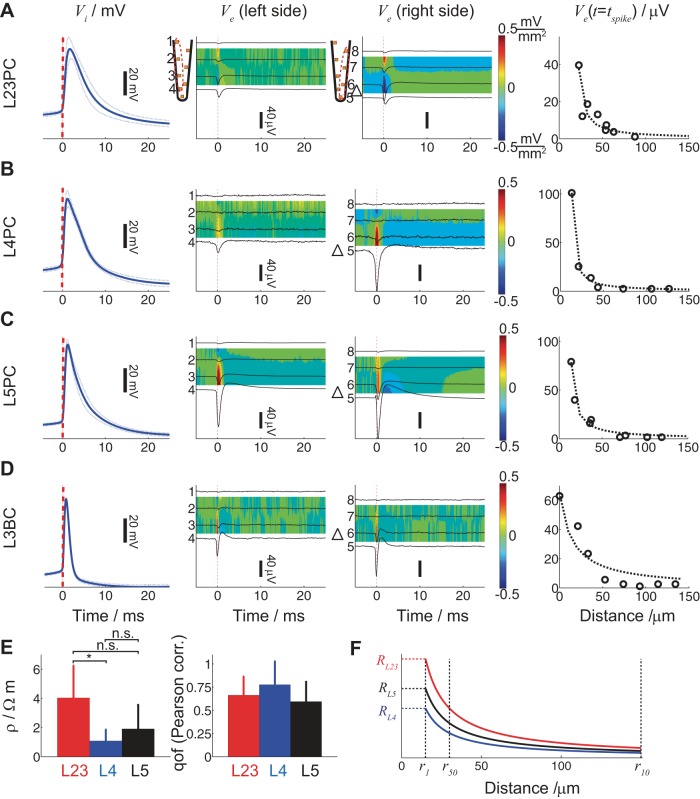
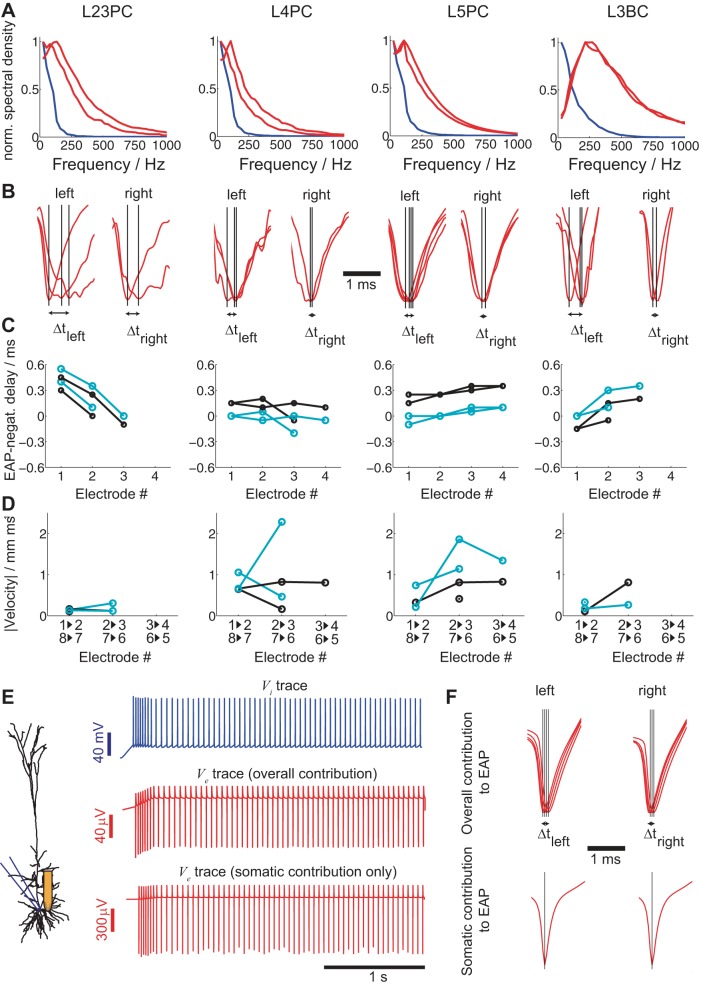
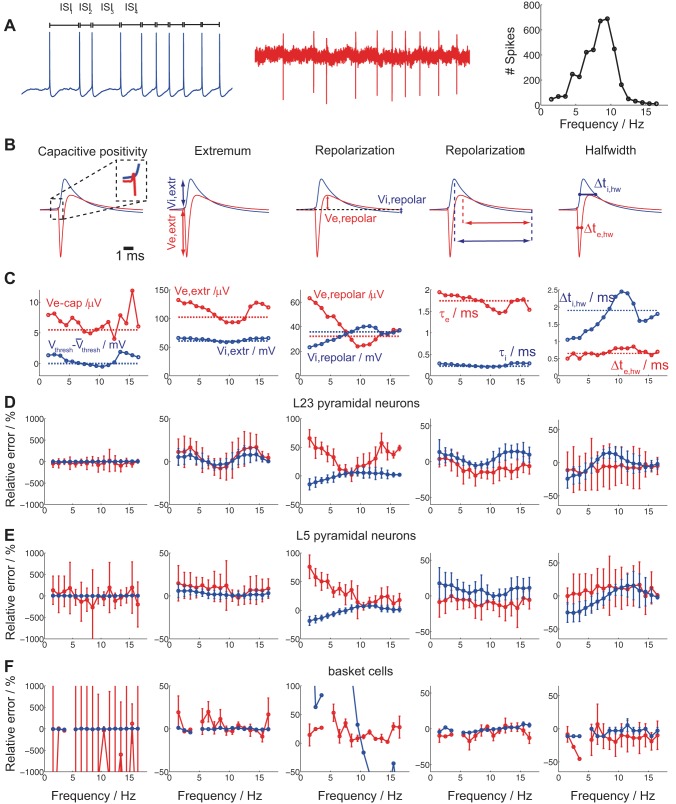
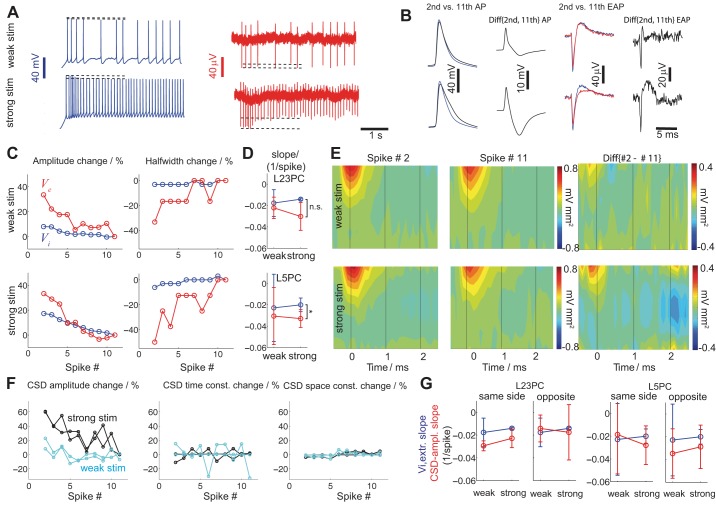
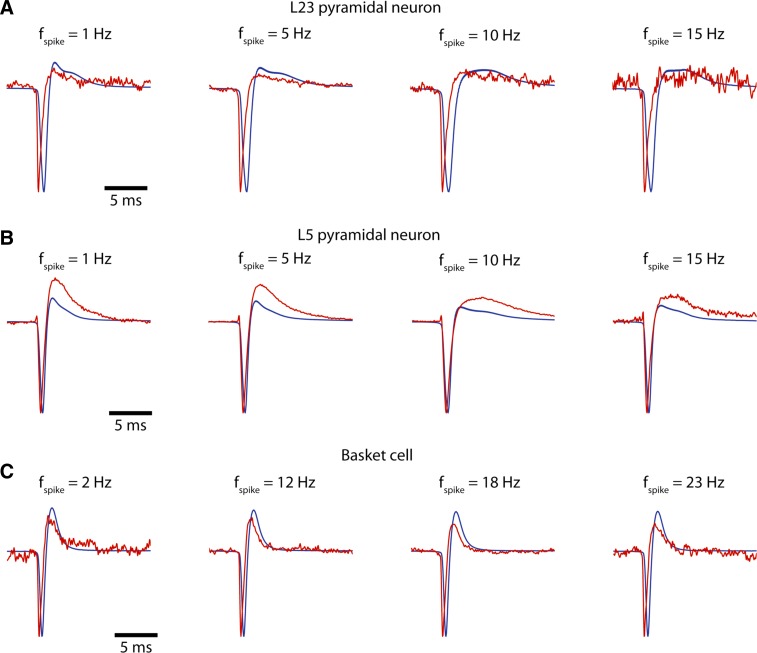
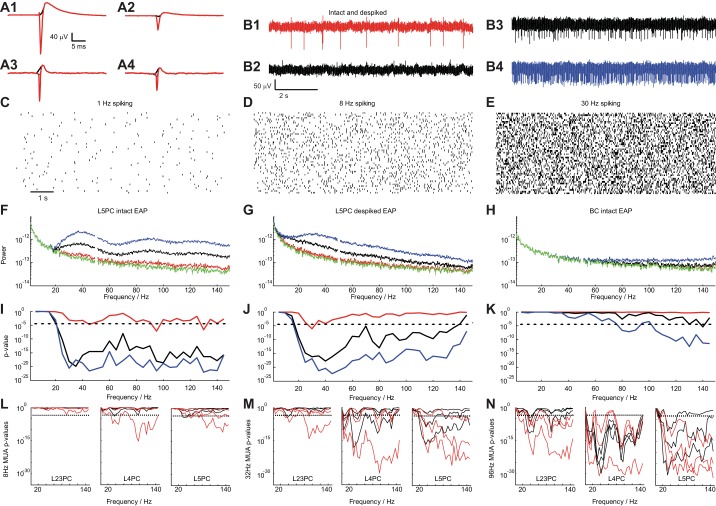
Despite decades of extracellular action potential (EAP) recordings monitoring brain activity, the biophysical origin and inherent variability of these signals remain enigmatic. We performed whole cell patch recordings of excitatory and inhibitory neurons in rat somatosensory cortex slice while positioning a silicon probe in their vicinity to concurrently record intra- and extracellular voltages for spike frequencies under 20 Hz. We characterize biophysical events and properties (intracellular spiking, extracellular resistivity, temporal jitter, etc.) related to EAP recordings at the single-neuron level in a layer-specific manner. Notably, EAP amplitude was found to decay as the inverse of distance between the soma and the recording electrode with similar (but not identical) resistivity across layers. Furthermore, we assessed a number of EAP features and their variability with spike activity: amplitude (but not temporal) features varied substantially (∼ 30-50% compared with mean) and nonmonotonically as a function of spike frequency and spike order. Such EAP variation only partly reflects intracellular somatic spike variability and points to the plethora of processes contributing to the EAP. Also, we show that the shape of the EAP waveform is qualitatively similar to the negative of the temporal derivative to the intracellular somatic voltage, as expected from theory. Finally, we tested to what extent EAPs can impact the lowpass-filtered part of extracellular recordings, the local field potential (LFP), typically associated with synaptic activity. We found that spiking of excitatory neurons can significantly impact the LFP at frequencies as low as 20 Hz. Our results question the common assertion that the LFP acts as proxy for synaptic activity.

Keywords: LFP; clustering; extracellular recordings; intracellular spikes; spike waveform.


Figures

Fig. 1.
Fig. 1.
Intracellular somatic spiking and its extracellular reflection as measured by the 32-site silicon probe recordings in rat somatosensory slices from a L23 pyramidal neuron (L23PC; A), L4 pyramidal neuron (L4PC; B), L5 pyramidal neuron (L5PC; C), and L3 basket cell (L3BC; D). Left: images of the reconstructed neural morphology (dendrites: black; axon: red; horizontal lines indicate cortical layers) and location of silicon probe from individual experiments. (The arrow in A shows the patched L23 neuron.) Somatic spiking is induced via administration of a suprathreshold 9-s DC intracellular step of variable strength. Administration of small amplitude DC current (weak stimulation) resulted in slow spiking (middle) while an increase in the amplitude (strong stimulation) gives rise to faster spiking (right). Intracellular current stimulus is shown on top (black), intracellular somatic voltage response (blue) in the middle, extracellular voltage (as recorded from electrode of the silicon probe closest to the soma; red) at the bottom.
Fig. 2.
Fig. 2.
Intra- and extracellular action potentials (APs) for the cells shown in Fig. 1 as recorded from the whole cell patch electrode as well as by 8 electrodes along the shank located most proximal to the spiking neuron. A–D: spike-triggered intra- and extracellular responses for a L23 (A), L4 (B), and L5 (C) pyramidal neuron as well as a L3 (D) basket cell. 1st Column: spike-triggered average of Vi aligned at tspike determined as the maximum of the second time derivative of Vi right before the maximum Vi (blue line: mean; broken line: SD). All spike-triggered average Vi traces are aligned at tspike (dashed red line). 2nd and 3rd Columns: spike-triggered average of the recorded Ve (black lines) from the left (2nd column) and right 4 electrodes (3rd column) of the most proximal shank adjacent to the soma (schematized by the triangle). Colors indicate the mean spike-triggered current source density (red: source; blue: sink) attributed to spiking. 4th Column: extracellular action potential (EAP) amplitude at tspike as a function of distance between the whole cell-patched soma and extracellular sites along the shank closest to the soma. E: extracellular resistivity ρ (left) and quality of fit (right; 0 no correlation and 1 perfect fit) for 9 L2/3 (red), 4 L4 (blue), and 12 L5 (black) pyramidal neurons for the extracellular voltage inferred by assuming a current point source in a purely resistive cytoplasm (see text). Comparison between layer-specific ρ yielded statistically significant difference between ρL23PC and ρL4PC (ANOVA, P < 0.05); qof, quality of fit. F: based on the layer-specific ρ (same color coding as in E), the ratio R = Ve/I = ρ/4πr is calculated as a function of distance with distances r50 and r10 designating the distance where the EAP amplitude becomes 50 and 10%, respectively, compared with the EAP amplitude 10 μm (r1) from the cell body.
Fig. 3.
Fig. 3.
Temporal characteristics of EAP signals from identified single neurons. A: frequency spectra of intracellular spikes (blue lines) and the 2 largest EAPs (red lines) of the 4 neurons shown in the figure. B: alignment of the mean EAP signals from the 8 sites along the silicon shank closest to the cell body to the spike initiation time tspike (determined intracellularly) reveals temporal differences between the EAP signals (left to right). C: time difference between the EAP minimum at different sites along the same shank and the intracellular spike onset (black) or the time of the EAP negativity of the electrode recording the strongest EAP (cyan). The 2 shank sides are considered separately (see Fig. 2, A–D, 2nd and 3rd columns), hence the multiple lines (x-axis: electrode number as defined in Fig. 2A). D: signal-propagation velocity v calculated from the interelectrode distances (x-axis: electrodes involved in calculation of v). AP minima delays are attributed to somatic APs traveling back along the apical dendrites (see text). E: same intracellular input as in Fig. 1 delivered to the soma of a L5 pyramidal neuron simulation (see materials and methods) with extracellular recording sites positioned at the same locations as for the silicon probe (left) and the resulting intra (top)- and extracellular responses (middle and bottom). Ve at a site 30 μm from the soma is either computed by taking into consideration the entire neuron (middle) or only the soma (bottom). F: if the same analysis as in B is carried out for the simulated data, the temporal differences between the EAP signals along the same shank can be attributed to membrane currents along the whole neural morphology (top). (Notably, the EAP delay and propagation speed are very similar to the ones measured experimentally for the L5 pyramidal neuron in B and C.) An identical simulation with only somatic compartments contributing to the EAP reveals no temporal differences (bottom).
Fig. 4.
Fig. 4.
Cell type-specific intra- and extracellular spike-waveform characteristics as a function of spike frequency. A: intracellular somatic DC current injection of varying strength results in intracellularly (blue) and extracellularly (red) recorded spikes. Spike frequency is defined for each spike as the inverse of its ISI resulting in a Gaussian-like spike frequency histogram (right). B: 5 extracellular spike-waveform characteristics were studied (left to right): the initial capacitive positivity (Ve,cap) amplitude, the EAP negativity amplitude (Ve,extr), the EAP repolarization positive (Ve,repol) amplitude, the EAP repolarization time τe, and the EAP half-width Δte,hw (features designated in red). Likewise, 5 intracellular spike waveform characteristics were analyzed (left to right): change in voltage spike threshold compared with the mean, the intracellular spike-amplitude (Vi,extr), the intracellular postspike negativity (Vi,repol) amplitude (compared to baseline), the intracellular spike repolarization time τi, and the intracellular spike half-width Δti,hw (features designated in blue). C: intra- (solid blue)- and extracellular (solid red) spike-waveform characteristics as a function of spike frequency for the L5 pyramidal neuron in A. Broken lines indicate the mean of each intra- and extracellular spike-feature across spike frequencies. D–F: differences in intra- and extracellular spike waveform characteristics (C) as a function of spike frequency with reference to the mean waveform across all spikes irrespective of spike frequency for 8 L23 (D) and 12 L5 (E) pyramidal neuron recordings as well as 4 basket cell (F) recordings (red: extracellullar feature; blue: intracellular features; circles: mean; error bars: SD). Differences are expressed as the relative error (for more thorough explanation, see text). Ve,extr variability is consistently larger than Vi,extr variability for all cell types (2nd and 3rd columns; basket cell variability in the 3rd column, in blue, is attributed to repolarization being very close to baseline) while temporal feature variability much less so (4th and 5th column).
Fig. 5.
Fig. 5.
Spike waveform variability with stimulation intensity and spike order. A: for weak intracellular DC stimulation of a L5 pyramidal neuron (top) the features of the intracellular (blue) and extracellular (red) traces remain largely invariant (broken lines designate AP and EAP amplitude of spikes at the beginning and 2.5 s from stimulus onset). For strong stimulation (bottom), intracellular and extracellular traces contain spikes whose amplitude changes with spike order (broken lines; compare with top). B: comparison between 2nd (blue) and 11th intracellular spike (black) aligned at tspike (left) reveals small differences for weak (top) stimulation that become more pronounced for strong stimulation (bottom). 2nd Column: difference between the 2nd and 11th intracellular AP waveform (mean of 5 experiments with identical input; blue minus black in leftmost panels). 3rd And 4th columns: same for EAP waveforms. C: intra- and extracellular features as function of spike order [left: Vi,extr (blue) vs. Ve,extr change (red); right: Δti,hw vs. Δte,hw change] for weak (top) and strong (bottom) stimulation (same L5 pyramidal neuron as in A and B). Relative error compared with the last (11th) spike considered (relative error for all features for the 11th spikes equal zero). D: slope of the amplitude change (as reported in C; see also text) for the intra (blue)- and extracellular (red) EAPs for L23 (top) and L5 pyramidal neurons (bottom) as a function of stimulation amplitude (circles: mean; error bars: SE). Statistical testing (ANOVA, P < 0.05) reveals significant difference between the amplitude gradient of intra- and extracellular L5 pyramids. E: mean current source density (CSD) (left shank) of the 2nd and 11th spike for a L5 pyramidal neuron (same as in A–C) for weak (top) and strong (bottom) stimulation (left and middle). The difference in mean CSD between the 2nd and 11th spike is shown in the right. F: relative error in amplitude, time, and spatial features of the CSD as a function of spike order for a L5 pyramidal neuron as expressed by (left to right) CSD amplitude (ACSD)/ĀCSD − 1, σt/σ̄t − 1 and σx/σ̄x − 1 with ĀCSD, σ̄t, and σ̄x being the mean CSD amplitude, time, and space constant, respectively (cyan: weak stimulation; black: strong stimulation; 2 lines: CSD changes along 2 sides of the same shank). G: slope of the linear fit to the mean ACSD as a function of spike order normalized by the ACSD for each cell (blue: intracellular; red: extracellular; circles: mean; error bars: SD) for L23 (left) and L5 (right) pyramidal neurons for the 4 shank electrodes on the same vs. the opposite side of the soma. Statistical testing (ANOVA, P < 0.05) revealed no significant difference between intracellular and ACSD slopes. Furthermore, no statistically significant difference was found for ACSD slopes between weak and strong stimulation.
Fig. 6.
Fig. 6.
Comparison between EAP waveform with the negative 1st-order time-derivative of the intracellular AP waveform, −dVi/dt, for different cell types (A–C: a L23 pyramid, a L5 pyramid, and a basket cell). Intracellular stimuli of varying strength are applied (see Fig. 1) resulting in spikes of varying interspike interval (ISI). Spike frequency is then defined as 1/ISI and spikes are grouped. The figure shows the mean extracellular (red) and the mean −dVi/dt (blue) for difference spike frequencies. (Waveforms are scaled so as to have the same amplitude.) As observed, the EAP and −dVi/dt waveforms are in close agreement (width, etc.) near the EAP negativity. Comparison between the EAP and −dVi/dt waveform becomes poorer ∼1 ms after the EAP negativity when slower, repolarizing currents are activated.
Fig. 7.
Fig. 7.
Impact of EAPs on the local field potential. A: spike-triggered EAP waveform of a L5PC (A1 and A2) and a L3BC (A3 and A4) (left: from site with largest EAP amplitude; right: from site recording the 2nd largest EAP waveform). The intact EAP waveform is shown (red) as well as the “de-spiked” one where the EAP negativity is missing (black; window of 0.6 ms around spike initiation time is substituted by a spline). B: extracellular traces composed using the L5PC EAP waveform: mean spike rate f0 of 1 Hz with intact waveform (B1), 1 Hz with de-spiked waveform (B2; from A2), 8 Hz (B3), and 30 (B4) Hz with intact waveform. C–E: 50 realizations of a random process (log-normal PDF used to produce the ISI distributions) to create 9-s traces with f0 = 1, 8, and 30 Hz, respectively. F: mean spectral density as a function of temporal frequency for the intact EAP waveform shown in A1 (green: no spiking; red: 1 Hz; black: 8 Hz; blue: 30 Hz). G: same as in F for the de-spiked EAP waveform of the L5PC shown in A1 (black). H: same analysis as in F for the intact EAP waveform of the basket cell shown in A3 (red). I–K: P value (t-test) for the pairwise comparison of spectral density at f0 = 1 (red), 8 (black), and 30 Hz (blue) with no spiking (broken lines: P = 10−3, Bonferroni corrected) for the cases shown in F–H. L–N: same analyses introduced in I–K but instead of using the EAP waveform of a single neuron we use EAP waveforms from all neurons of a particular cell type (8 L23, 4 L4, and 12 L5 pyramidal neurons) to create extracellular voltage traces (as the ones shown in B) to emulate multiunit activity (MUA) with mean spike frequency fMUA= 8, 32, and 96 Hz. Statistical significance (t-test, dashed line: P = 10−3, Bonferroni corrected) of the difference in spectral power between control (no spiking) and spiking traces at different frequencies for intact (red) and de-spiked (black) EAP waveforms. Lines of the same color show the result from different EAP waveforms as measured by different sites along the shank by considering the strongest and 2nd and 3rd strongest EAP signals both for the intact and de-spiked EAP waveforms with the lowest P value obtained for strongest EAP waveforms. For fMUA equal or larger than 32 Hz, intact as well as de-spiked waveforms of all pyramidal cell types significantly impact spectral density as low as 20 Hz.

References

    1. Amzica F, Steriade M. Neuronal and glial membrane potentials during sleep and paroxysmal oscillations in the neocortex. J Neurosci 20: 6648–6665, 2000. - PMC - PubMed
    1. Anastassiou CA, Koch C. Ephaptic coupling to endogenous electric field activity: why bother? Curr Opin Neurobiol 31: 95–103, 2015. - PubMed
    1. Anastassiou CA, Perin R, Markram H, Koch C. Ephaptic coupling of cortical neurons. Nat Neurosci 14: 217–223, 2011. - PubMed
    1. Anastassiou C, Buzsáki G, Koch C. Biophysics of extracellular spikes. In: Principles of Neural Coding. Boca Raton, FL: CRC Taylor, 2013, p. 15–37.
    1. Barthó P, Hirase H, Monconduit L, Zugaro M, Harris K, Buzsáki G. Characterization of neocortical principal cells and interneurons by network interactions and extracellular features. J Neurophysiol 92: 600–608, 2004. - PubMed

Publication types

LinkOut - more resources