. 2015 Jul 3;290(27):16759-71.
doi: 10.1074/jbc.M115.660613. Epub 2015 May 20.

A Novel Mechanism for Binding of Galactose-terminated Glycans by the C-type Carbohydrate Recognition Domain in Blood Dendritic Cell Antigen 2

Affiliations

A Novel Mechanism for Binding of Galactose-terminated Glycans by the C-type Carbohydrate Recognition Domain in Blood Dendritic Cell Antigen 2

Sabine A F Jégouzo et al. J Biol Chem. .

Abstract

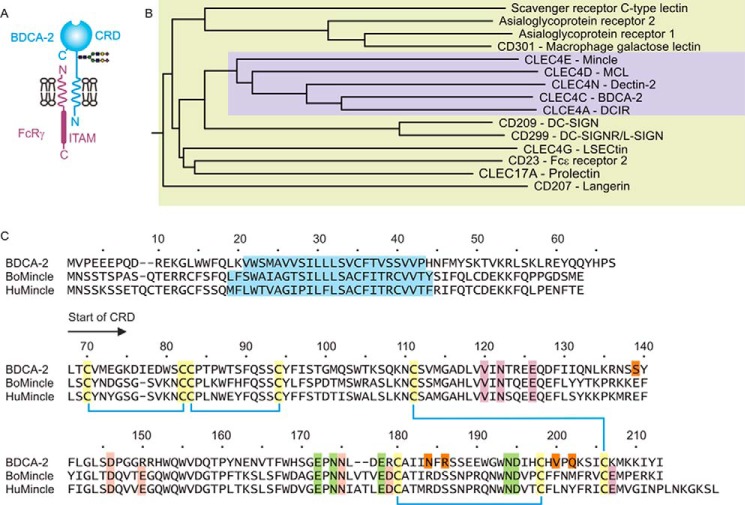
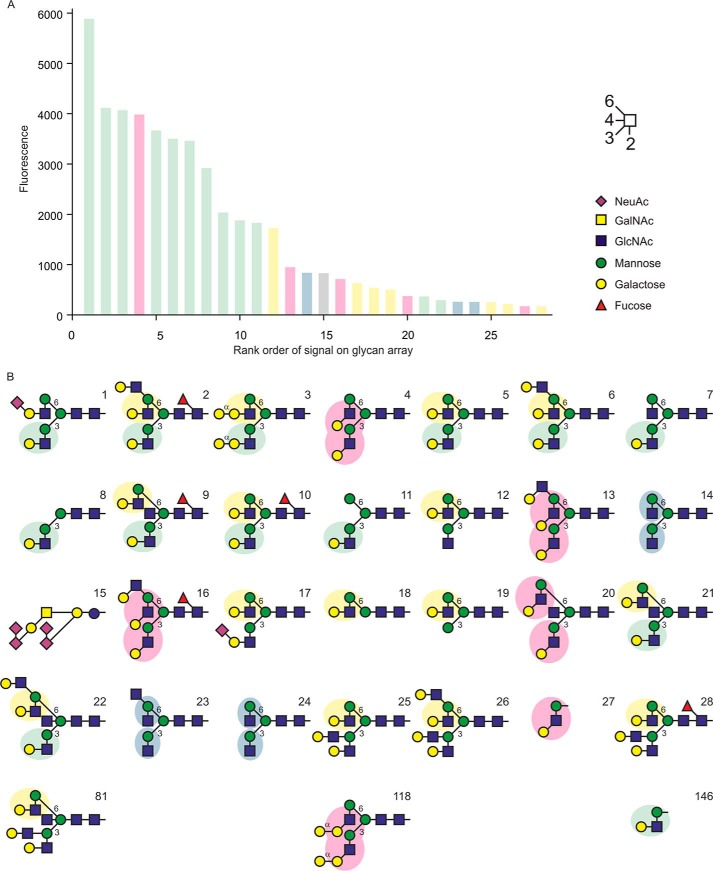
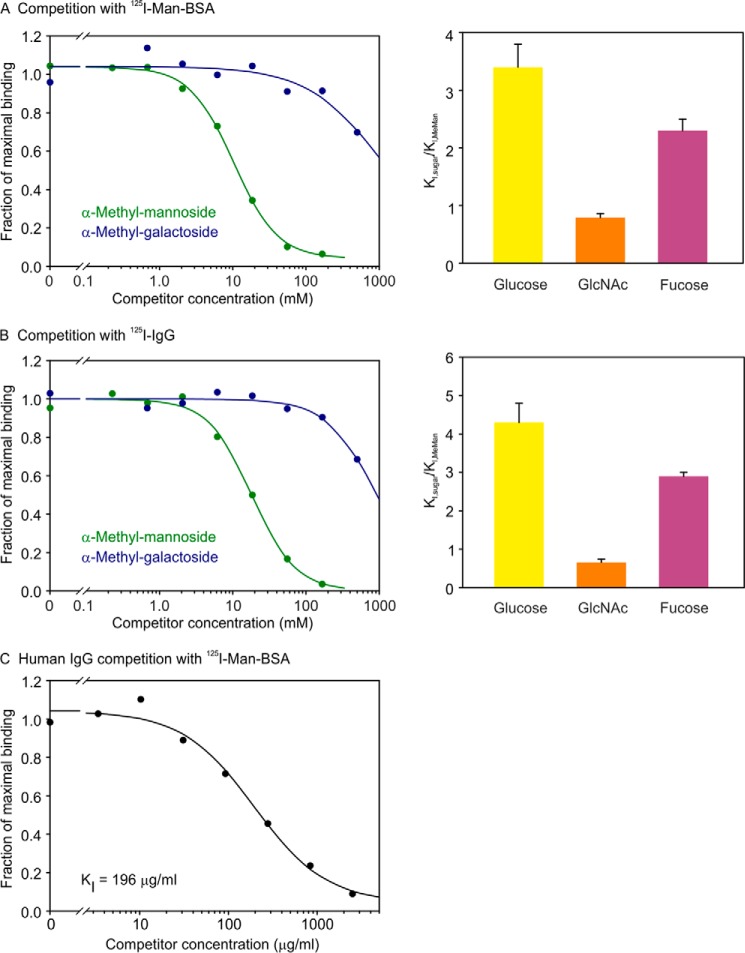
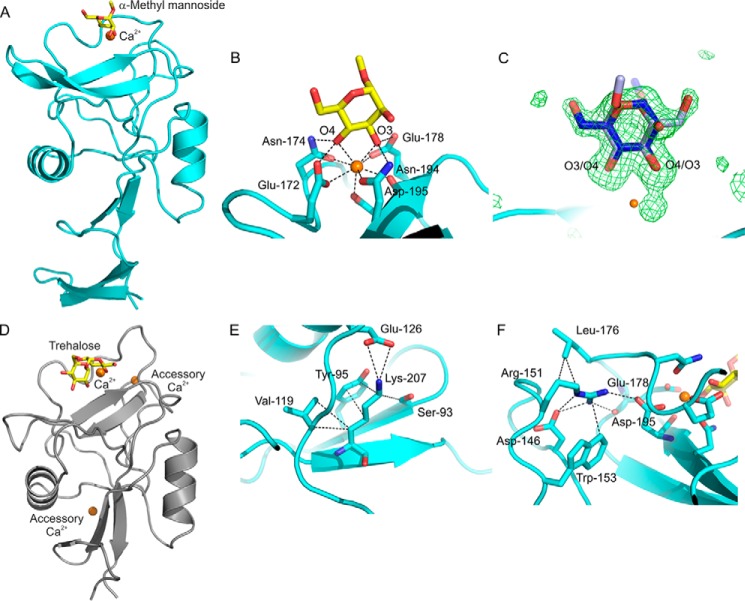
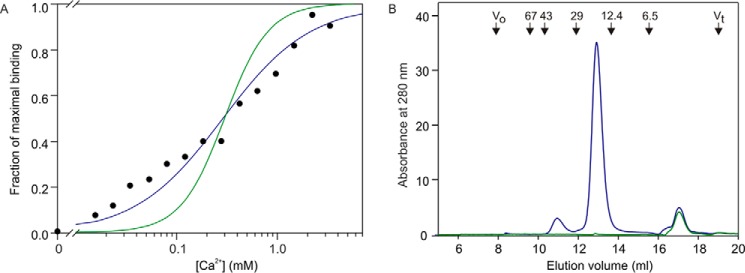
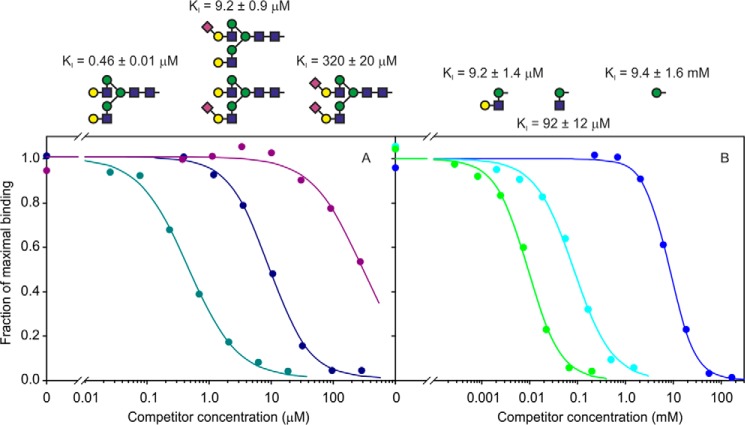
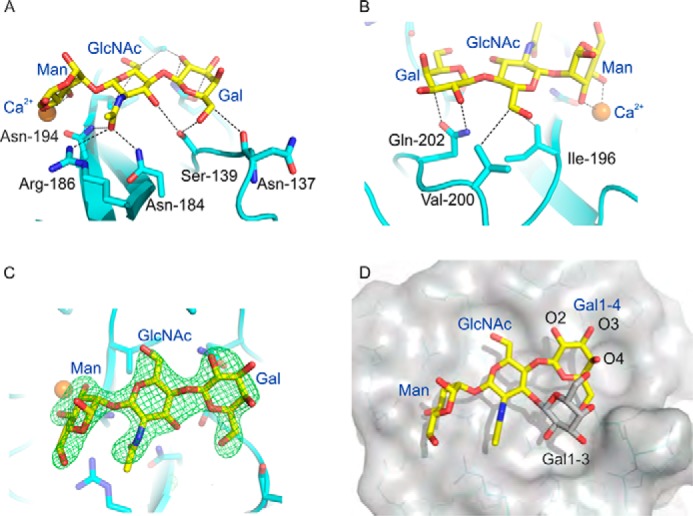
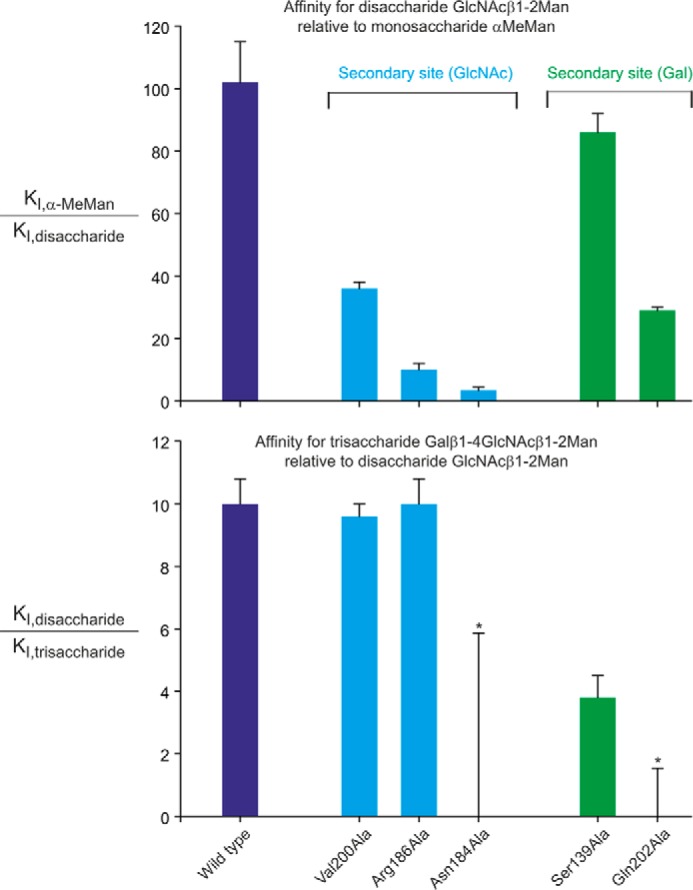
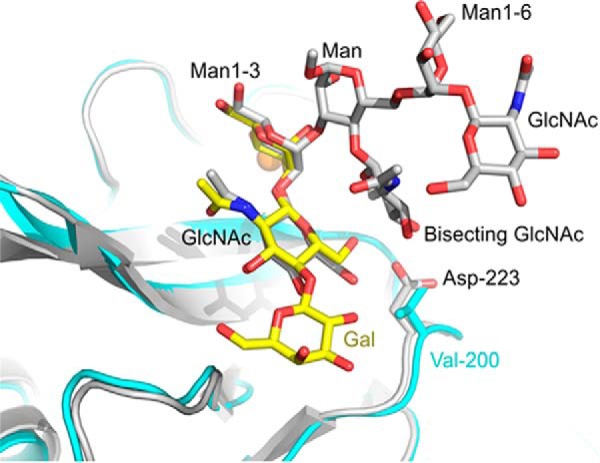
Blood dendritic cell antigen 2 (BDCA-2; also designated CLEC4C or CD303) is uniquely expressed on plasmacytoid dendritic cells. Stimulation of BDCA-2 with antibodies leads to an anti-inflammatory response in these cells, but the natural ligands for the receptor are not known. The C-type carbohydrate recognition domain in the extracellular portion of BDCA-2 contains a signature motif typical of C-type animal lectins that bind mannose, glucose, or GlcNAc, yet it has been reported that BDCA-2 binds selectively to galactose-terminated, biantennary N-linked glycans. A combination of glycan array analysis and binding competition studies with monosaccharides and natural and synthetic oligosaccharides have been used to define the binding epitope for BDCA-2 as the trisaccharide Galβ1-3/4GlcNAcβ1-2Man. X-ray crystallography and mutagenesis studies show that mannose is ligated to the conserved Ca(2+) in the primary binding site that is characteristic of C-type carbohydrate recognition domains, and the GlcNAc and galactose residues make additional interactions in a wide, shallow groove adjacent to the primary binding site. As predicted from these studies, BDCA-2 binds to IgG, which bears galactose-terminated glycans that are not commonly found attached to other serum glycoproteins. Thus, BDCA-2 has the potential to serve as a previously unrecognized immunoglobulin Fc receptor.

Keywords: CD303; CLEC4C; carbohydrate-binding protein; crystal structure; glycobiology; glycoprotein; lectin.


Figures

FIGURE 1.
FIGURE 1.
Sequence of human BDCA-2. A, summary of the organization of BDCA-2 and other type 2 transmembrane receptors containing C-type CRDs. B, dendrogram showing the relationships between the CRD portions of this group of C-type lectins. The subgroup containing mincle and BDCA-2 is highlighted in the violet box. C, sequence of BDCA-2 compared with sequences of cow and human mincle. The N terminus of the CRD is denoted by the arrow. Disulfide bonds are indicated by blue lines between conserved cysteine residues, which are highlighted in yellow. Amino acid residues that create the conserved Ca2+-binding site are indicated in green, and residues in mincle that create the two accessory Ca2+-binding sites in mincle are highlighted in violet and pink. Residues that form part of the extended sugar-binding site of BDCA-2 are highlighted with orange. The putative transmembrane domains are shown in blue.
FIGURE 2.
FIGURE 2.
Purification of the CRD from BDCA-2 by affinity chromatography. A, the CRD was renatured from inclusion bodies by dialysis against Ca2+-containing buffer followed by dialysis against water and lyophilization to obtain a concentrated sample that was applied to a 10-ml column of mannose-Sepharose. After application of the sample, the column was eluted with 150 mm NaCl, 25 mm Tris-Cl, pH 7.8, 25 mm CaCl2. Fractions of 2 ml were collected. B, following renaturation by dialysis, the CRD was applied directly to a 5-ml column of desialylated egg yolk glycopeptide immobilized on agarose. The column was rinsed with 25 ml of 150 mm NaCl, 25 mm Tris-Cl, pH 7.8, 25 mm CaCl2, and protein was eluted with 150 mm NaCl, 25 mm Tris-Cl, pH 7.8, 2.5 mm EDTA in 1-ml fractions. In both cases, aliquots (15 μl) from fractions were analyzed on SDS-polyacrylamide gels that were stained with Coomassie Blue. The expected molecular weight of the BDCA-2 CRD is 17,100.
FIGURE 3.
FIGURE 3.
Glycan array analysis of ligand binding to BDCA-2. A complex of biotin-tagged CRD from BDCA-2 with Alexa 488-labeled streptavidin was used to screen synthetic glycan array version 5.1 at the Consortium for Functional Glycomics at a concentration of 100 μg/ml. A, results are arranged in rank order based on decreasing signal. B, structures corresponding to the 28 top-ranked glycans, plus three additional glycans with potential binding epitopes, are shown in symbol representation, in which the linkages from NeuAc are α2 and all other linkages are β1. The mannose α1–3 and α1–6 branch point linkages indicated with 3 and 6. Bars in A are color-coded based on the presence of the shaded binding epitopes in B: blue for uncapped GlcNAcβ1–2Man, yellow and green for Galβ1–4GlcNAcβ1–2Man on the 1–3 and 1–6 arms, respectively, and pink for Galβ1–3GlcNAcβ1–2Man. After glycan 28, with a signal of 171, the signal drops to 109 for glycan 29, and the average signal for the remaining glycans is 17. Complete glycan array results are provided in supplemental Table S1.
FIGURE 4.
FIGURE 4.
Competition results to define primary sugar-binding site in BDCA-2. Binding was performed with biotin-tagged CRD from BDCA-2 bound to streptavidin-coated wells. A and B, binding of 125I-Man-BSA or 125I-IgG was measured in the presence of competing α-methyl glycosides. C, binding of 125I-Man-BSA was measured in the presence of competing IgG. Half-maximal inhibition values (KI) were obtained by nonlinear least squares fitting of the data. The values of KI relative to the KI for α-methyl mannoside in bar graphs represent the means ± standard deviations for two to four independent assays.
FIGURE 5.
FIGURE 5.
Structural analysis of the primary sugar-binding site in BDCA-2. A, overall structure of BDCA-2 with bound α-methyl mannoside. B, Ca2+ and α-methyl mannoside in the primary site of BDCA-2 monomer B. C, α-methyl mannoside in the primary site of monomer A. FoFc map at 2.5 σ showing two conformations of the sugar related by a ∼180° rotation that switches the positions of O3 and O4. The occupancies of the conformations indicated in dark blue:light blue are 0.54:0.46, with the dark blue conformation corresponding to what is seen in monomer B. D, structure of the CRD from cow mincle (Protein Data Bank entry 4ZRV), with trehalose bound at the conserved Ca2+ and two accessory Ca2+ highlighted. This structure (H. Feinberg, S. A. F. Jégouzo, M. E. Taylor, K. Drickamer, and W. I. Weis, unpublished observations), which was used as the search model for the molecular replacement solution, is similar to Protein Data Bank entry 4KZV, but with a third Ca2+ replacing the bound Na+, in a position analogous to that seen in mannose-binding protein and other C-type CRDs (4). E and F, arrangement of amino acid residues in BDCA-2 in the positions at which two accessory Ca2+ are bound to the CRD of mincle. Ca2+ is shown in orange, oxygen atoms in red, nitrogen atoms are dark blue, and carbon atoms of the sugars are yellow.
FIGURE 6.
FIGURE 6.
Ca2+ dependence and gel filtration analysis of the CRD from BDCA-2. A, Ca2+ dependence of 125I-Man-BSA binding to BDCA-2. Binding of 125I-mannose-BSA to the biotin-tagged CRDs immobilized in streptavidin-coated wells was quantified. After binding of ligand in 150 mm NaCl and 25 mm Tris-Cl, pH 7.8, in the presence of various concentrations of Ca2+, wells were washed with buffer containing 150 mm NaCl, 25 mm Tris-Cl, pH 7.8, and 25 mm CaCl2. The experimental data, shown as black circles, were fitted to first and second order binding equations, shown respectively as blue and green lines, using a nonlinear least squares fitting program. B, gel filtration analysis of the CRD from BDCA-2 on a 7.5 × 300-mm column of Sephacryl S75 eluted with 100 mm NaCl, 10 mm Tris-Cl, pH 7.8, and 2.5 mm EDTA at a flow rate of 0.5 ml/min. Blue trace is with protein, and green trace is a mock sample without protein, showing that the peak eluting at 17 ml results from the presence of Ca2+-EDTA complex in the sample. Positions of molecular weight standards are shown at the top.
FIGURE 7.
FIGURE 7.
Quantification of oligosaccharide binding to BDCA-2. Binding competition assays were conducted with biotin-tagged CRD from BDCA-2 immobilized on streptavidin-coated plates, using 125I-Man-BSA as reporter ligand. A, competition with biantennary glycans released from egg yolk glycopeptide and treated with mild acid to remove sialic acid residues. B, competition with synthetic di- and trisaccharides. Glycan structures are encoded as in Fig. 3. The values of KI are presented as means ± standard deviations for two to four independent assays.
FIGURE 8.
FIGURE 8.
Structural analysis of extended binding site in BDCA-2. A and B, BDCA-2 complex with Galβ1–4GlcNAcβ1–2Man showing interactions between the protein and the GlcNAc and Gal moieties of the elongated carbohydrate. C, FoFc map at 3.0 σ (green), showing Galβ1–4GlcNAcβ1–2Man at the binding site. D, surface representation of BDCA-2 with bound Galβ1–4GlcNAcβ1–2Man depicted as sticks with yellow carbon atoms. A galactose residue in β1–3 linkage to the GlcNAc, shown with gray carbon atoms, has been modeled to show that it can be accommodated in the binding site. Ca2+ is shown in orange, oxygen atoms are red, and nitrogen atoms are blue.
FIGURE 9.
FIGURE 9.
Mutational analysis of extended binding site in BDCA-2. Affinities for disaccharide and trisaccharide ligands are compared for the wild type and mutant CRDs, by plotting ratios of inhibition constants for oligosaccharides and α-methyl mannoside in the solid phase binding assay. The values of means ± standard deviations for two to four assays are shown. For the two measurements marked with an asterisk, no inhibition was seen at the highest trisaccharide concentration that could be tested (200 μm), so the error bars represent the highest possible ratio of affinities, based on an estimated KI value > 500 μm.
FIGURE 10.
FIGURE 10.
Comparison of ligand binding sites in human BDCA-2 and mouse DCIR2. The structure of mouse DCIR2 is taken from Protein Data Bank entry 3VYK and is shown in gray. BDCA-2 is shown in cyan. In the superposed structures, carbon atoms of Galβ1–4GlcNAcβ1–2Man bound to BDCA-2 are in yellow, and carbon atoms of the biantennary glycan with bisecting GlcNAc, bound to DCIR2, are in gray. Ca2+ is shown in orange, oxygen atoms in red, and nitrogen atoms are dark blue.

Similar articles

Cited by

References

    1. Dzionek A., Fuchs A., Schmidt P., Cremer S., Zysk M., Miltenyi S., Buck D. W., Schmitz J. (2000) BDCA-2, BDCA-3, and BDCA-4: three markers for distinct subsets of dendritic cells in human peripheral blood. J. Immunol. 165, 6037–6046 - PubMed
    1. Schraml B. U., Reis e Sousa C. (2015) Defining dendritic cells. Curr. Opin. Immunol. 32, 13–20 - PubMed
    1. Reizis B., Bunin A., Ghosh H. S., Lewis K. L., Sisirak V. (2011) Plasmacytoid dendritic cells: recent progress and open questions. Annu. Rev. Immunol. 29, 163–183 - PMC - PubMed
    1. Weis W. I., Taylor M. E., Drickamer K. (1998) The C-type lectin superfamily in the immune system. Immunol. Rev. 163, 19–34 - PubMed
    1. Guo Y., Feinberg H., Conroy E., Mitchell D. A., Alvarez R., Blixt O., Taylor M. E., Weis W. I., Drickamer K. (2004) Structural basis for distinct ligand-binding and targeting properties of the receptors DC-SIGN and DC-SIGNR. Nat. Struct. Mol. Biol. 11, 591–598 - PubMed

Publication types

MeSH terms