. 2015 May 20;35(20):7715-26.
doi: 10.1523/JNEUROSCI.4105-14.2015.

The contribution of raised intraneuronal chloride to epileptic network activity

Affiliations

The contribution of raised intraneuronal chloride to epileptic network activity

Hannah Alfonsa et al. J Neurosci. .

Abstract

Altered inhibitory function is an important facet of epileptic pathology. A key concept is that GABAergic activity can become excitatory if intraneuronal chloride rises. However, it has proved difficult to separate the role of raised chloride from other contributory factors in complex network phenomena, such as epileptic pathology. Therefore, we asked what patterns of activity are associated with chloride dysregulation by making novel use of Halorhodopsin to load clusters of mouse pyramidal cells artificially with Cl(-). Brief (1-10 s) activation of Halorhodopsin caused substantial positive shifts in the GABAergic reversal potential that were proportional to the charge transfer during the illumination and in adult neocortical pyramidal neurons decayed with a time constant of τ = 8.0 ± 2.8s. At the network level, these positive shifts in EGABA produced a transient rise in network excitability, with many distinctive features of epileptic foci, including high-frequency oscillations with evidence of out-of-phase firing (Ibarz et al., 2010). We show how such firing patterns can arise from quite small shifts in the mean intracellular Cl(-) level, within heterogeneous neuronal populations. Notably, however, chloride loading by itself did not trigger full ictal events, even with additional electrical stimulation to the underlying white matter. In contrast, when performed in combination with low, subepileptic levels of 4-aminopyridine, Halorhodopsin activation rapidly induced full ictal activity. These results suggest that chloride loading has at most an adjunctive role in ictogenesis. Our simulations also show how chloride loading can affect the jitter of action potential timing associated with imminent recruitment to an ictal event (Netoff and Schiff, 2002).

Keywords: chloride; fast spiking interneuron; high frequency oscillations; neocortex; pyramidal neuron; seizure.


Figures

Figure 1.
Figure 1.
eNpHR chloride-loading effect. Ai, EGABA was measured by doing perforated gramicidin patch recording and applying muscimol with or without previous eNpHR activation. Aii, Sample traces from a single neuron, showing progressively longer eNpHR activation, associated with a progressively larger effect on EGABA, as measured by a voltage ramp during a muscimol-triggered postsynaptic current. Aiii, Scatter plot showing the shift in EGABA versus the total loading charge calculated as the integral of the current over the illumination period. The plot includes multiple data points from single dissociated neurons, derived from different duration eNpHR activations (n cells) and five data points from five neurons (red) in adult brain slices, all from 2 s illumination. B, The recovery of EGABA after eNpHR activation. Bi, Sample traces from one of the neurons recorded in a brain slice, showing the response to muscimol puffs at progressively longer latencies after a 2 s eNpHR activation. A single-exponential curve (black line) is fitted to the minima of the voltage-ramp responses. Bii, Pooled data showing the recovery of EGABA after eNpHR activation in dissociated neuron cultures (black) and neurons recorded in adult brain slices (red). Single-exponential fits of the mean data are shown, but note that the time constants reported in Results are the averages of fits made to each individual cell. C, Example trace showing the excitability, in response to somatic charge injection, of a layer 5 pyramidal cells recorded in an adult brain slice, before, during, and immediately after activation of eNpHR current (orange bar). D, Phase plots of the rate of voltage change (dV/dt) versus the voltage for AP doublets immediately before (red) and within 1 s after a 5 s eNpHR activation (black), illustrating that eNpHR activation had no lasting effect on the AP threshold or shape. E, Measures of input resistance (RN) normalized to the pre-optogenetic activation value, showing a pronounced drop during the optogenetic activation but a rapid recovery. The post-optogenetic measures were taken within 1 s of the end of the illumination period.
Figure 2.
Figure 2.
Halorhodopsin (Halo) chloride loading induces high-frequency oscillations. A, Network activity recording arrangement. Ai, Confocal image showing sparse expression of eNpHR–EYFP in pyramidal cells. Aii, schematic showing the locations of the recording electrode in layer 5 (gray), stimulating electrode (blue) in the underlying white matter, and a fiber optic delivering 560 nm wavelength light. Aiii, 560 nm greatly suppresses the electrically evoked neural activity, thereby demonstrating the existence of a prominent eNpHR current. B, Sample recordings showing the effect of repeated 25 s periods of 560 nm illumination to activate eNpHR (eNpHR priming), with electrical stimulation during the dark periods (5 s). Electrical stimulation was applied 0.5 s after and 4.5 s before the illumination. The interval between stimuli was always 30 s. Baseline periods had the same electrical stimulation frequency (period, t = 30 s) but no eNpHR illumination. Bii, Representative traces and spectrograms taken during two periods of electrical stimulation without eNpHR illumination (Base1 and Base2) and two periods with illumination (HP1 and HP2). Note the large increase in power at 300–600 Hz during the eNpHR-priming periods, which reversed rapidly without illumination (Base2 and Ci). C, Composites of sequential spectrograms to show the changes during the entire experiment. Note the prominent band at ∼200–500 Hz, indicative of a rise in high-frequency power induced by eNpHR priming and the reversion to baseline without illumination. Similar experiments with Arch induced a small increase in amplitude of the network event but without any change in the high-frequency activity.
Figure 3.
Figure 3.
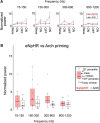
Frequency analysis of eNpHR-priming versus Arch-priming experiments. A, Pooled averages over all experiments, showing the changes in spectral power for different frequency bands, normalized to the baseline for each recording, for epochs of repeated eNpHR primed (red) and Arch primed (black; ON and intermediary periods without illumination (OFF). B, Box plot of the averaged ON-period power during eNpHR priming and Arch priming for different frequency bands. eNpHR activation positively modulates activity across all frequency bands but only differs significantly from Arch activation in the 300–600 Hz frequency band (n = 11 for eNpHR and Arch, p < 0.01, t test). Halo, Halorhodopsin.
Figure 4.
Figure 4.
Neuronal chloride loading triggers out-of-phase firing during spontaneous bursts of activity. A, Spectrograms of extracellular recordings of spontaneous bursts of activity in baseline (left) and eNpHR-primed (chloride-loaded) tissue. Note the prominent “double-frequency” signal in the chloride-loaded tissue. Detected spikes [dots, red (early) to green (late) shows a progression of time] were plotted on the Hilbert transform of the dominant oscillation (75–300 Hz; blue circular trace), and the rose plots represent the numbers of APs occurring at different phases of the oscillation. Note the out-of-phase spiking in the eNpHR-primed dataset, also apparent as a second minor peak (arrowed) in the conventional histogram (duplicated data beyond −π and π). B, Periods of hyperpolarization using Arch (Arch-priming) causes a rebound increase in spiking (contrast the calibration bars for the histograms) but no change in the phase distribution of spikes. C, Half-width index measured the ratio between the number of out-of-phase spikes to the in-phase spikes, which were taken to be the spikes within bounds (red lines) set by the half-width of a Gaussian fit to the main spike peak in the baseline histograms. Left column shows the raster plots for baseline and Cl-loaded tissue, and the right column shows the same data plotted as histograms of the spike times. D, Pooled data for half-width indices, showing significantly higher values for Cl-loaded slices (eNpHR-primed) compared with baseline (n = 8, p < 0.001, t test) and for Arch-primed tissue (n = 6, p < 0.02, t test). Halo, Halorhodopsin.
Figure 5.
Figure 5.
Control analyses to examine the effect of spectral leak. A, A raw data trace, showing the spikes (blue) and the amputated version (black). The bottom traces show the 75–300 Hz bandpass filtered traces. B, 75–300 Hz bandpass filtered traces of the raw (blue) and the amputated traces. Red dots indicate the spike times. Note the reduced amplitude peaks for the amputated spikes but that these still occur at the same phase of the oscillation, as evidence by the same skewed orientation of the pooled data shown in the spike-phase plots (right columns). C, The same filtered traces but showing the new locations of APs for the time-shifted analysis. The spike-phase plots showed a shifted phase, reflecting the time shift, and a broader main peak, but importantly, they were still heavily skewed for both the raw and amputated data.
Figure 6.
Figure 6.
Spike-phase relationships were preserved for three different control analyses for spectral leak effects. A, Example phase histograms showing the shifted spike-phase distributions for the three control paradigms illustrated in Figure 5, but note that the key features, with baseline spike-phase plots having single peaks, and eNpHR-primed plots having double peaks, are maintained. B, Pooled data showing that there were highly significant differences between the eNpHR-primed and Arch-primed matched analyses for all control paradigms. *p < 0.05; **p < 0.01; ***p < 0.001. Halo, Halorhodopsin.
Figure 7.
Figure 7.
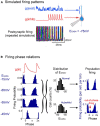
Heterogeneity in levels of intracellular Cl can explain the appearance of out-of-phase population firing. A, Simulation using NEURON of how a train of high-frequency IPSCs from a fast-spiking interneuron superimposed onto a noisy, desynchronized glutamatergic drive creates a patterned firing in the pyramidal cell. AP threshold was approximately −48 mV. B, Simulations in the same model, at four different GABAergic reversal potentials. The firing probability is plotted with respect to the field oscillation, which is approximately π/4 phase shifted from the start of the IPSC, as judged by comparisons with the timing of fast-spiking interneuron APs (Hasenstaub et al., 2005). These different probability histograms are convolved with estimates of the distribution of EGABA in the pyramidal population [middle, black; the bottom histogram is taken from the study of Huberfeld et al. (2007), mean EGABA = −64mV; the top is a simulated, normal distribution shifted to a slightly more hyperpolarized mean EGABA = −68 mV]. The convolution is achieved by assuming that the various bins show the firing phase relations in the left plots, to yield estimates of the population firing for the “normal” and the “Huberfeld” populations.
Figure 8.
Figure 8.
Rapid escalation of epileptiform activity by eNpHR priming in conjunction with 4-AP. A, Multiunit activity (MUA; 300–5000 Hz) and local field potential (LFP; 1–300 Hz) recordings showing a full ictal event occurring after just four periods of illumination in a slice bathed in 20 μm 4-AP. The top two traces show the entire recording, and the bottom two show a zoomed in view of an epileptiform discharge that starts immediately after the end of a period of eNpHR-activation (orange bar). Note how the event persists even when the illumination (eNpHR activation) is resumed. B, Example traces showing three initial patterns of activity in 20 μm 4-AP before eNpHR activation: Type 1, no evidence of any epileptiform activity (12 of 20; black trace); Type 2, occasional brief and small-amplitude interictal events (middle trace, dark gray; n = 4); and Type 3, continual frequent discharges starting within minutes of applying 4-AP (“status epilepticus”; bottom trace, light gray; n = 4). C, eNpHR activation caused a rapid escalation of epileptiform activity, with the appearance of sustained epileptiform bursts (full ictal events) in 15 of 16 (94%) of the recordings that initially showed Type 1 (non-epileptic) and Type 2 (interical events only) activity. Type 3 activity was not obviously modulated by eNpHR activation, persisting also through periods of illumination without changing frequency or amplitude. Halo, Halorhodopsin.

Similar articles

Cited by

References

    1. Alger BE, Nicoll RA. GABA-mediated biphasic inhibitory responses in hippocampus. Nature. 1979;281:315–317. doi: 10.1038/281315a0. - DOI - PubMed
    1. Bernard C, Cossart R, Hirsch JC, Esclapez M, Ben-Ari Y. What is GABAergic inhibition? How is it modified in epilepsy? Epilepsia. 2000;41(Suppl 6):S90–S95. - PubMed
    1. Bragin A, Mody I, Wilson CL, Engel J., Jr Local generation of fast ripples in epileptic brain. J Neurosci. 2002a;22:2012–2021. - PMC - PubMed
    1. Bragin A, Wilson CL, Staba RJ, Reddick M, Fried I, Engel J., Jr Interictal high-frequency oscillations (80–500 Hz) in the human epileptic brain: entorhinal cortex. Ann Neurol. 2002b;52:407–415. doi: 10.1002/ana.10291. - DOI - PubMed
    1. Cammarota M, Losi G, Chiavegato A, Zonta M, Carmignoto G. Fast spiking interneuron control of seizure propagation in a cortical slice model of focal epilepsy. J Physiol. 2013;591:807–822. doi: 10.1113/jphysiol.2012.238154. - DOI - PMC - PubMed

Publication types

MeSH terms